Graphical perception
This application exercise is completed in class and submitted via a Google Form.
Graphical perception
In 1984, William Cleveland and Robert McGill ran an experiment to answer a question that sounds simple but had never been tested: when a chart encodes a quantity as a position, a length, an angle, or an area, how accurately can people actually read it back out? They asked subjects to compare two marked values on a chart and estimate how much smaller one was than the other, then ranked the encodings by how much error each produced. Jeffrey Heer and Michael Bostock replicated the study on Mechanical Turk in 2010 and extended it to areas – bubble charts and treemaps.
Today you will run the experiment on yourself.
Instructions
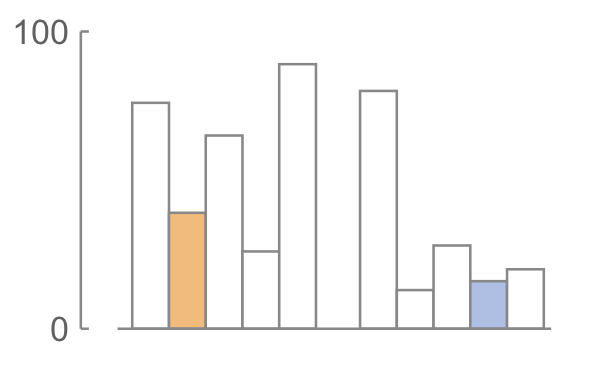
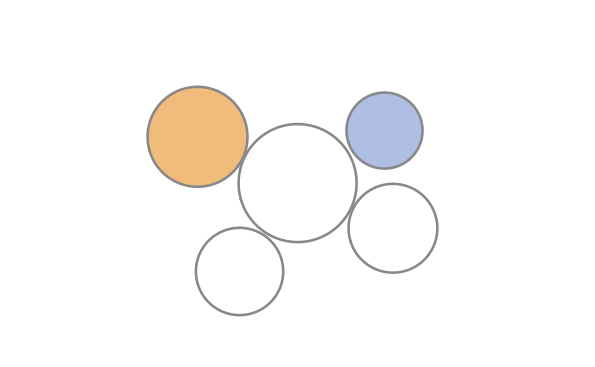
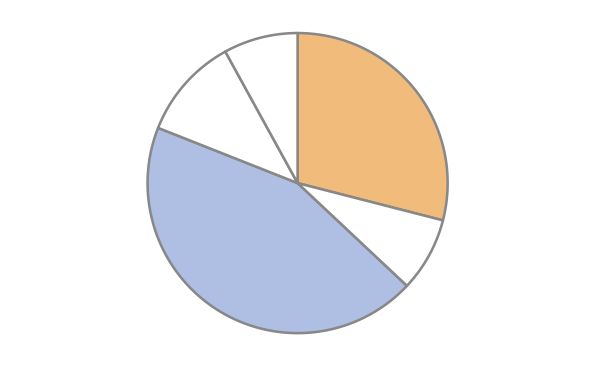
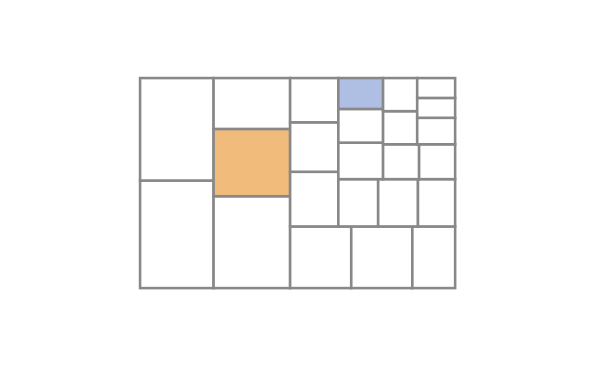
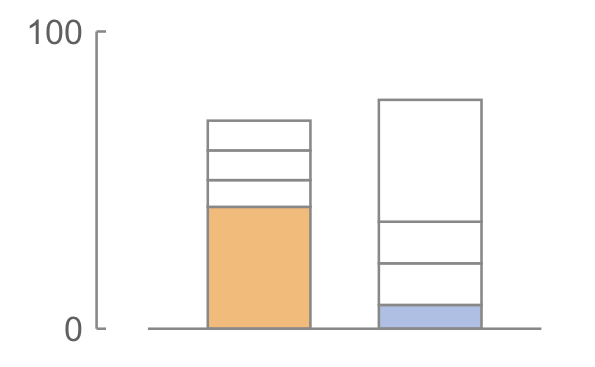
Each of the nine charts below has exactly two marked elements, one orange and one blue. Everything else is context. For each chart:
- Identify which of the two marked elements is smaller.
- Make a quick visual judgment – no measuring, no counting gridlines – estimating what percentage the smaller one is of the larger.
Record both answers on your worksheet before moving to the next chart. Work in order, and do not go back and revise: the point is to capture your first impression, the way a reader encounters a chart in the wild.
The charts
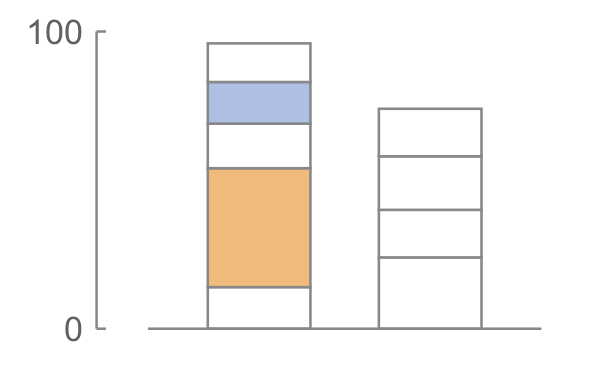
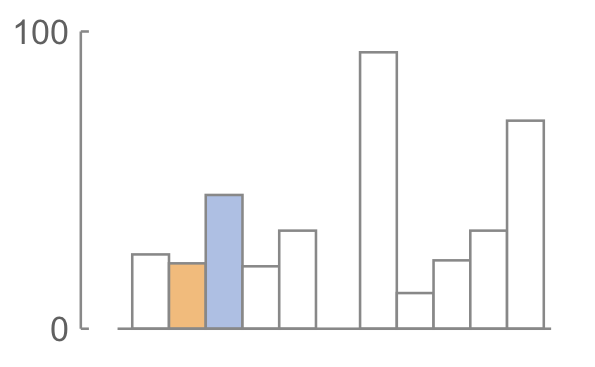
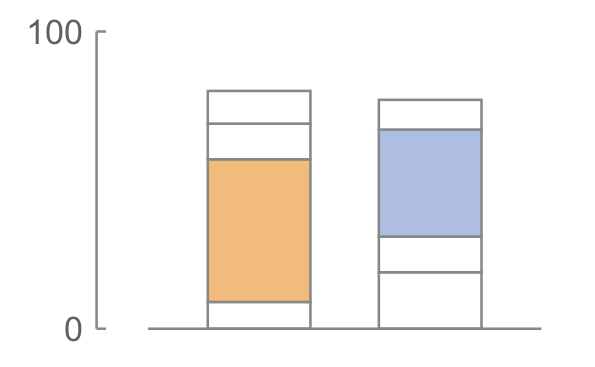
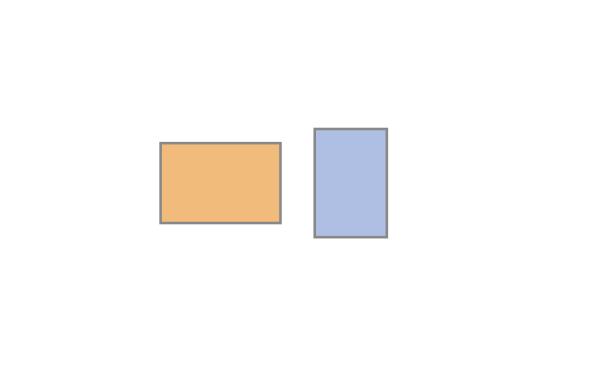
References
- Cleveland, William S., and Robert McGill. 1984. “Graphical Perception: Theory, Experimentation, and Application to the Development of Graphical Methods.” Journal of the American Statistical Association 79: 531–554.
- Heer, Jeffrey, and Michael Bostock. 2010. “Crowdsourcing Graphical Perception: Using Mechanical Turk to Assess Visualization Design.” Proceedings of the SIGCHI Conference on Human Factors in Computing Systems, 203–212. https://doi.org/10.1145/1753326.1753357