usethis::use_git_config(
user.name = "Your name",
user.email = "Email associated with your GitHub account"
)HW 01 - Prefresher
Homework
Important
This homework is due June 3 at 11:59pm ET.
Learning objectives
- Configure your GitHub credentials
- Review common methods for data wrangling
- Implement basic data visualizations with {ggplot2}
Getting started
Access Positron
If you plan to use Posit Workbench
- Go to https://posit-workbench.infosci.cornell.edu and log in with your Cornell NetID and Password.
- Click the “New Session” button on the top of the page. Selection Positron Pro. Leave all the settings on their default state and click “Start Session”. You should now see a Positron session.
If you plan to use your own computer
- Make sure you have completed the software setup instructions.
- Open Positron.
Setup your GitHub authentication
NoteIf you are using your own computer
Run the following code in the R console to ensure you have the required packages installed:
install.packages(c("usethis", "gitcreds", "gh"))In order to push changes to GitHub, you need to authenticate yourself. That is, you need to prove you are the owner of your GitHub account. When you log in to GitHub.com from your browser, you provide your username and password to prove your identity. But when you want to push and pull from your computer, you cannot use this method. Instead, you will prove your identity using one of two methods.
Authenticate using a Personal Access Token (PAT)
Note
This method is preferred since it allows for seamless communication between R and Git for all possible applications.
A personal access token (or PAT) is a string of characters that can be used to authenticate a user when accessing a computer system instead of a username and password. Many online services are shifting towards requiring PATs for security reasons.
With this method you will clone repositories using a regular HTTPS url like https://github.com/<OWNER>/<REPO>.git.
NoteIf you are using Posit Workbench
Configure the Git credential helper by running the following R code in the console:
usethis::use_git_config(credential.helper = "store")Create your personal access token
Run this code from your R console:
usethis::create_github_token(
  scopes = c("repo", "user", "gist", "workflow"),
  description = "Posit Workbench",
  host = "https://github.coecis.cornell.edu/"
)
This is a helper function that takes you to the web form to create a PAT.
- Give the PAT a description (e.g. “PAT for INFO 3312/5312”)
- Leave the remaining options on the pre-filled form selected and click “Generate token”. As the page says, you must store this token somewhere, because you’ll never be able to see it again, once you leave that page or close the window. For now, you can copy it to your clipboard (we will save it in the next step).
If you lose or forget your PAT, just generate a new one.
Store your PAT
In order to store your PAT so you don’t have to reenter it every time you interact with Git, we need to run the following code:
gitcreds::gitcreds_set(url = "https://github.coecis.cornell.edu/")When prompted, paste your PAT into the console and press return. Your credential should now be saved on your computer.
Confirm your PAT is saved
Run the following code:
gh::gh_whoami(.api_url = "https://github.coecis.cornell.edu/")

usethis::git_sitrep()
You should see output that provides information about your GitHub account.
Authenticate using Secure Shell Protocol
Note
You can use this approach to authenticate yourself on GitHub. Note that you may find some limitations communicating with Git outside of standard processes (e.g. cloning/pushing/pulling repos directly), and will still need to create a PAT for some course assignments. However for students using Posit Workbench, the SSH method will work for the entire semester (i.e. set it up once and never have to worry about it again).
NoteInstructions for authenticating with SSH
The Secure Shell Protocol (SSH) is another method for authenticating your identity when communicating with GitHub. While a password can eventually be cracked with a brute force attack, SSH keys are nearly impossible to decipher by brute force alone. Generating a key pair provides you with two long strings of characters: a public and a private key. You can place the public key on any server (like GitHub), and then unlock it by connecting to it with a client that already has the private key (your computer or Posit Workbench). When the two match up, the system unlocks without the need for a password.
The URL for SSH remotes looks like git@github.com:<OWNER>/<REPO>.git. Make sure you use this URL to clone a repository. If you accidentally use the HTTPS version, the operation will not work.
Set up your SSH key
Note
You only need to do this authentication process one time on a single system.
Type
credentials::ssh_keygen()into your console.R will ask “No SSH key found. Generate one now?” You should click 1 for yes.
-
You will generate a key. It will begin with “ssh-rsa….” and look something like this:
$key
[1] "/home/bcs88/.ssh/id_rsa"

$pubkey
[1] "ssh-rsa AAAAB3NzaC1yc2EAAAADAQABAAABAQDJYmJeave083exQwYcIqZJk/Y1mgPxdcTYCTWLL+6mlhN9MM3enjDqb2eZvVJ0JK29NYL1++DTqY/saP08IlswNIMntwaWFDNx42yLsuFrWiPqzm9hWWnRcor/d+4zTrcSIEvfAAnLsYkagNqurrCf2taO62YRepTgxErLvLOG10qn4LKhNfT+PTqdPq2Mr88jXQYYrRxGnOV6oVYf6PurKkiooTsKYxVtJWai8Ek9fhK2y5vaQd5yP0H/3Hbw8Mn+rB+O8Yj6/oQKGBCgxkDB4Aw7T91DkIXlHppneO683Y54WvUftJYvSVsnyt/XuNjvXNAir0+kHETLM32uzH6L"
Copy the entire string of characters (not including the quotation marks) and paste them into the settings page on GitHub. Give the key an informative title such as “INFO 3312/5312 Posit Workbench”. Click “Add SSH key.”
Configure Git
There is one more thing we need to do before getting started on the assignment. Specifically, we need to configure your git so that Positron can communicate with GitHub. This requires two pieces of information: your name and email address.
To do so, you will use the use_git_config() function from the {usethis} package. Type the following lines of code in the console in Positron filling in your name and the email address associated with your GitHub account.
For example, mine would be
usethis::use_git_config(
  user.name = "Benjamin Soltoff",
  user.email = "bcs88@cornell.edu"
)
You are now ready interact with GitHub via Positron!
Clone the repo & start a new Positron workspace
Go to the course organization at https://github.coecis.cornell.edu/info3312-su26 organization on GitHub. Click on the repo with the prefix hw-01. It contains the starter documents you need to complete the homework.
Click on the green CODE button, select HTTPS or SSH based on the authentication method you set up previously. Click on the clipboard icon to copy the repo URL.
In Positron, open the command palette by pressing
Ctrl + Shift + P(orCmd + Shift + Pon a Mac). TypeGit: Cloneand select it from the list.Paste the URL you copied from GitHub into the dialog box that appears.
Choose a location to save the repo on your computer. This will create a new folder with the name of the repo in the location you selected.
Once the cloning is complete, Positron will prompt you to open the cloned repository. Click Open to open the repo in a new Positron workspace.
Click hw-01-prefresher-I.qmd to open the template Quarto file. This is where you will write up your code and narrative for the homework.
R and Positron
Below are the components of the Positron IDE.
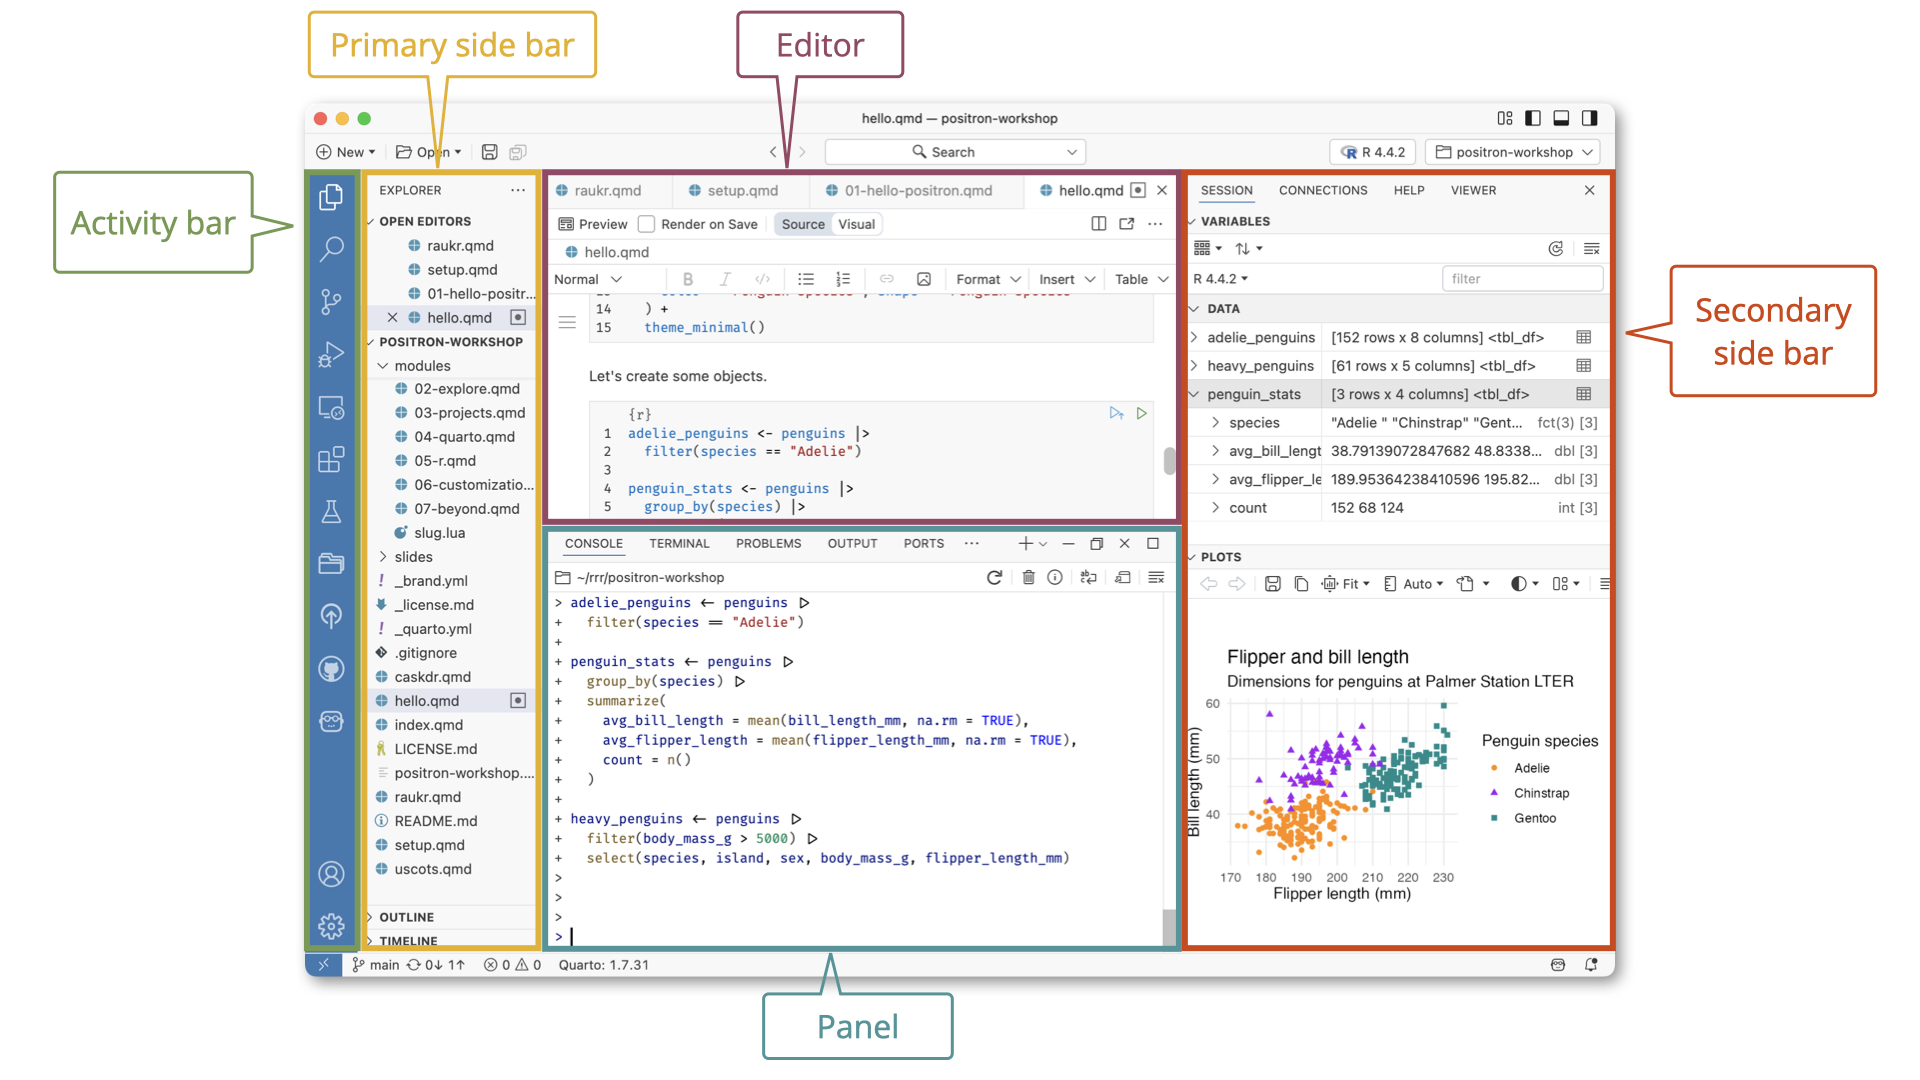
See the Positron documentation for more information on the layout.
YAML
The top portion of your Quarto file (between the three dashed lines) is called YAML. It stands for “YAML Ain’t Markup Language”. It is a human friendly data serialization standard for all programming languages. All you need to know is that this area is called the YAML (we will refer to it as such) and that it contains meta information about your document.
Important
Open the Quarto (.qmd) file in your workspace, change the author name to your name, and render the document. Examine the rendered document.
General guidance
TipGuidelines + tips
As we’ve discussed in lecture, your plots should include an informative title, axes should be labeled, and careful consideration should be given to aesthetic choices.
Remember that continuing to develop a sound workflow for reproducible data analysis is important as you complete the lab and other assignments in this course. There will be periodic reminders in this assignment to remind you to render, commit, and push your changes to GitHub. You should have at least 3 commits with meaningful commit messages by the end of the assignment.
TipWorkflow + formatting
Make sure to
- Update author name on your document.
- Label all code chunks informatively and concisely.
- Follow the Tidyverse code style guidelines.
- Make at least 3 commits.
- Resize figures where needed, avoid tiny or huge plots.
- Turn in an organized, well formatted document.
ImportantBuilt-in R code formatter
Each repository for this course has the Air formatter enabled for R scripts and Quarto documents. From the documentation:
A formatter is in charge of the layout of your R code. Formatters do not change the meaning of code; instead they ensure that whitespace, newlines, and other punctuation conform to a set of rules and standards.
The Air formatter is automatically applied each time you save an R script or Quarto document, and can also be accessed through the command palette.
Packages
ImportantInstalling required packages
Posit Workbench is pre-configured with all the packages you should need for this course. If you are using your own computer, you will need to install the required packages yourself. Most packages can be installed from CRAN using install.packages(), but some are only available on GitHub. GitHub packages can be installed using remotes::install_github("org/repo") where org/repo is the GitHub organization and repository name.
Part 1: College athletics finances
College athletics in the United States are a big business. The Knight Commission on College Athletics is an independent organization that promotes the education, health, safety and success of college athletes. As part of this mission, the Commission maintains a database of college athletics finances for all public schools who compete in Division I (the top college athletics division).1 The data include information on revenues and expenses for each school’s athletics department, as well as information on student fees, enrollment, and other institutional characteristics.
We will analyze the 2024 fiscal year data for all public Division I schools which operate a football program. The data are stored in the file data/ncaa-finances.csv.
Rows: 193
Columns: 34
$ school                                                              <chr> "A…
$ fips                                                                <dbl> 1,…
$ stabbr                                                              <chr> "A…
$ ipeds_id                                                            <dbl> 10…
$ year                                                                <dbl> 20…
$ total_unduplicated_athletes                                         <dbl> 35…
$ number_of_sports_teams                                              <chr> "1…
$ ncaa_subdivision                                                    <chr> "F…
$ fbs_conference                                                      <chr> NA…
$ p4                                                                  <chr> NA…
$ other_revenue                                                       <dbl> 38…
$ corporate_sponsorship_advertising_licensing                         <dbl> 22…
$ donor_contributions                                                 <dbl> 12…
$ competition_guarantees_revenues                                     <dbl> 73…
$ conference_ncaa_distributions_media_rights_and_post_season_football <dbl> 84…
$ ticket_sales                                                        <dbl> 11…
$ institutional_government_support                                    <dbl> 12…
$ student_fees                                                        <dbl> 19…
$ total_revenue                                                       <dbl> 17…
$ allocated_revenue                                                   <dbl> 13…
$ allocated_revenue_pct                                               <dbl> 0.…
$ student_athlete_meals_non_travel                                    <dbl> 21…
$ excess_transfers_back                                               <dbl> 0,…
$ total_coaching_severance                                            <dbl> 0,…
$ other_expenses                                                      <dbl> 23…
$ medical                                                             <dbl> 0,…
$ competition_guarantees_expenses                                     <dbl> 85…
$ recruiting                                                          <dbl> 0,…
$ game_expenses_and_travel                                            <dbl> 23…
$ facilities_debt_service_and_equipment                               <dbl> 46…
$ coaches_compensation                                                <dbl> 21…
$ non_coaching_athletics_staff_compensation                           <dbl> 16…
$ athletic_student_aid                                                <dbl> 39…
$ total_expense                                                       <dbl> 17…
Exercise 1
College athletics burden on students. College athletics programs rely on a range of revenue sources to fund their operations. While some athletics departments are completely self-sufficient (generates all revenues directly through media rights, event tickets, donations, etc.), many college athletic programs rely on student fees to help fund their operations. The NCAA defines student fees as fees “paid by students and allocated for the restricted use of the athletics department.”
College athletics programs are organized into distinct conferences.2 Within the Football Bowl Subdivision (FBS), some conferences are considered “Power 4” conferences due to their larger media contracts and greater overall revenues. These include the Atlantic Coast Conference (ACC), Big Ten Conference, Big 12 Conference, and Southeastern Conference (SEC). Other conferences are considered “Group of 6” conferences.
- Create a boxplot comparing the distribution of student fees (
student_fees) by conference type (p4) for only FBS schools (i.e. exclude non-FBS schools withNAvalues forp4). - Then, plot
p4vs.student_fees. - Remove
NAvalues from the plot. - Include informative title and axis labels.
- Finally, include a brief (2-3 sentence) narrative comparing the distributions of student fees between Power 4 and Group of 6 schools.
Now is a good time to render, commit, and push.
Make sure that you commit and push all changed documents and your Git pane is completely empty before proceeding.
Exercise 2
Coaches’ compensation and institutional funding sources. Coaches’ compensation is often one of the largest expenses for college athletics programs. However, the sources of revenue used to pay for coaches’ salaries can vary widely between schools. Some schools generate a large portion of their athletics revenue directly from the educational institution (e.g. state government allocations, student fees), while others rely more heavily on external revenue sources such as ticket sales, media rights, and donations.
One critique of high coaching salaries is that they divert funds away from educational institutions, especially public universities that receive state funding. But is this actually the case? Do schools that receive a greater percentage of their athletics revenue directly from the educational institution tend to pay their coaches more?
Construct a scatterplot to visualize the relationship between the percentage of athletics revenue from the educational institution (allocated_revenue_pct) and total coaches’ compensation (coaches_compensation). Include a smoothing trend line to summarize the relationship. Remember to include informative title and axis labels. Finally, include a brief (2-3 sentence) narrative commenting on the relationship between these two variables.
Now is a good time to render, commit, and push.
Make sure that you commit and push all changed documents and your Git pane is completely empty before proceding.
Part 2: They’re eating the dogs, they’re eating the cats!
Exercise 3
Report on American attitudes on the consumption of various animals. YouGov polled 1,000 U.S. adult citizens on topics related to vegetarianism and the eating of meat. Question 19 specifically asked respondents
Setting aside your own dietary preferences, do you think it is morally acceptable or unacceptable for other people to eat the following animal under normal circumstances?
The cross-tabulation table reporting the results is stored in data/eating-animals.csv. Use the data set to reproduce the visualization below.
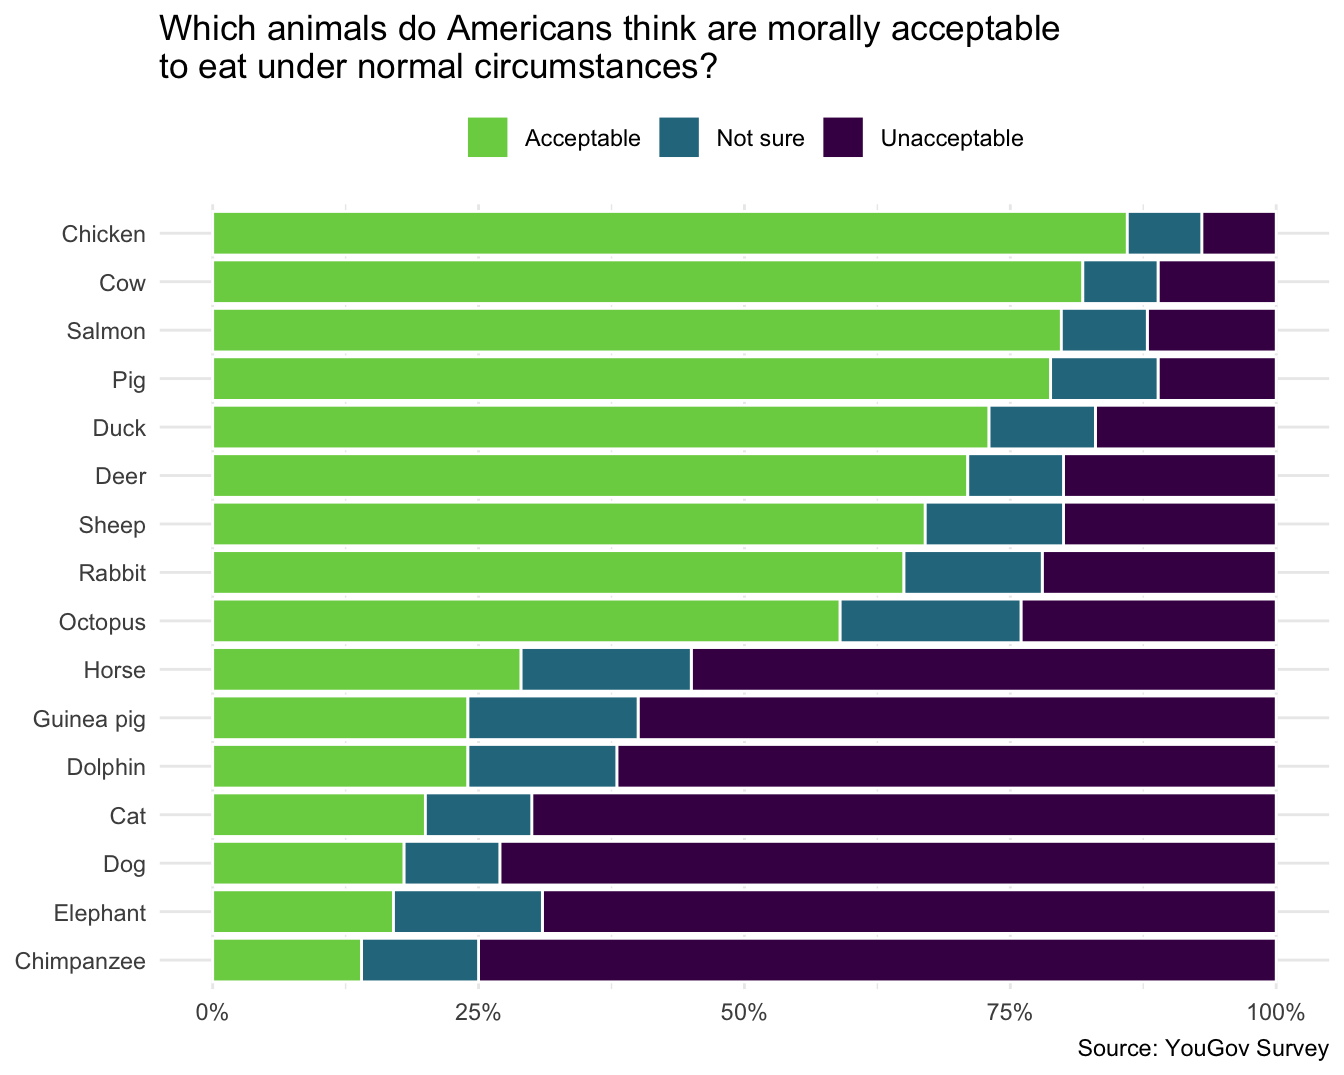
Note
Your plot need not be exactly the same in terms of its dimensions, color palette, etc. However, it should be as close as possible.
Now is a good time to render, commit, and push.
Make sure that you commit and push all changed documents and your Git pane is completely empty before proceeding.
Part 3: The economics of prison commissaries
Prison commissaries in the United States have been accused of inflating the cost of essential items sold to incarcerated individuals at significantly higher prices than those charged outside of prison. To investigate these claims, The Appeal compiled a national database of prison commissary lists. The resulting raw price data can be found in data/commissary-prices.csv.
Use the data set to answer the following questions.
Exercise 4
Which states have the most expensive Ramen on average? Calculate the average price of ramen per state and print a table reporting the 10 most expensive states and their average price.
Now is a good time to render, commit, and push.
Make sure that you commit and push all changed documents and your Git pane is completely empty before proceeding.
Exercise 5
Which states have the cheapest deodorant? Calculate the lowest price for deodorant per state and print a table reporting the 10 least expensive states and their minimum price.
Now is a good time to render, commit, and push.
Make sure that you commit and push all changed documents and your Git pane is completely empty before proceeding.
Generative AI (GAI) self-reflection
As stated in the syllabus, include a written reflection for this assignment of how you used GAI tools (e.g. what tools you used, how you used them to assist you with writing code), what skills you believe you acquired, and how you believe you demonstrated mastery of the learning objectives.
Render, commit, and push one last time.
Make sure that you commit and push all changed documents and your Git pane is completely empty before proceeding.
Wrap up
Submission
- Go to http://www.gradescope.com and click Log in in the top right corner.
- Click School Credentials \(\rightarrow\) Cornell University NetID and log in using your NetID credentials.
- Click on your INFO 3312 course.
- Click on the assignment, and you’ll be prompted to submit it.
- Mark all the pages associated with exercise. All the pages of homework should be associated with at least one question (i.e., should be “checked”).
Grading
- Exercise 1: 8 points
- Exercise 2: 10 points
- Exercise 3: 16 points
- Exercise 4: 8 points
- Exercise 5: 8 points
- Total: 50 points