HW 06 - Using interactivity for data communication
This homework is due April 23 at 11:59pm ET.
Learning objectives
- Develop compelling data-driven stories
- Implement animation and interactivity in data communication
- Effectively utilize client-side interactivity
Getting started
Go to the info3312-sp25 organization on GitHub. Click on the repo with the prefix hw-06. It contains the starter documents you need to complete the lab.
Clone the repo and start a new project in RStudio.
General guidance
As we’ve discussed in lecture, your plots should include an informative title, axes should be labeled, and careful consideration should be given to aesthetic choices.
Remember that continuing to develop a sound workflow for reproducible data analysis is important as you complete the lab and other assignments in this course. There will be periodic reminders in this assignment to remind you to render, commit, and push your changes to GitHub. You should have at least 3 commits with meaningful commit messages by the end of the assignment.
Make sure to
- Update author name on your document.
- Label all code chunks informatively and concisely.
- Follow the Tidyverse code style guidelines.
- Make at least 3 commits.
- Resize figures where needed, avoid tiny or huge plots.
- Turn in an organized, well formatted document.
Exercises
For this assignment, you only need to complete 2 of the 3 exercises below.
Each exercise will be completed in a separate Quarto document. hw-06.qmd is only necessary for the final submission to Gradescope. In that file, edit the YAML header and replace TODO with your netID.
params:
  netid: "TODO"
This will be used to automatically generate visible links to your published exercises so we can evaluate them. If we cannot see the published exercises, we cannot evaluate them.
Exercise 1
animate.qmd for this exercise
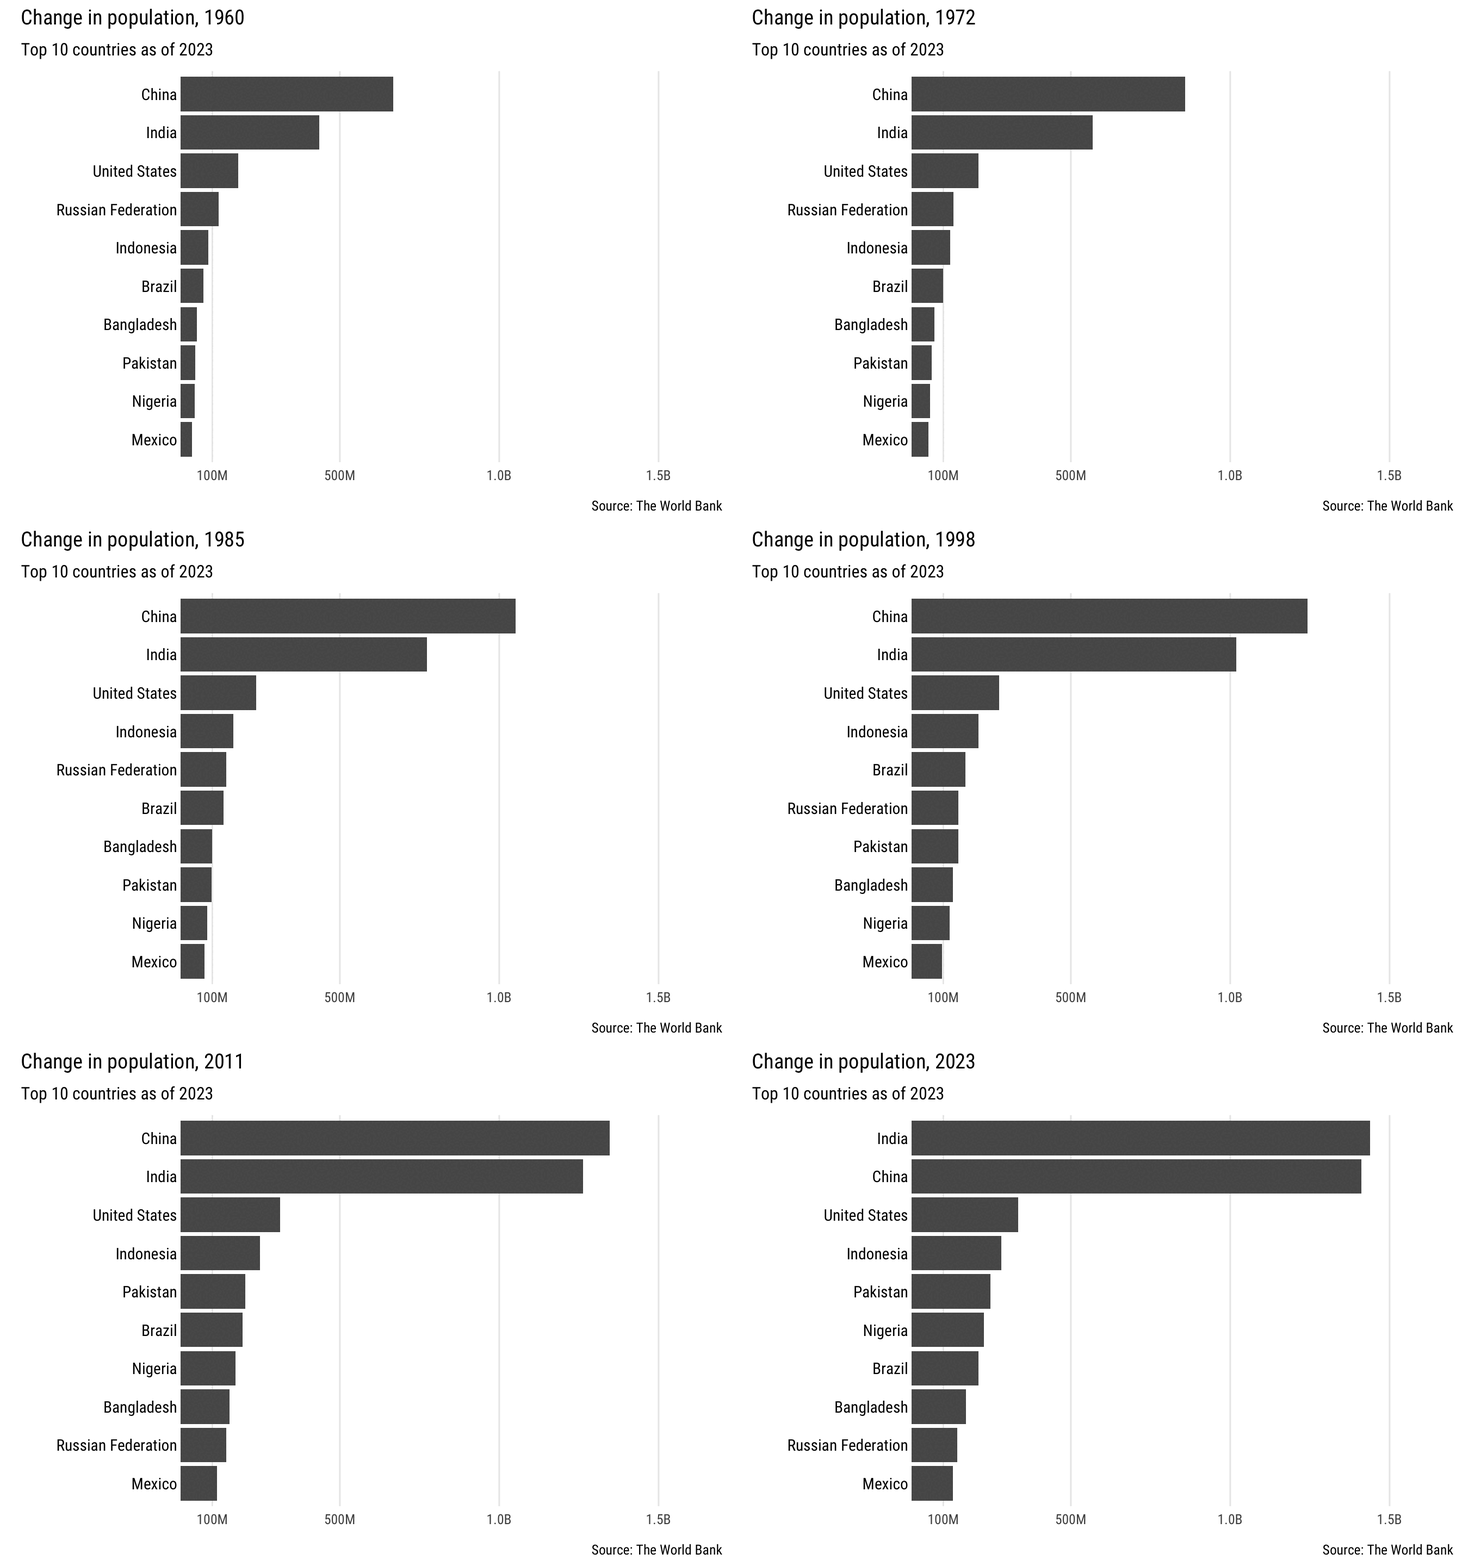
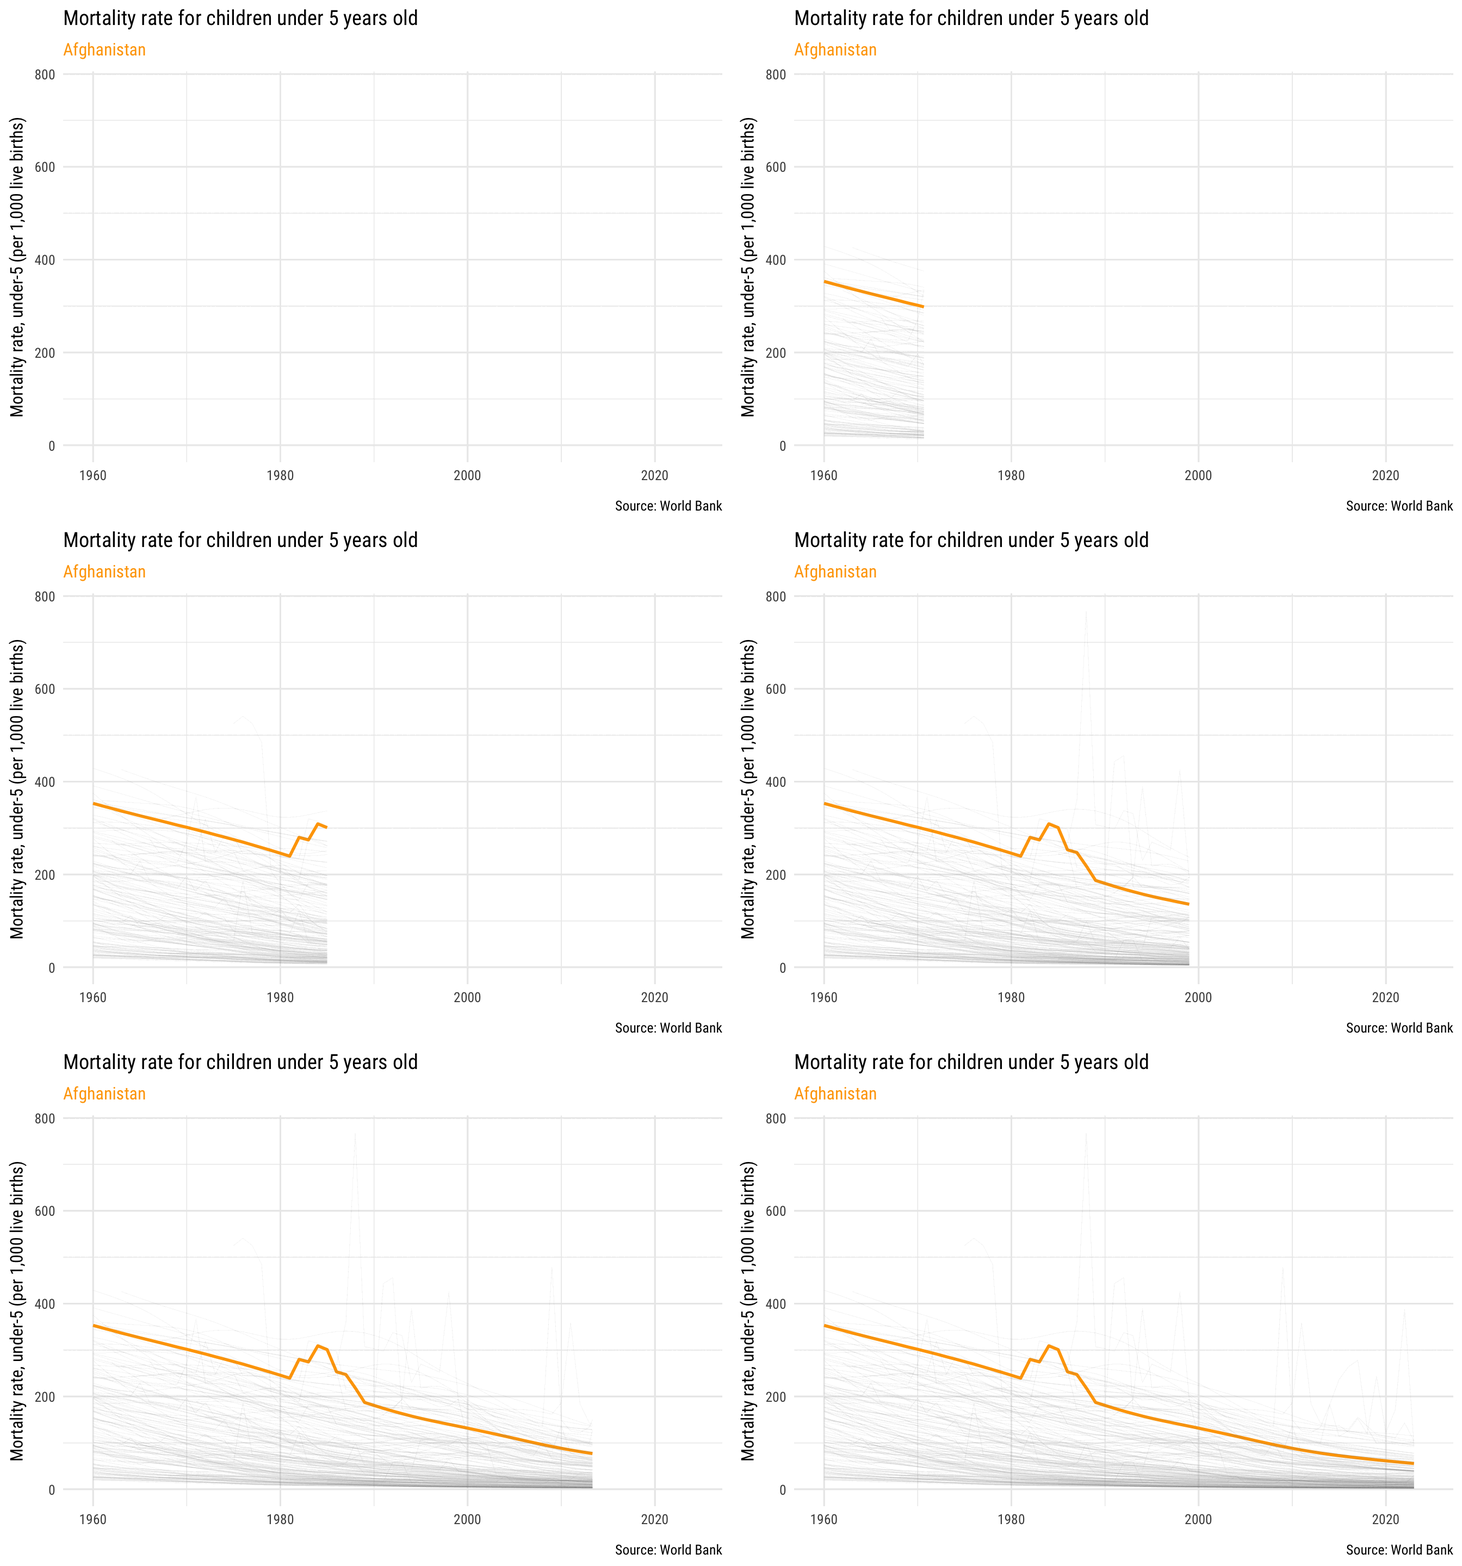
Effectively animate a chart. Animate a data visualization using {gganimate} to tell a story using data from the World Bank. Examples of things you might do include:
You can search through the World Bank’s Open Data using their website. Data can be directly downloaded or imported into R using {wbstats}. Your focus should be on designing and implementing an effective, high-quality animation that answers a question you define. Include at least one paragraph interpreting the results of your animated chart.
Exercise 2
scrollytell.qmd for this exercise
Make a scrollytelling article. Use Closeread to create a scrollytelling article. Feel free to extend analysis you previously conducted in the class from an application exercise, homework, or your first team project. Or find a completely new dataset and write a brief article. The article need not be extensive but should make effective use of at least two distinct focus effects.
Exercise 3
dashboard.qmd for this exercise
Build a dashboard. Use Quarto to build an effective, high-quality dashboard related to a topic of your interest. A few data sets that would lend themselves to viable dashboards include:
- World Bank
- American Community Survey1
- World Happiness Report - I recommend using the panel dataset reporting happiness over time available as an Excel spreadsheet.2
At minimum, your dashboard must include at least 4 distinct components (e.g. charts, tables, value cards, text), of which at least 2 need to be interactive charts.
Generative AI (GAI) self-reflection
As stated in the syllabus, include a written reflection for this assignment of how you used GAI tools (e.g. what tools you used, how you used them to assist you with writing code), what skills you believe you acquired, and how you believe you demonstrated mastery of the learning objectives.
Wrap up
Submission
You will still submit a PDF to Gradescope that contains your source code for each exercise, but you also need to publish the rendered Quarto files in your repo using GitHub Pages.
When you render each Quarto document, the output files should automatically be saved in the
docs/folder. Make sure those files are committed and pushed to GitHub by the submission deadline. You can check to make sure they are visible by using these links (replaceNETIDwith your netID):https://pages.github.coecis.cornell.edu/info3312-sp25/hw-06-NETID/animate.html
https://pages.github.coecis.cornell.edu/info3312-sp25/hw-06-NETID/scrollytell.html
https://pages.github.coecis.cornell.edu/info3312-sp25/hw-06-NETID/dashboard.htmlOnce you are finished with the exercises, make sure you have updated the YAML header in
hw-06.qmdand completed your GAI self-reflection. Then follow the instructions below to submit your assignment to Gradescope.
- Go to http://www.gradescope.com and click Log in in the top right corner.
- Click School Credentials \(\rightarrow\) Cornell University NetID and log in using your NetID credentials.
- Click on your INFO 3312 course.
- Click on the assignment, and you’ll be prompted to submit it.
- Mark all the pages associated with exercise. All the pages of homework should be associated with at least one question (i.e., should be “checked”).
Grading
- Exercise 1: 25 points
- Exercise 2: 25 points
- Exercise 3: 25 points
- Total: 50 points3


