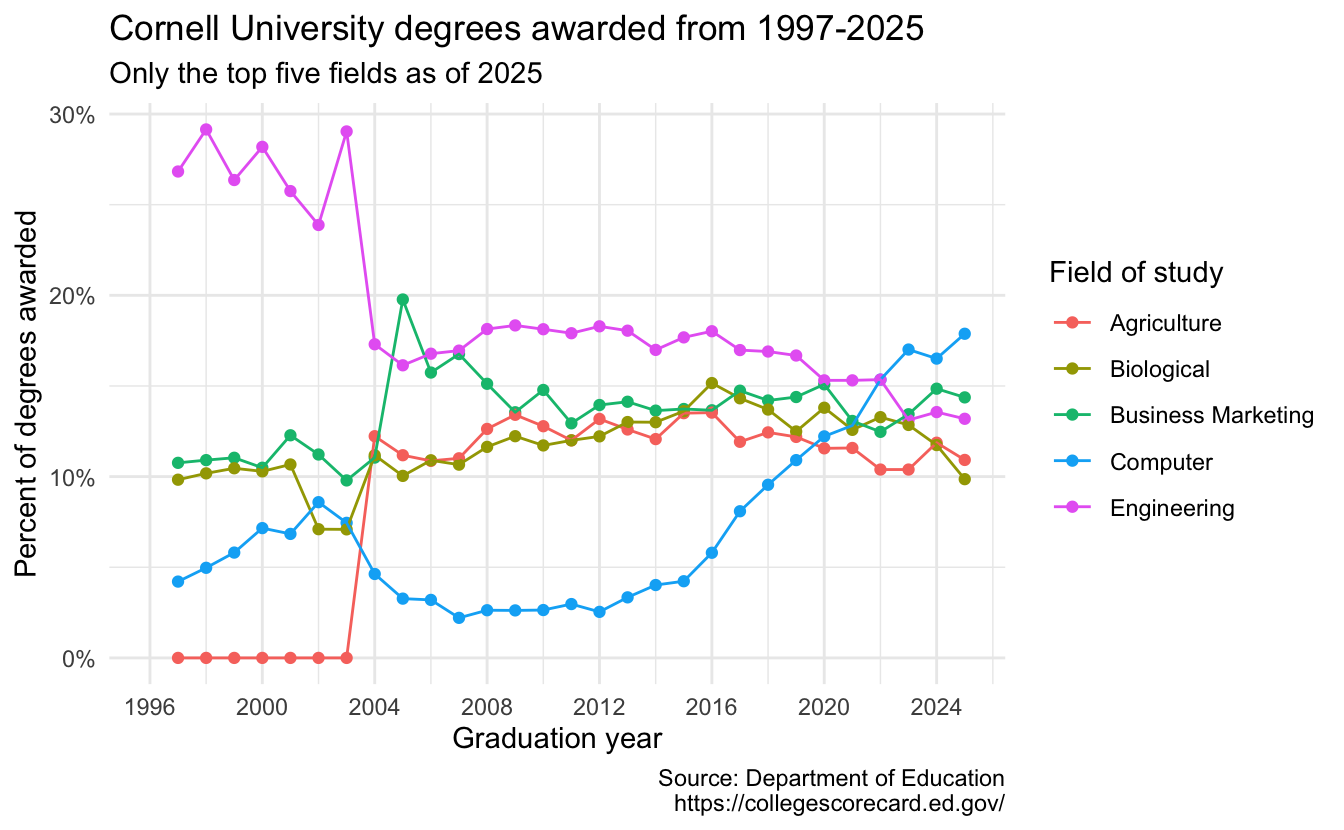
Making a chart accessible: Cornell degrees awarded over time
Suggested answers
Application exercise
Answers
Apply accessible design principles to improve the quality of a chart.
Note
This application exercise is completed in class and submitted via a worksheet.
Our goal is to make this chart depicting the percentage of degrees awarded by Cornell University over time more accessible.
Data
The data come from the Department of Education’s College Scorecard and has been structured as one row per field of study per year.
# A tibble: 145 × 3
   field_of_study  year    pct
   <chr>          <dbl>  <dbl>
 1 Computer        1997 0.0421
 2 Computer        1998 0.0497
 3 Computer        1999 0.0581
 4 Computer        2000 0.0716
 5 Computer        2001 0.0684
 6 Computer        2002 0.0859
 7 Computer        2003 0.0745
 8 Computer        2004 0.0463
 9 Computer        2005 0.0327
10 Computer        2006 0.032
# ℹ 135 more rows
Brainstorm improvements
Your turn: Write alternative text for the chart.
Your turn: Identify how the chart above could be improved to make it more accessible using techniques discussed in class.
Implement your improvements
Now try implementing your proposed suggestions in the code cell below.
Possible solutions
Keep it in a single plot
cornell_deg |>
mutate(
field_of_study = fct_relevel(
.f = field_of_study,
"Computer",
"Business Marketing",
"Engineering",
"Agriculture",
"Biological"
)
) |>
ggplot(
mapping = aes(
x = year,
y = pct,
color = field_of_study,
linetype = field_of_study
)
) +
geom_point() +
geom_line(linewidth = 1) +
scale_x_continuous(limits = c(1996, 2025), breaks = seq(1996, 2025, 4)) +
scale_color_colorblind(black = FALSE) +
scale_y_continuous(labels = label_percent()) +
labs(
x = "Graduation year",
y = "Percent of degrees awarded",
color = "Field of study",
linetype = "Field of study"
) +
theme_minimal(
base_size = 12,
base_family = "Atkinson Hyperlegible"
)- 1
- Order the fields of study so that the most frequent ones at the end of the time series are listed first.
- 2
- Increase the line width to make it easier to see the lines.
- 3
- Use a colorblind-friendly palette to make it easier to distinguish the lines. Do not use black from the palette because it makes the category look emphasized compared to the other palette colors.
- 4
- Move the title, subtitle, and caption to the figure caption in Quarto. Also allows the hyperlink to be embedded in the text.
- 5
- Increase the base font size to make it easier to read.
- 6
- Use a font that is easier to read, such as Atkinson Hyperlegible.
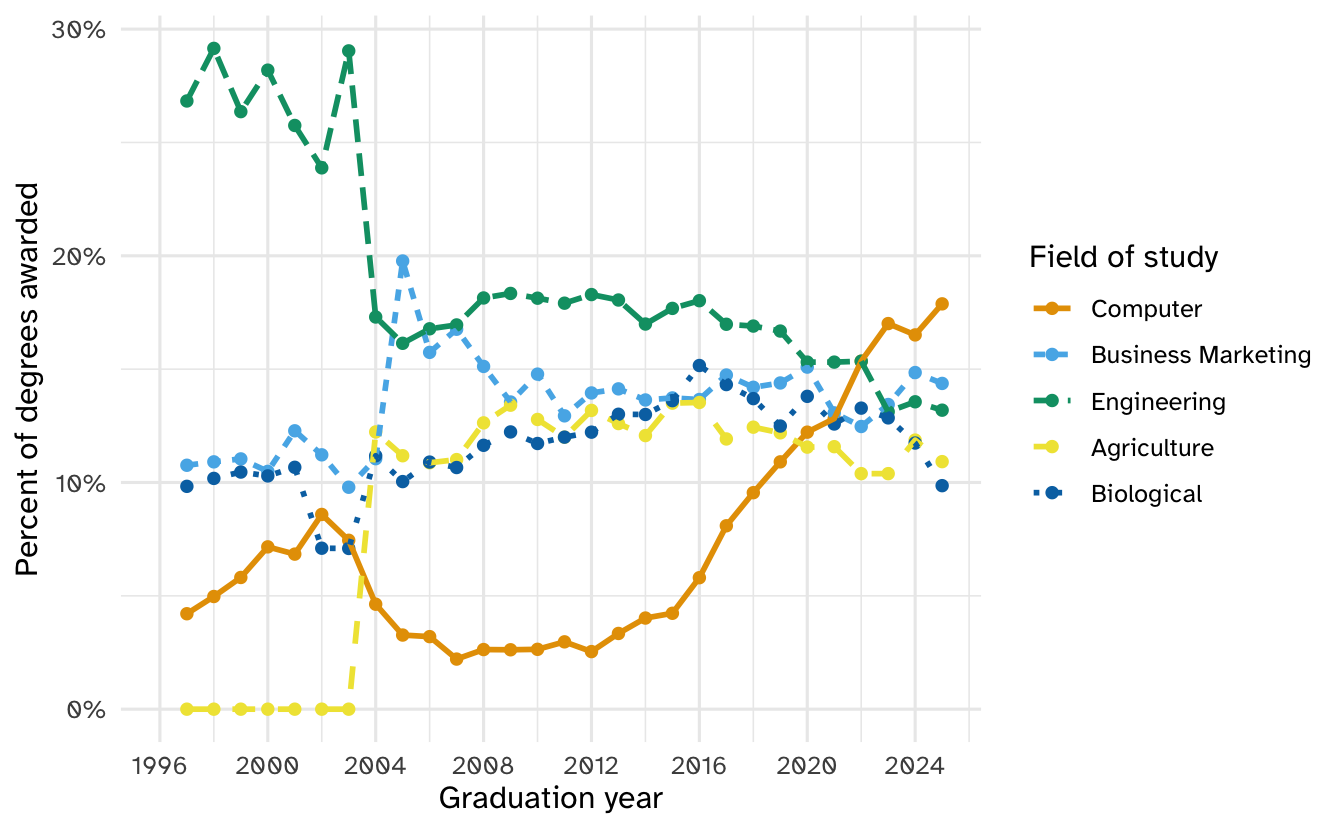
Only the top five fields as of 2025
Source: Department of Education
Use faceting and highlighting
cornell_deg_ordered <- cornell_deg |>
mutate(
field_of_study = fct_relevel(
.f = field_of_study,
"Computer",
"Business Marketing",
"Engineering",
"Agriculture",
"Biological"
)
)
ggplot(
data = cornell_deg_ordered,
mapping = aes(
x = year,
y = pct
)
) +
geom_line(
data = cornell_deg_ordered |>
rename(group_field = field_of_study),
mapping = aes(group = group_field),
color = "grey50"
) +
geom_line(linewidth = 1, color = "orange") +
scale_x_continuous(limits = c(1996, 2025), breaks = seq(1996, 2025, 8)) +
scale_y_continuous(labels = label_percent()) +
facet_wrap(facets = vars(field_of_study)) +
labs(
x = "Graduation year",
y = "Percent of degrees awarded",
) +
theme_minimal(
base_size = 12,
base_family = "Atkinson Hyperlegible"
)- 1
- Order the fields of study so that the most frequent ones at the end of the time series are listed first.
- 2
- Add a grey line for all fields of study to provide context for the highlighted field.
- 3
-
Rename the
field_of_studycolumn so this layer is not used for faceting, but still preserve the ability to draw separate lines for each field of study. - 4
- Highlight the line for the field of study in the facet.
- 5
- Use faceting to separate the fields of study into their own panels.
- 6
- Increase the spacing between the \(x\)-axis ticks to make it easier to read.
- 7
- Increase the base font size to make it easier to read.
- 8
- Use a font that is easier to read, such as Atkinson Hyperlegible.
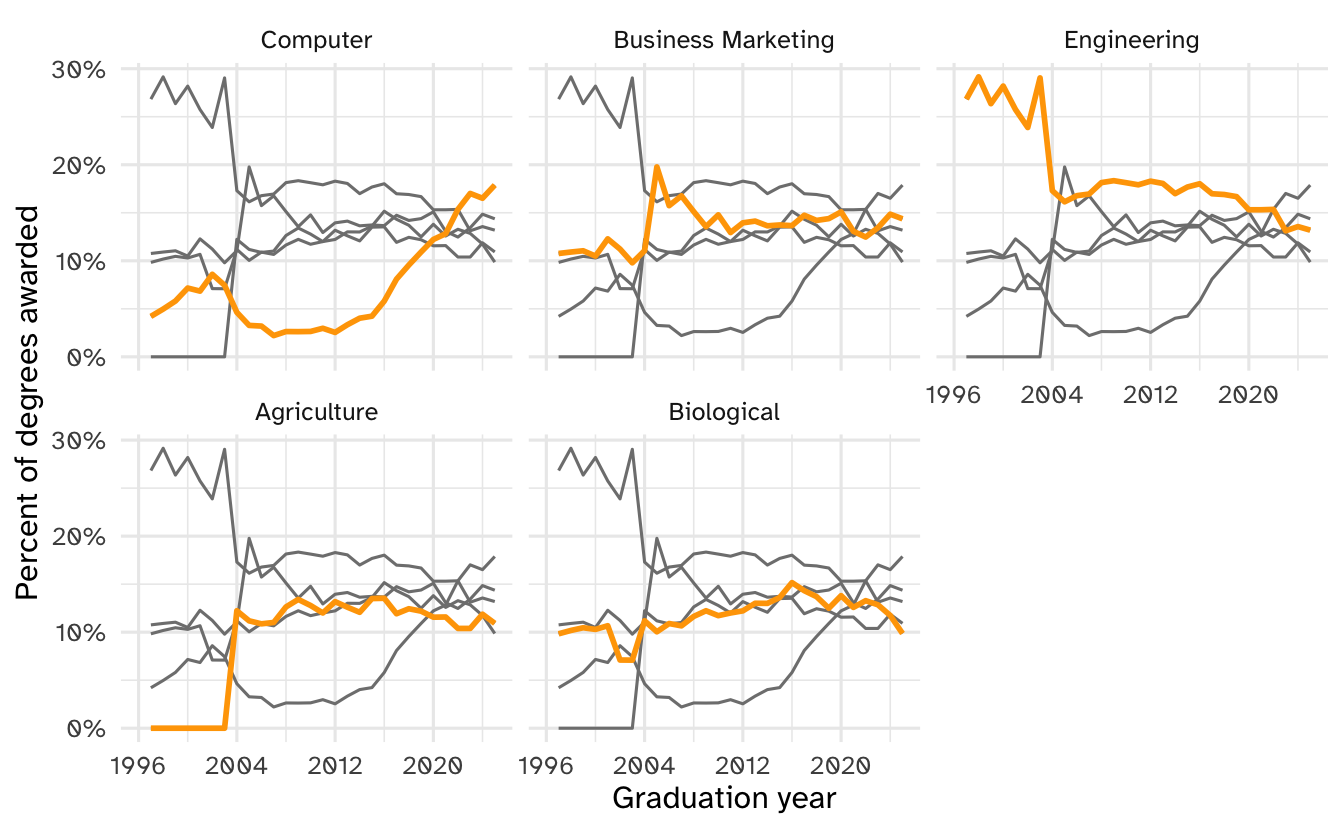
Only the top five fields as of 2025
Source: Department of Education
NoteSession information
sessioninfo::session_info()─ Session info ───────────────────────────────────────────────────────────────
setting value
version R version 4.6.1 (2026-06-24)
os macOS Golden Gate 27.0.1
system aarch64, darwin23
ui X11
language (EN)
collate en_US.UTF-8
ctype en_US.UTF-8
tz America/New_York
date 2026-10-27
pandoc 3.10 @ /Applications/Positron.app/Contents/Resources/app/quarto/bin/tools/aarch64/ (via rmarkdown)
quarto 1.11.5 @ /Applications/quarto/bin/quarto
─ Packages ───────────────────────────────────────────────────────────────────
! package * version date (UTC) lib source
P bit 4.6.0 2025-03-06 [?] RSPM
P bit64 4.8.2 2026-05-19 [?] RSPM
P cli 3.6.6 2026-04-09 [?] RSPM
P crayon 1.5.3 2024-06-20 [?] RSPM
P digest 0.6.39 2025-11-19 [?] RSPM
P dplyr * 1.2.1 2026-04-03 [?] RSPM
P evaluate 1.0.5 2025-08-27 [?] RSPM
P farver 2.1.2 2024-05-13 [?] RSPM
P fastmap 1.2.0 2024-05-15 [?] RSPM
P forcats * 1.0.1 2025-09-25 [?] RSPM
P generics 0.1.4 2025-05-09 [?] RSPM
P ggplot2 * 4.0.3 2026-04-22 [?] RSPM
P ggthemes * 7.0.0 2026-10-03 [?] RSPM
P glue 1.8.1 2026-04-17 [?] RSPM
P gtable 0.3.6 2024-10-25 [?] RSPM
P here * 1.0.2 2025-09-15 [?] RSPM
P hms 1.1.4 2025-10-17 [?] RSPM
P htmltools 0.5.9 2025-12-04 [?] RSPM
P htmlwidgets 1.6.4 2023-12-06 [?] RSPM
P jsonlite 2.0.0 2025-03-27 [?] RSPM
P knitr 1.51 2025-12-20 [?] RSPM
P labeling 0.4.3 2023-08-29 [?] RSPM
P lifecycle 1.0.5 2026-01-08 [?] RSPM
P lubridate * 1.9.5 2026-02-04 [?] RSPM
P magrittr 2.0.5 2026-04-04 [?] RSPM
P otel 0.2.0 2025-08-29 [?] RSPM
P pillar 1.11.1 2025-09-17 [?] RSPM
P pkgconfig 2.0.3 2019-09-22 [?] RSPM
P purrr * 1.2.2 2026-04-10 [?] RSPM
P R6 2.6.1 2025-02-15 [?] RSPM
P RColorBrewer 1.1-3 2022-04-03 [?] RSPM
P readr * 2.2.0 2026-02-19 [?] RSPM
P renv 1.3.1 2026-10-06 [?] RSPM
P rlang 1.3.0 2026-07-05 [?] RSPM
P rmarkdown 2.31 2026-03-26 [?] RSPM
P rprojroot 2.1.1 2025-08-26 [?] RSPM
P S7 0.2.2 2026-04-22 [?] RSPM
P scales * 1.4.0 2025-04-24 [?] RSPM
P sessioninfo 1.2.4 2026-06-04 [?] RSPM
P stringi 1.8.9 2026-08-04 [?] RSPM
P stringr * 1.6.0 2025-11-04 [?] RSPM
P tibble * 3.3.1 2026-01-11 [?] RSPM
P tidyr * 1.3.2 2025-12-19 [?] RSPM
P tidyselect 1.2.1 2024-03-11 [?] RSPM
P tidyverse * 2.0.0 2023-02-22 [?] RSPM
P timechange 0.4.0 2026-01-29 [?] RSPM
P tzdb 0.5.0 2025-03-15 [?] RSPM
P utf8 1.2.6 2025-06-08 [?] RSPM
P vctrs 0.7.3 2026-04-11 [?] RSPM
P vroom 1.7.1 2026-03-31 [?] RSPM
P withr 3.0.3 2026-06-19 [?] RSPM
P xfun 0.60 2026-07-09 [?] RSPM
P yaml 2.3.12 2025-12-10 [?] RSPM
[1] /Users/bcs88/Projects/info-3312/course-site/renv/library/macos/R-4.6/aarch64-apple-darwin23
[2] /Users/bcs88/Library/Caches/org.R-project.R/R/renv/sandbox/macos/R-4.6/aarch64-apple-darwin23/46003b10
* ── Packages attached to the search path.
P ── Loaded and on-disk path mismatch.
──────────────────────────────────────────────────────────────────────────────