Sizing and arranging plots
Sample plots
gapminder_07 <- filter(.data = gapminder, year == 2007)
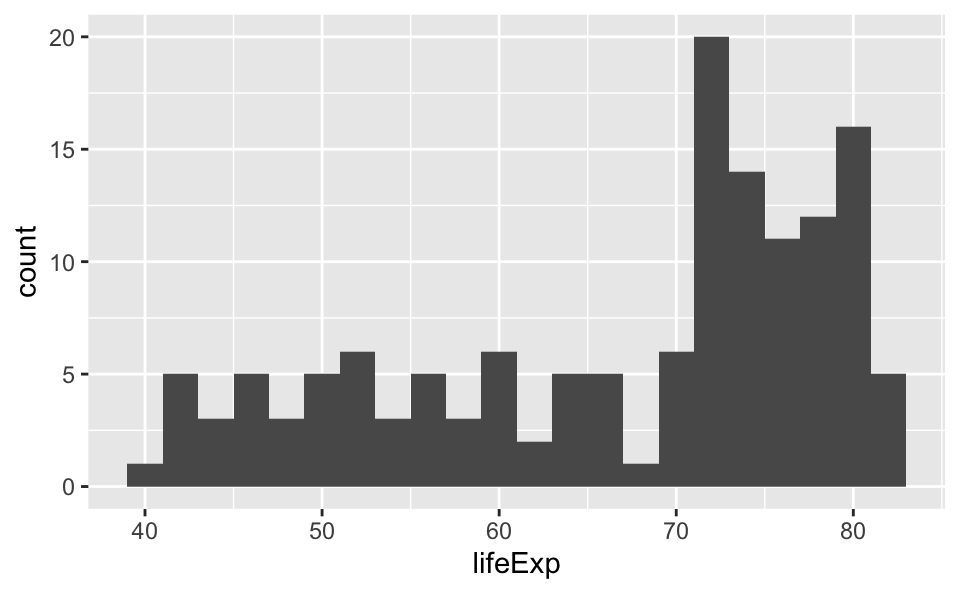
p_hist <- ggplot(data = gapminder_07, mapping = aes(x = lifeExp)) +
geom_histogram(binwidth = 2)
p_box <- ggplot(data = gapminder_07, mapping = aes(x = continent, y = lifeExp)) +
geom_boxplot()
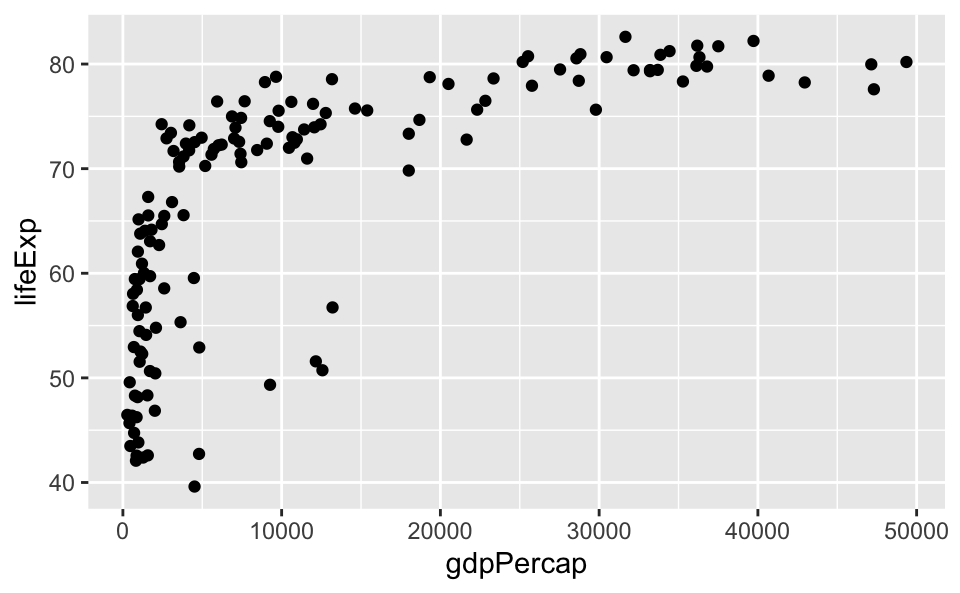
p_scatter <- ggplot(data = gapminder_07, mapping = aes(x = gdpPercap, y = lifeExp)) +
geom_point()
p_text <- gapminder_07 |>
filter(continent == "Americas") |>
ggplot(mapping = aes(x = gdpPercap, y = lifeExp)) +
geom_text_repel(mapping = aes(label = country)) +
coord_cartesian(clip = "off")Plot size
By default, plots will expand to take up as much available space on the slides.
## Slide with single plot, little text

The plot will fill the empty space in the slide.

```{r}
p_hist
```

## Slide with single plot, lots of text

-   If there is more text on the slide

-   The plot will shrink

-   To make room for the text

```{r}
p_hist
```
Adjusting the figure size
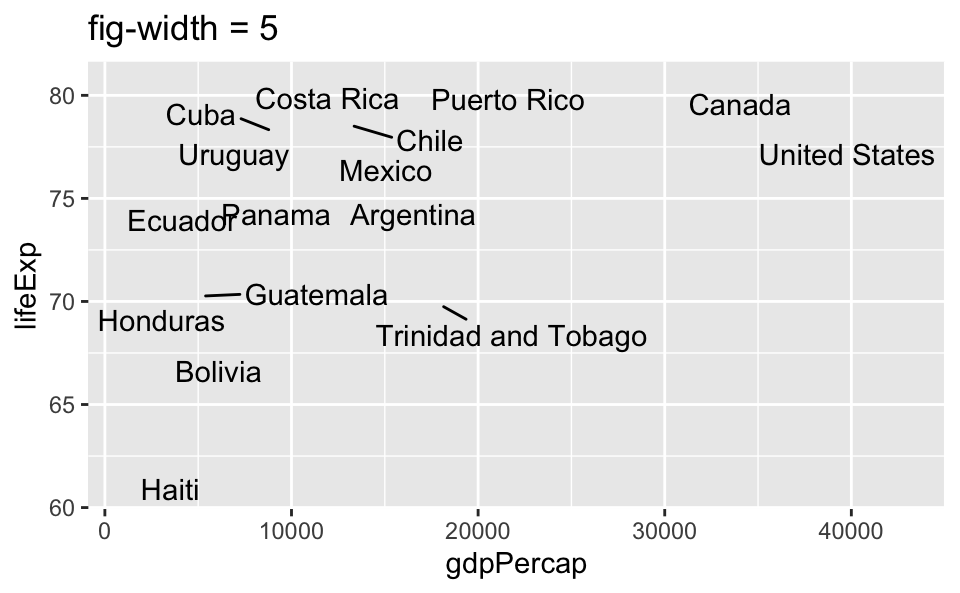
Quarto contains a number of options for figures generated from code. For example, fig-width controls the width of the rendered figure. For a zoomed-in look:
```{r}
#| fig-width: 3
#| fig-asp: 0.618
p_hist
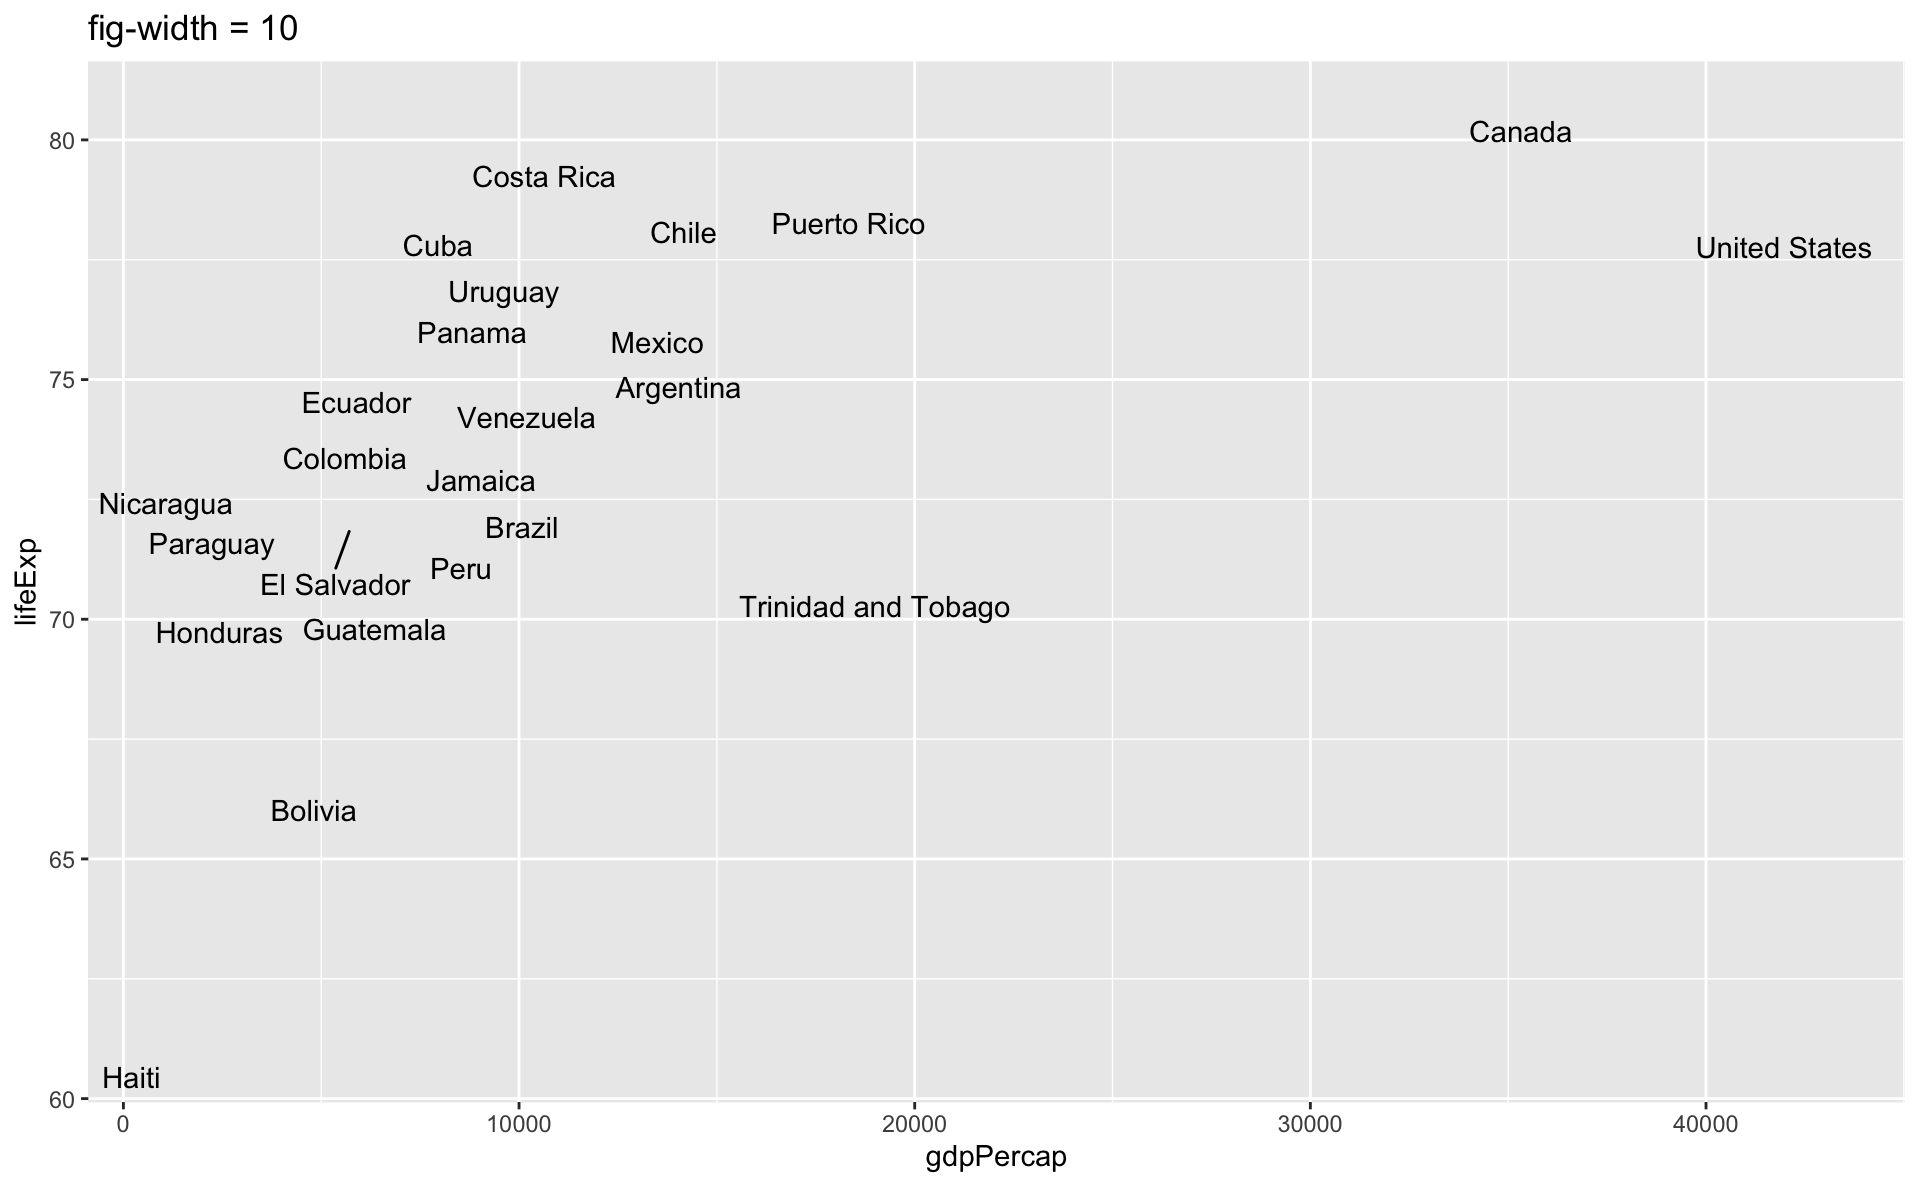
```For a zoomed-out look:
```{r}
#| fig-width: 10
#| fig-asp: 0.618

p_hist
```
Be aware that fig-width affects the size of text on the plot.
Arranging plots
Multiple plots on a slide
First, ask yourself, must you include multiple plots on a slide? For example, is your narrative about comparing results from two plots?
If no, then don’t! Move the second plot to to the next slide!
-
If yes:
Insert columns using the Insert anything tool
Use
layout-ncolchunk optionUse the {patchwork} package
Possibly, use pivoting to reshape your data and then use facets
Columns
Insert > Slide Columns
Quarto will automatically resize your plots to fit side-by-side.
Use layout-ncol chunk option
```{r}
#| fig-width: 5
#| layout-ncol: 2
#| out-width: 100%

p_hist
p_scatter
```
Arrange plots with {patchwork}
{patchwork} is a package primarily designed to make it simple for users to combine multiple ggplot()s into a single figure. The resulting charts are all single image files, rather than multiple images arranged using HTML.
The layouts can be relatively simple or quite complex.
p_hist + p_scatter
(p_hist + p_box) /
  (p_scatter + p_text)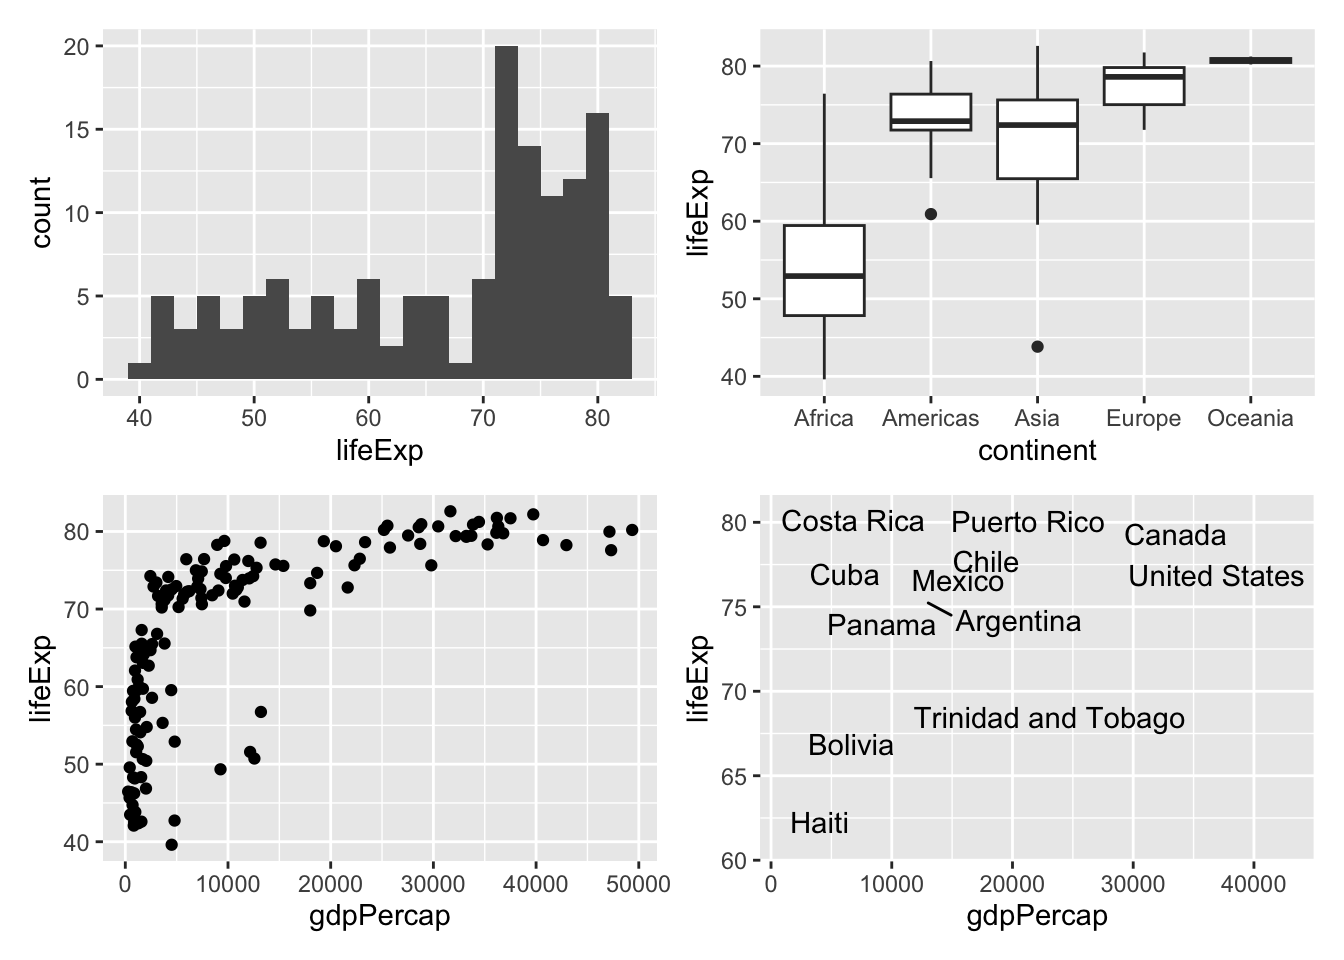
p_text / (p_hist + p_box + p_scatter)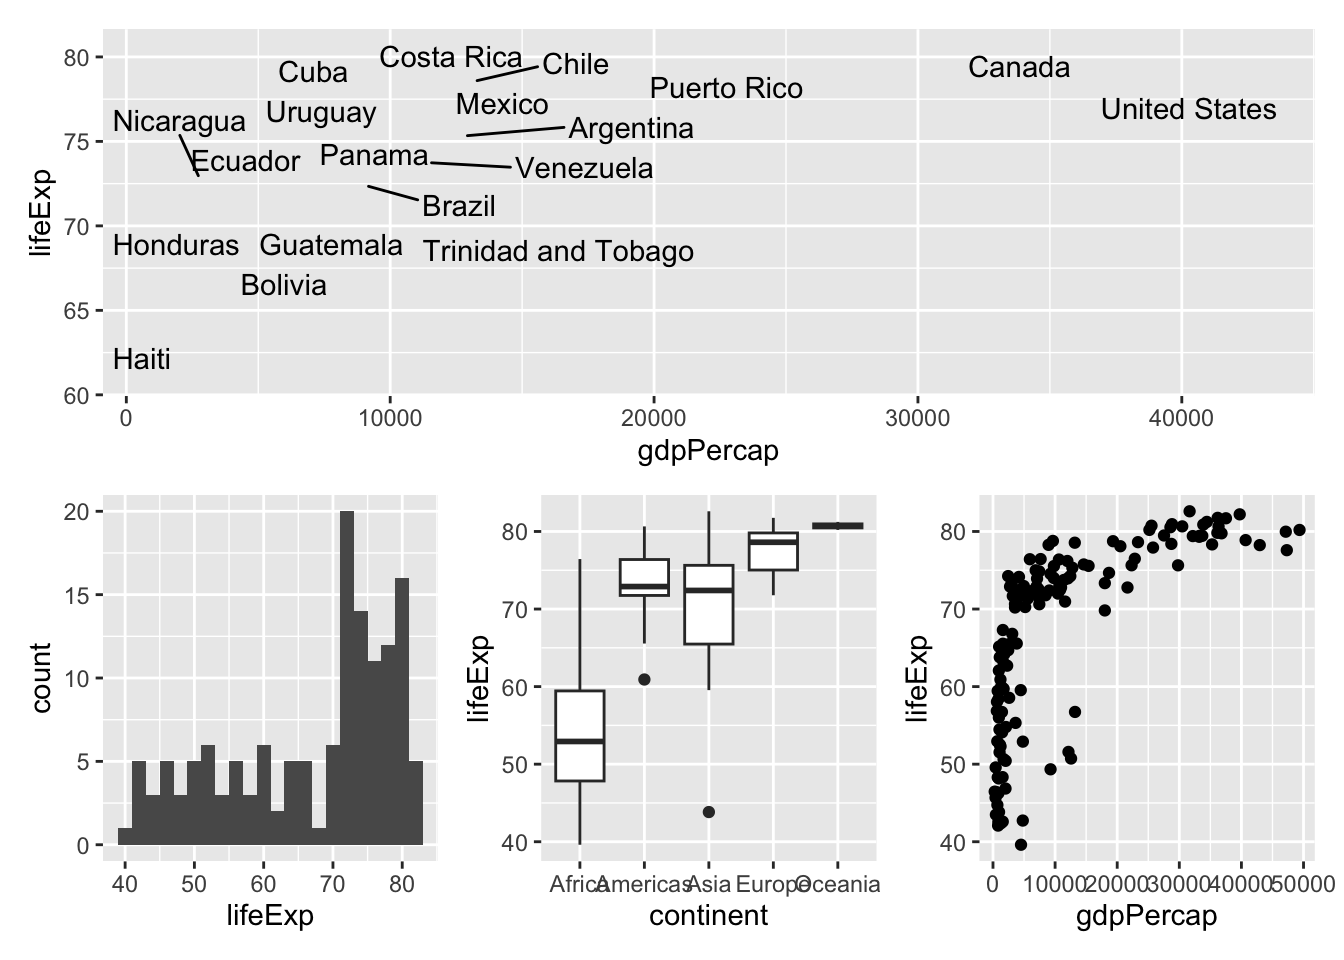
The overall figure can be modified using plot_*() functions. For example,
p_text + p_hist + p_box + p_scatter +
  plot_annotation(title = "Gapminder", tag_levels = c("A"))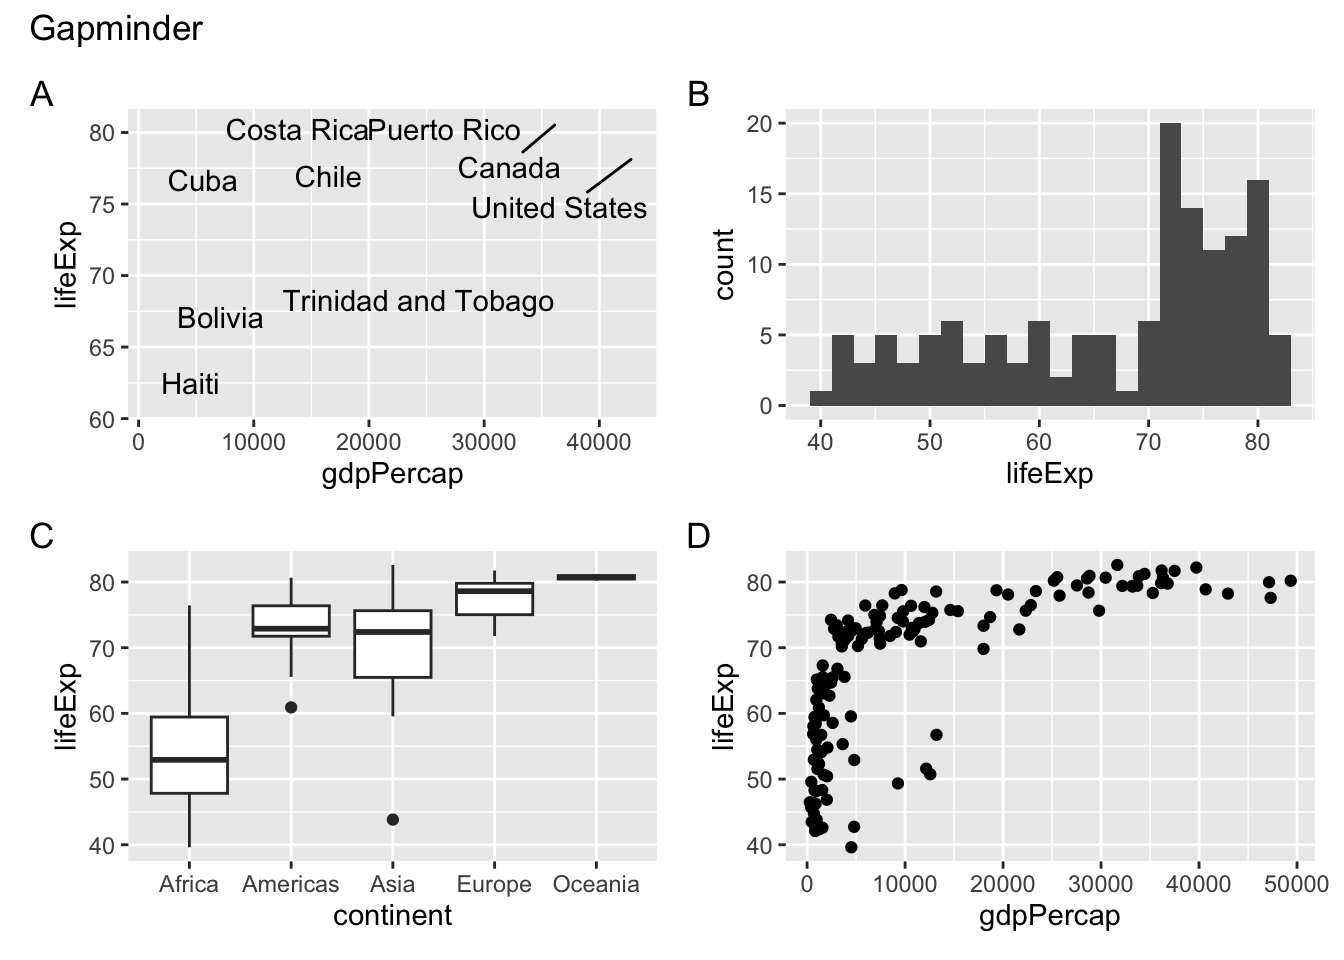
p_text +
  {
    p_hist + {
      p_box + p_scatter + plot_layout(ncol = 1) + plot_layout(tag_level = "new")
    }
  } +
  plot_layout(ncol = 1) +
  plot_annotation(tag_levels = c("1", "a"), tag_prefix = "Fig ")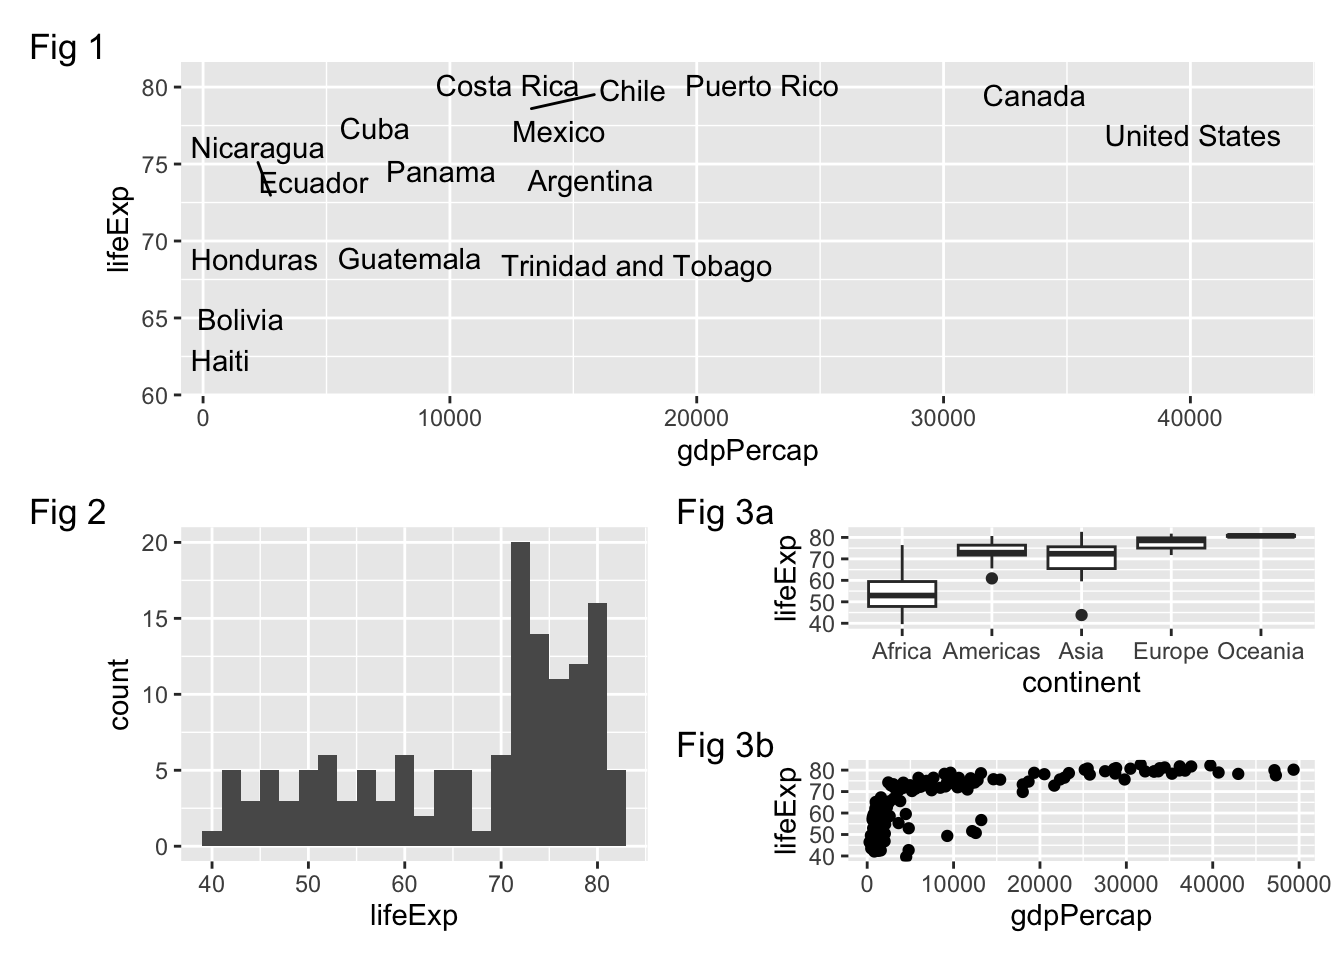
The {patchwork} documentation includes more detailed vignettes on how to leverage the package for complex layouts.
Acknowledgments
- Examples adapted from from STA 313: Advanced Data Visualization
sessioninfo::session_info()─ Session info ───────────────────────────────────────────────────────────────
setting value
version R version 4.4.2 (2024-10-31)
os macOS Sonoma 14.6.1
system aarch64, darwin20
ui X11
language (EN)
collate en_US.UTF-8
ctype en_US.UTF-8
tz America/New_York
date 2025-03-03
pandoc 3.4 @ /usr/local/bin/ (via rmarkdown)
─ Packages ───────────────────────────────────────────────────────────────────
package * version date (UTC) lib source
cli 3.6.3 2024-06-21 [1] CRAN (R 4.4.0)
dichromat 2.0-0.1 2022-05-02 [1] CRAN (R 4.3.0)
digest 0.6.37 2024-08-19 [1] CRAN (R 4.4.1)
dplyr * 1.1.4 2023-11-17 [1] CRAN (R 4.3.1)
evaluate 1.0.3 2025-01-10 [1] CRAN (R 4.4.1)
farver 2.1.2 2024-05-13 [1] CRAN (R 4.3.3)
fastmap 1.2.0 2024-05-15 [1] CRAN (R 4.4.0)
forcats * 1.0.0 2023-01-29 [1] CRAN (R 4.3.0)
gapminder * 1.0.0 2023-03-10 [1] CRAN (R 4.3.0)
generics 0.1.3 2022-07-05 [1] CRAN (R 4.3.0)
ggplot2 * 3.5.1 2024-04-23 [1] CRAN (R 4.3.1)
ggrepel * 0.9.5 2024-01-10 [1] CRAN (R 4.3.1)
glue 1.8.0 2024-09-30 [1] CRAN (R 4.4.1)
gtable 0.3.6 2024-10-25 [1] CRAN (R 4.4.1)
here 1.0.1 2020-12-13 [1] CRAN (R 4.3.0)
hms 1.1.3 2023-03-21 [1] CRAN (R 4.3.0)
htmltools 0.5.8.1 2024-04-04 [1] CRAN (R 4.3.1)
htmlwidgets 1.6.4 2023-12-06 [1] CRAN (R 4.3.1)
jsonlite 1.8.9 2024-09-20 [1] CRAN (R 4.4.1)
knitr 1.49 2024-11-08 [1] CRAN (R 4.4.1)
labeling 0.4.3 2023-08-29 [1] CRAN (R 4.3.0)
lifecycle 1.0.4 2023-11-07 [1] CRAN (R 4.3.1)
lubridate * 1.9.3 2023-09-27 [1] CRAN (R 4.3.1)
magrittr 2.0.3 2022-03-30 [1] CRAN (R 4.3.0)
patchwork * 1.2.0 2024-01-08 [1] CRAN (R 4.3.1)
pillar 1.10.1 2025-01-07 [1] CRAN (R 4.4.1)
pkgconfig 2.0.3 2019-09-22 [1] CRAN (R 4.3.0)
purrr * 1.0.2 2023-08-10 [1] CRAN (R 4.3.0)
R6 2.5.1 2021-08-19 [1] CRAN (R 4.3.0)
RColorBrewer 1.1-3 2022-04-03 [1] CRAN (R 4.3.0)
Rcpp 1.0.14 2025-01-12 [1] CRAN (R 4.4.1)
readr * 2.1.5 2024-01-10 [1] CRAN (R 4.3.1)
rlang 1.1.5 2025-01-17 [1] CRAN (R 4.4.1)
rmarkdown 2.29 2024-11-04 [1] CRAN (R 4.4.1)
rprojroot 2.0.4 2023-11-05 [1] CRAN (R 4.3.1)
rstudioapi 0.17.0 2024-10-16 [1] CRAN (R 4.4.1)
scales 1.3.0.9000 2024-11-14 [1] Github (r-lib/scales@ee03582)
sessioninfo 1.2.2 2021-12-06 [1] CRAN (R 4.3.0)
stringi 1.8.4 2024-05-06 [1] CRAN (R 4.3.1)
stringr * 1.5.1 2023-11-14 [1] CRAN (R 4.3.1)
tibble * 3.2.1 2023-03-20 [1] CRAN (R 4.3.0)
tidyr * 1.3.1 2024-01-24 [1] CRAN (R 4.3.1)
tidyselect 1.2.1 2024-03-11 [1] CRAN (R 4.3.1)
tidyverse * 2.0.0 2023-02-22 [1] CRAN (R 4.3.0)
timechange 0.3.0 2024-01-18 [1] CRAN (R 4.3.1)
tzdb 0.4.0 2023-05-12 [1] CRAN (R 4.3.0)
vctrs 0.6.5 2023-12-01 [1] CRAN (R 4.3.1)
withr 3.0.2 2024-10-28 [1] CRAN (R 4.4.1)
xfun 0.50.5 2025-01-15 [1] https://yihui.r-universe.dev (R 4.4.2)
yaml 2.3.10 2024-07-26 [1] CRAN (R 4.4.0)
[1] /Library/Frameworks/R.framework/Versions/4.4-arm64/Resources/library
──────────────────────────────────────────────────────────────────────────────