library(tidyverse)
library(scales)
library(janitor)
library(colorspace)

aqi_levels <- tribble(
  ~aqi_min, ~aqi_max, ~color,    ~level,
  0,        50,       "#D8EEDA", "Good",
  51,       100,      "#F1E7D4", "Moderate",
  101,      150,      "#F8E4D8", "Unhealthy for sensitive groups",
  151,      200,      "#FEE2E1", "Unhealthy",
  201,      300,      "#F4E3F7", "Very unhealthy",
  301,      400,      "#F9D0D4", "Hazardous"
)AE: Air quality index in Syracuse, NY
Suggested answers
Application exercise
Answers
Packages
Import and clean Syracuse 2023 data
syr_2023 <- read_csv(file = "data/aqi-syracuse/ad_aqi_tracker_data-2023.csv")Rows: 365 Columns: 11
── Column specification ────────────────────────────────────────────────────────
Delimiter: ","
chr (7): Date, Main Pollutant, Site Name, Site ID, Source, Date of 20-year H...
dbl (4): AQI Value, 20-year High (2000-2019), 20-year Low (2000-2019), 5-yea...
ℹ Use `spec()` to retrieve the full column specification for this data.
ℹ Specify the column types or set `show_col_types = FALSE` to quiet this message.syr_2023 <- syr_2023 |>
clean_names() |>
mutate(date = mdy(date))
syr_2023# A tibble: 365 × 11
date aqi_value main_pollutant site_name site_id source
<date> <dbl> <chr> <chr> <chr> <chr>
1 2023-01-01 38 PM2.5 EAST SYRACUSE 36-067-1015 AQS
2 2023-01-02 48 PM2.5 EAST SYRACUSE 36-067-1015 AQS
3 2023-01-03 49 PM2.5 EAST SYRACUSE 36-067-1015 AQS
4 2023-01-04 22 PM2.5 EAST SYRACUSE 36-067-1015 AQS
5 2023-01-05 33 PM2.5 EAST SYRACUSE 36-067-1015 AQS
6 2023-01-06 33 PM2.5 EAST SYRACUSE 36-067-1015 AQS
7 2023-01-07 30 PM2.5 EAST SYRACUSE 36-067-1015 AQS
8 2023-01-08 28 PM2.5 EAST SYRACUSE 36-067-1015 AQS
9 2023-01-09 50 PM2.5 EAST SYRACUSE 36-067-1015 AQS
10 2023-01-10 28 Ozone FULTON 36-075-0003 AQS
# ℹ 355 more rows
# ℹ 5 more variables: x20_year_high_2000_2019 <dbl>,
# x20_year_low_2000_2019 <dbl>, x5_year_average_2015_2019 <dbl>,
# date_of_20_year_high <chr>, date_of_20_year_low <chr>Recreate the plot
Basic line chart
Demo: Draw a simple line chart of the AQI in Syracuse for 2023.
# draw the graph
syr_2023 |>
  ggplot(aes(x = date, y = aqi_value, group = 1)) +
  # plot the AQI in Syracuse
  geom_line(linewidth = 1, alpha = 0.5)
Add color shading
Your turn: Add color shading to the plot based on the AQI guide. The color palette does not need to match the specific colors in the table yet.
Tip
You can use geom_rect() to draw rectangles on a plot. Remember the layered grammar of graphics and arrange the geom_*() in an appropriate order.
# draw the graph
syr_2023 |>
  ggplot(aes(x = date, y = aqi_value, group = 1)) +
  # shade in background with colors based on AQI guide
  geom_rect(
    data = aqi_levels,
    aes(
      ymin = aqi_min, ymax = aqi_max,
      xmin = as.Date(-Inf), xmax = as.Date(Inf),
      x = NULL, y = NULL, fill = color
    )
  ) +
  # plot the AQI in Syracuse
  geom_line(linewidth = 1, alpha = 0.5)
Use scale_fill_identity()
Your turn: Use the hexidecimal colors from the dataset for the color palette.
# draw the graph
syr_2023 |>
  ggplot(aes(x = date, y = aqi_value, group = 1)) +
  # shade in background with colors based on AQI guide
  geom_rect(
    data = aqi_levels,
    aes(
      ymin = aqi_min, ymax = aqi_max,
      xmin = as.Date(-Inf), xmax = as.Date(Inf),
      x = NULL, y = NULL, fill = color
    )
  ) +
  # use the hexidecimal colors from the dataset for the palette
  scale_fill_identity() +
  # plot the AQI in Syracuse
  geom_line(linewidth = 1, alpha = 0.5)
Label each AQI category on the chart
Your turn: Incorporate text labels for each AQI value directly into the graph. To accomplish this, you need to”
- Calculate the midpoint AQI value for each category
- Add a
geom_text()layer to the plot with the AQI values positioned at the midpoint on the \(y\)-axis
Tip
Extend the range of the \(x\)-axis to provide more horizontal space for the AQI category labels without interfering with the trend line.
aqi_levels <- aqi_levels |>
  mutate(aqi_mid = ((aqi_min + aqi_max) / 2))

# draw the graph
syr_2023 |>
  ggplot(aes(x = date, y = aqi_value, group = 1)) +
  # shade in background with colors based on AQI guide
  geom_rect(
    data = aqi_levels,
    aes(
      ymin = aqi_min, ymax = aqi_max,
      xmin = as.Date(-Inf), xmax = as.Date(Inf),
      x = NULL, y = NULL, fill = color
    )
  ) +
  # use the hexidecimal colors from the dataset for the palette
  scale_fill_identity() +
  # format the x-axis for dates
  scale_x_date(
    name = NULL, date_labels = "%b %Y",
    limits = c(ymd("2023-01-01"), ymd("2024-03-01"))
  ) +
  # add text labels for each AQI category
  geom_text(
    data = aqi_levels,
    aes(x = ymd("2024-02-28"), y = aqi_mid, label = level),
    hjust = 1, size = 6, fontface = "bold", color = "white",
    family = "Atkinson Hyperlegible"
  ) +
  # plot the AQI in Syracuse
  geom_line(linewidth = 1, alpha = 0.5)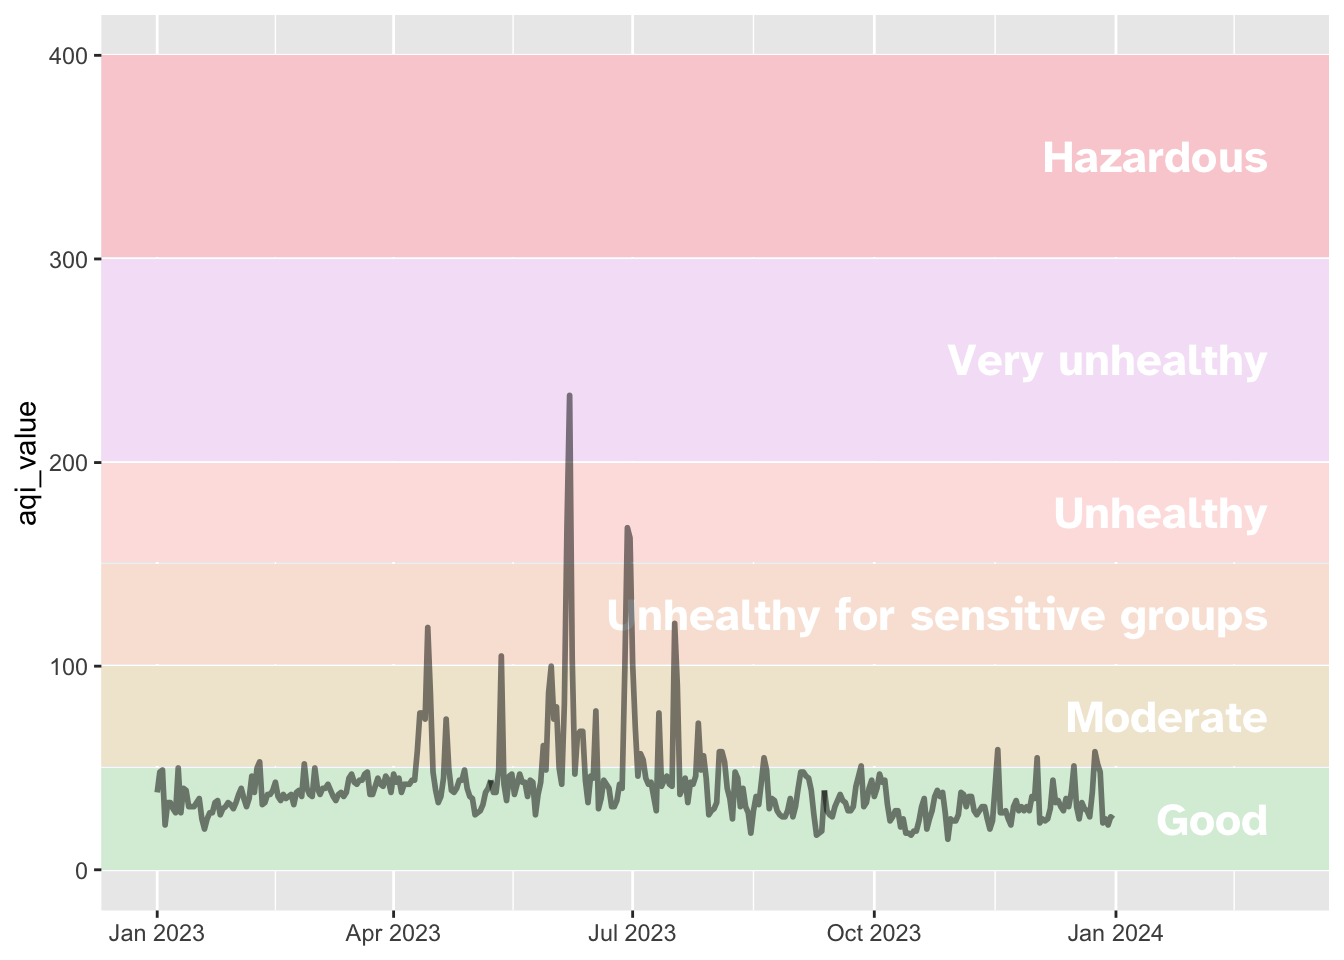
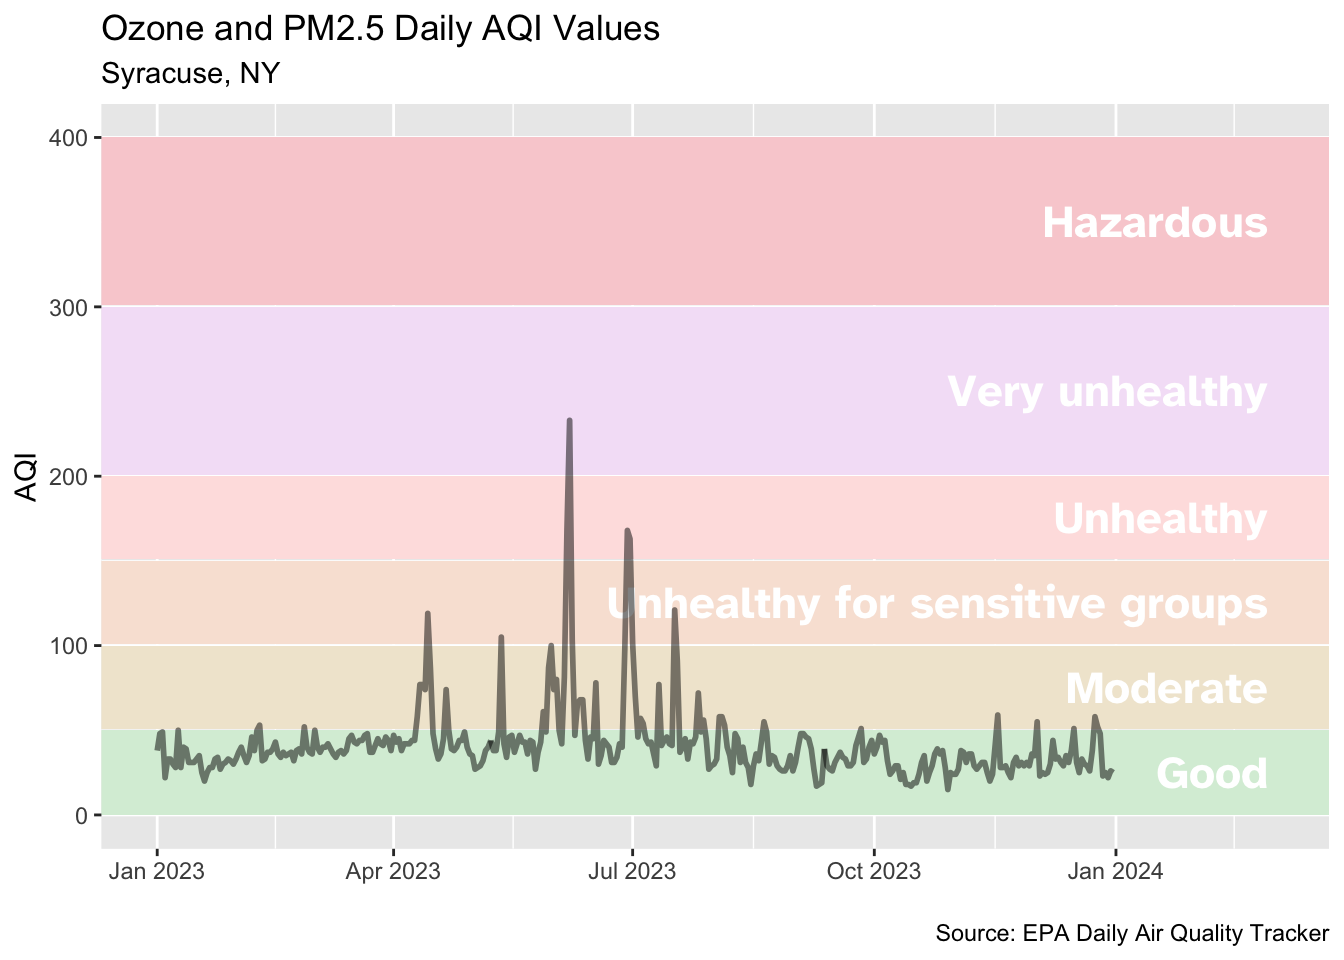
Add labels
Demo: Add a meaningful title, axis labels, caption, etc.
# draw the graph
syr_2023 |>
  ggplot(aes(x = date, y = aqi_value, group = 1)) +
  # shade in background with colors based on AQI guide
  geom_rect(
    data = aqi_levels,
    aes(
      ymin = aqi_min, ymax = aqi_max,
      xmin = as.Date(-Inf), xmax = as.Date(Inf),
      x = NULL, y = NULL, fill = color
    )
  ) +
  # use the hexidecimal colors from the dataset for the palette
  scale_fill_identity() +
  # format the x-axis for dates
  scale_x_date(
    name = NULL, date_labels = "%b %Y",
    limits = c(ymd("2023-01-01"), ymd("2024-03-01"))
  ) +
  # add text labels for each AQI category
  geom_text(
    data = aqi_levels,
    aes(x = ymd("2024-02-28"), y = aqi_mid, label = level),
    hjust = 1, size = 6, fontface = "bold", color = "white",
    family = "Atkinson Hyperlegible"
  ) +
  # plot the AQI in Syracuse
  geom_line(linewidth = 1, alpha = 0.5) +
  # human-readable labels
  labs(
    x = NULL, y = "AQI",
    title = "Ozone and PM2.5 Daily AQI Values",
    subtitle = "Syracuse, NY",
    caption = "\nSource: EPA Daily Air Quality Tracker"
  )
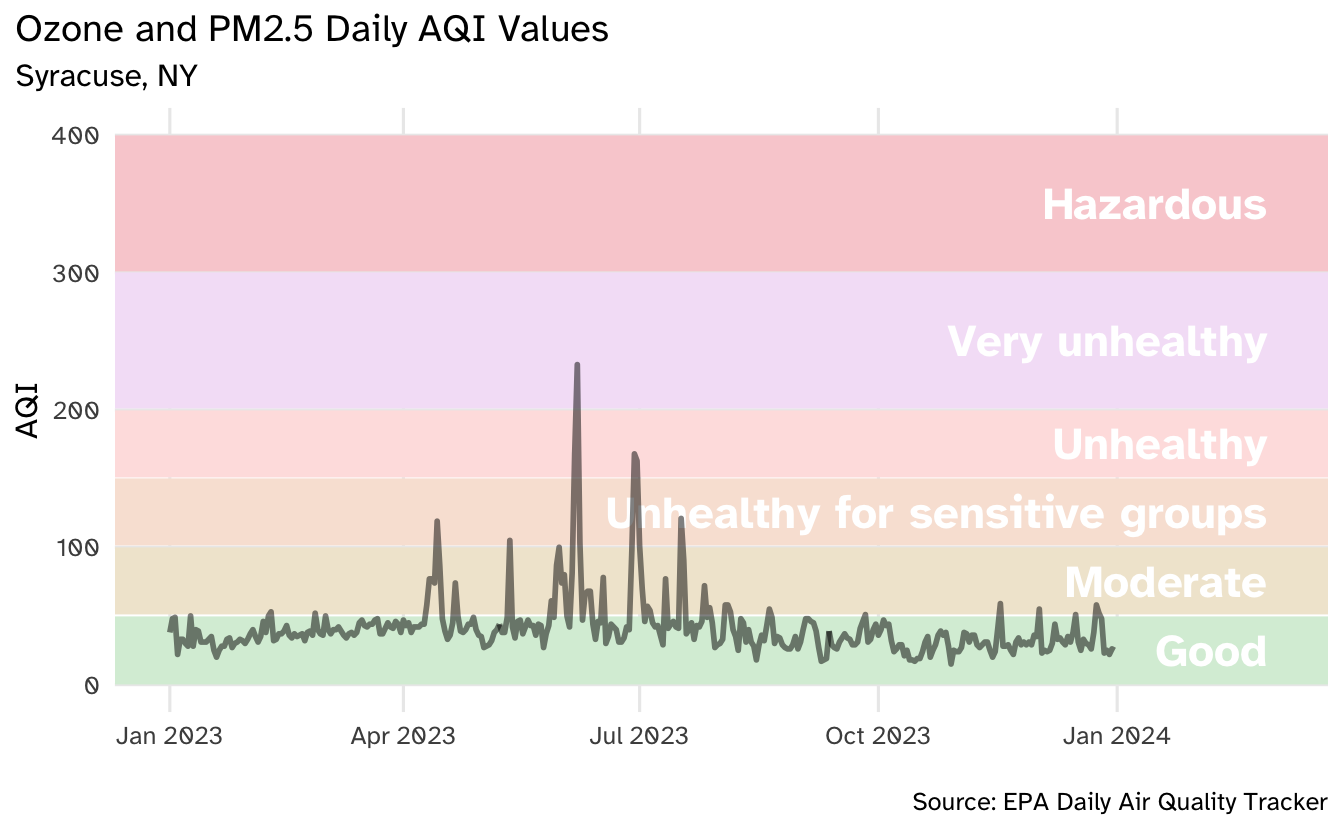
Adjust plot theme components and use theme_minimal()
Your turn: Use theme_minimal() and get rid of the minor grid lines.
# draw the graph
syr_2023 |>
  ggplot(aes(x = date, y = aqi_value, group = 1)) +
  # shade in background with colors based on AQI guide
  geom_rect(
    data = aqi_levels,
    aes(
      ymin = aqi_min, ymax = aqi_max,
      xmin = as.Date(-Inf), xmax = as.Date(Inf),
      x = NULL, y = NULL, fill = color
    )
  ) +
  # use the hexidecimal colors from the dataset for the palette
  scale_fill_identity() +
  # format the x-axis for dates
  scale_x_date(
    name = NULL, date_labels = "%b %Y",
    limits = c(ymd("2023-01-01"), ymd("2024-03-01"))
  ) +
  # add text labels for each AQI category
  geom_text(
    data = aqi_levels,
    aes(x = ymd("2024-02-28"), y = aqi_mid, label = level),
    hjust = 1, size = 6, fontface = "bold", color = "white",
    family = "Atkinson Hyperlegible"
  ) +
  # plot the AQI in Syracuse
  geom_line(linewidth = 1, alpha = 0.5) +
  # human-readable labels
  labs(
    x = NULL, y = "AQI",
    title = "Ozone and PM2.5 Daily AQI Values",
    subtitle = "Syracuse, NY",
    caption = "\nSource: EPA Daily Air Quality Tracker"
  ) +
  # don't like the default theme
  theme_minimal(base_size = 12, base_family = "Atkinson Hyperlegible") +
  theme(
    plot.title.position = "plot",
    panel.grid.minor.y = element_blank(),
    panel.grid.minor.x = element_blank()
  )
Use fit-asp to ensure rendering is correct
Your turn: Render the plot with an aspect ratio of \(0.618\).
```{r}
#| label: plot-final
#| fig-asp: 0.618
aqi_levels <- aqi_levels |>
  mutate(aqi_mid = ((aqi_min + aqi_max) / 2))

# draw the graph
syr_2023 |>
  ggplot(aes(x = date, y = aqi_value, group = 1)) +
  # shade in background with colors based on AQI guide
  geom_rect(
    data = aqi_levels,
    aes(
      ymin = aqi_min, ymax = aqi_max,
      xmin = as.Date(-Inf), xmax = as.Date(Inf),
      x = NULL, y = NULL, fill = color
    )
  ) +
  # use the hexidecimal colors from the dataset for the palette
  scale_fill_identity() +
  # format the x-axis for dates
  scale_x_date(
    name = NULL, date_labels = "%b %Y",
    limits = c(ymd("2023-01-01"), ymd("2024-03-01"))
  ) +
  # add text labels for each AQI category
  geom_text(
    data = aqi_levels,
    aes(x = ymd("2024-02-28"), y = aqi_mid, label = level),
    hjust = 1, size = 6, fontface = "bold", color = "white",
    family = "Atkinson Hyperlegible"
  ) +
  # plot the AQI in Syracuse
  geom_line(linewidth = 1, alpha = 0.5) +
  # human-readable labels
  labs(
    x = NULL, y = "AQI",
    title = "Ozone and PM2.5 Daily AQI Values",
    subtitle = "Syracuse, NY",
    caption = "\nSource: EPA Daily Air Quality Tracker"
  ) +
  # don't like the default theme
  theme_minimal(base_size = 12, base_family = "Atkinson Hyperlegible") +
  theme(
    plot.title.position = "plot",
    panel.grid.minor.y = element_blank(),
    panel.grid.minor.x = element_blank()
  )
```
Session information
sessioninfo::session_info()─ Session info ───────────────────────────────────────────────────────────────
setting value
version R version 4.3.2 (2023-10-31)
os macOS Ventura 13.5.2
system aarch64, darwin20
ui X11
language (EN)
collate en_US.UTF-8
ctype en_US.UTF-8
tz America/New_York
date 2024-03-21
pandoc 3.1.1 @ /Applications/RStudio.app/Contents/Resources/app/quarto/bin/tools/ (via rmarkdown)
─ Packages ───────────────────────────────────────────────────────────────────
package * version date (UTC) lib source
bit 4.0.5 2022-11-15 [1] CRAN (R 4.3.0)
bit64 4.0.5 2020-08-30 [1] CRAN (R 4.3.0)
cli 3.6.2 2023-12-11 [1] CRAN (R 4.3.1)
colorspace * 2.1-0 2023-01-23 [1] CRAN (R 4.3.0)
crayon 1.5.2 2022-09-29 [1] CRAN (R 4.3.0)
digest 0.6.34 2024-01-11 [1] CRAN (R 4.3.1)
dplyr * 1.1.4 2023-11-17 [1] CRAN (R 4.3.1)
evaluate 0.23 2023-11-01 [1] CRAN (R 4.3.1)
fansi 1.0.6 2023-12-08 [1] CRAN (R 4.3.1)
farver 2.1.1 2022-07-06 [1] CRAN (R 4.3.0)
fastmap 1.1.1 2023-02-24 [1] CRAN (R 4.3.0)
forcats * 1.0.0 2023-01-29 [1] CRAN (R 4.3.0)
generics 0.1.3 2022-07-05 [1] CRAN (R 4.3.0)
ggplot2 * 3.4.4 2023-10-12 [1] CRAN (R 4.3.1)
glue 1.7.0 2024-01-09 [1] CRAN (R 4.3.1)
gtable 0.3.4 2023-08-21 [1] CRAN (R 4.3.0)
here 1.0.1 2020-12-13 [1] CRAN (R 4.3.0)
hms 1.1.3 2023-03-21 [1] CRAN (R 4.3.0)
htmltools 0.5.7 2023-11-03 [1] CRAN (R 4.3.1)
htmlwidgets 1.6.4 2023-12-06 [1] CRAN (R 4.3.1)
janitor * 2.2.0 2023-02-02 [1] CRAN (R 4.3.0)
jsonlite 1.8.8 2023-12-04 [1] CRAN (R 4.3.1)
knitr 1.45 2023-10-30 [1] CRAN (R 4.3.1)
labeling 0.4.3 2023-08-29 [1] CRAN (R 4.3.0)
lifecycle 1.0.4 2023-11-07 [1] CRAN (R 4.3.1)
lubridate * 1.9.3 2023-09-27 [1] CRAN (R 4.3.1)
magrittr 2.0.3 2022-03-30 [1] CRAN (R 4.3.0)
munsell 0.5.0 2018-06-12 [1] CRAN (R 4.3.0)
pillar 1.9.0 2023-03-22 [1] CRAN (R 4.3.0)
pkgconfig 2.0.3 2019-09-22 [1] CRAN (R 4.3.0)
purrr * 1.0.2 2023-08-10 [1] CRAN (R 4.3.0)
R6 2.5.1 2021-08-19 [1] CRAN (R 4.3.0)
readr * 2.1.5 2024-01-10 [1] CRAN (R 4.3.1)
rlang 1.1.3 2024-01-10 [1] CRAN (R 4.3.1)
rmarkdown 2.25 2023-09-18 [1] CRAN (R 4.3.1)
rprojroot 2.0.4 2023-11-05 [1] CRAN (R 4.3.1)
rstudioapi 0.15.0 2023-07-07 [1] CRAN (R 4.3.0)
scales * 1.2.1 2024-01-18 [1] Github (r-lib/scales@c8eb772)
sessioninfo 1.2.2 2021-12-06 [1] CRAN (R 4.3.0)
snakecase 0.11.1 2023-08-27 [1] CRAN (R 4.3.0)
stringi 1.8.3 2023-12-11 [1] CRAN (R 4.3.1)
stringr * 1.5.1 2023-11-14 [1] CRAN (R 4.3.1)
tibble * 3.2.1 2023-03-20 [1] CRAN (R 4.3.0)
tidyr * 1.3.0 2023-01-24 [1] CRAN (R 4.3.0)
tidyselect 1.2.0 2022-10-10 [1] CRAN (R 4.3.0)
tidyverse * 2.0.0 2023-02-22 [1] CRAN (R 4.3.0)
timechange 0.2.0 2023-01-11 [1] CRAN (R 4.3.0)
tzdb 0.4.0 2023-05-12 [1] CRAN (R 4.3.0)
utf8 1.2.4 2023-10-22 [1] CRAN (R 4.3.1)
vctrs 0.6.5 2023-12-01 [1] CRAN (R 4.3.1)
vroom 1.6.5 2023-12-05 [1] CRAN (R 4.3.1)
withr 2.5.2 2023-10-30 [1] CRAN (R 4.3.1)
xfun 0.41 2023-11-01 [1] CRAN (R 4.3.1)
yaml 2.3.8 2023-12-11 [1] CRAN (R 4.3.1)
[1] /Library/Frameworks/R.framework/Versions/4.3-arm64/Resources/library
──────────────────────────────────────────────────────────────────────────────