library(tidyverse)
library(sf)
library(colorspace)
library(scales)

# useful on MacOS to speed up rendering of geom_sf() objects
if (!identical(getOption("bitmapType"), "cairo") && isTRUE(capabilities()[["cairo"]])) {
  options(bitmapType = "cairo")
}

# set default theme
theme_set(theme_minimal())

# create reusable labels for each plot
map_labels <- labs(
  title = "Median household income in New York in 2022",
  subtitle = "By census tract",
  color = NULL,
  fill = NULL,
  caption = "Source: American Community Survey"
)Visualizing household income in New York
Suggested answers
Application exercise
Answers
Packages
Load New York 2022 median household income
We will use two data files for this analysis. The first contains median household incomes for each census tract in New York from 2022. The second contains the boundaries of each county in New York.
# load data
ny_inc <- read_rds(file = "data/ny-inc.rds")
ny_counties <- read_rds(file = "data/ny-counties.rds")

ny_inc
Simple feature collection with 5411 features and 4 fields (with 17 geometries empty)
Geometry type: MULTIPOLYGON
Dimension: XY
Bounding box: xmin: -79.76215 ymin: 40.4961 xmax: -71.85621 ymax: 45.01585
Geodetic CRS: NAD83
First 10 features:
GEOID NAME medincomeE
1 36015010800 Census Tract 108; Chemung County; New York 52713
2 36015000100 Census Tract 1; Chemung County; New York 38898
3 36015000300 Census Tract 3; Chemung County; New York NA
4 36055010200 Census Tract 102; Monroe County; New York 128860
5 36055011705 Census Tract 117.05; Monroe County; New York 97292
6 36055013902 Census Tract 139.02; Monroe County; New York 52242
7 36055004702 Census Tract 47.02; Monroe County; New York 43542
8 36055013604 Census Tract 136.04; Monroe County; New York 51081
9 36055006300 Census Tract 63; Monroe County; New York 61150
10 36055006000 Census Tract 60; Monroe County; New York 51341
medincomeM geometry
1 5419 MULTIPOLYGON (((-76.83044 4...
2 6329 MULTIPOLYGON (((-76.82196 4...
3 NA MULTIPOLYGON (((-76.83836 4...
4 19811 MULTIPOLYGON (((-77.61592 4...
5 30981 MULTIPOLYGON (((-77.48616 4...
6 15890 MULTIPOLYGON (((-77.65909 4...
7 5928 MULTIPOLYGON (((-77.61634 4...
8 18842 MULTIPOLYGON (((-77.69645 4...
9 34737 MULTIPOLYGON (((-77.64697 4...
10 9027 MULTIPOLYGON (((-77.56453 4...ny_countiesSimple feature collection with 62 features and 4 fields
Geometry type: MULTIPOLYGON
Dimension: XY
Bounding box: xmin: -79.76215 ymin: 40.4961 xmax: -71.85621 ymax: 45.01585
Geodetic CRS: NAD83
First 10 features:
GEOID NAME medincomeE medincomeM
1 36067 Onondaga County, New York 71479 1125
2 36071 Orange County, New York 91806 1781
3 36017 Chenango County, New York 61741 2526
4 36053 Madison County, New York 68869 2781
5 36077 Otsego County, New York 65778 2967
6 36051 Livingston County, New York 70443 2811
7 36025 Delaware County, New York 58338 2143
8 36061 New York County, New York 99880 1781
9 36065 Oneida County, New York 66402 2173
10 36115 Washington County, New York 68703 2345
geometry
1 MULTIPOLYGON (((-76.49931 4...
2 MULTIPOLYGON (((-74.76247 4...
3 MULTIPOLYGON (((-75.88983 4...
4 MULTIPOLYGON (((-75.99243 4...
5 MULTIPOLYGON (((-75.41693 4...
6 MULTIPOLYGON (((-78.06075 4...
7 MULTIPOLYGON (((-75.42264 4...
8 MULTIPOLYGON (((-74.00641 4...
9 MULTIPOLYGON (((-75.88676 4...
10 MULTIPOLYGON (((-73.63622 4...Draw a continuous choropleth of median household income
Your turn: Create a choropleth map of median household income in New York. Use a continuous color gradient to identify each tract’s median household income. Use a continuous color gradient to identify each tract’s median household income.
Tip
Use the stored map_labels to set the title, subtitle, and caption for this and the remaining plots.
ggplot(data = ny_inc) +
  # use fill and color to avoid gray boundary lines
  geom_sf(aes(fill = medincomeE, color = medincomeE)) +
  # increase interpretability of graph
  scale_color_continuous(labels = label_dollar()) +
  scale_fill_continuous(labels = label_dollar()) +
  map_labels
Your turn: Now revise the map to use the Viridis color palette for improved readability.
ggplot(data = ny_inc) +
  # use fill and color to avoid gray boundary lines
  geom_sf(mapping = aes(fill = medincomeE, color = medincomeE)) +
  # increase interpretability of graph
  scale_fill_continuous_sequential(
    palette = "viridis",
    rev = FALSE,
    aesthetics = c("fill", "color"),
    labels = label_dollar(),
    name = NULL
  ) +
  map_labels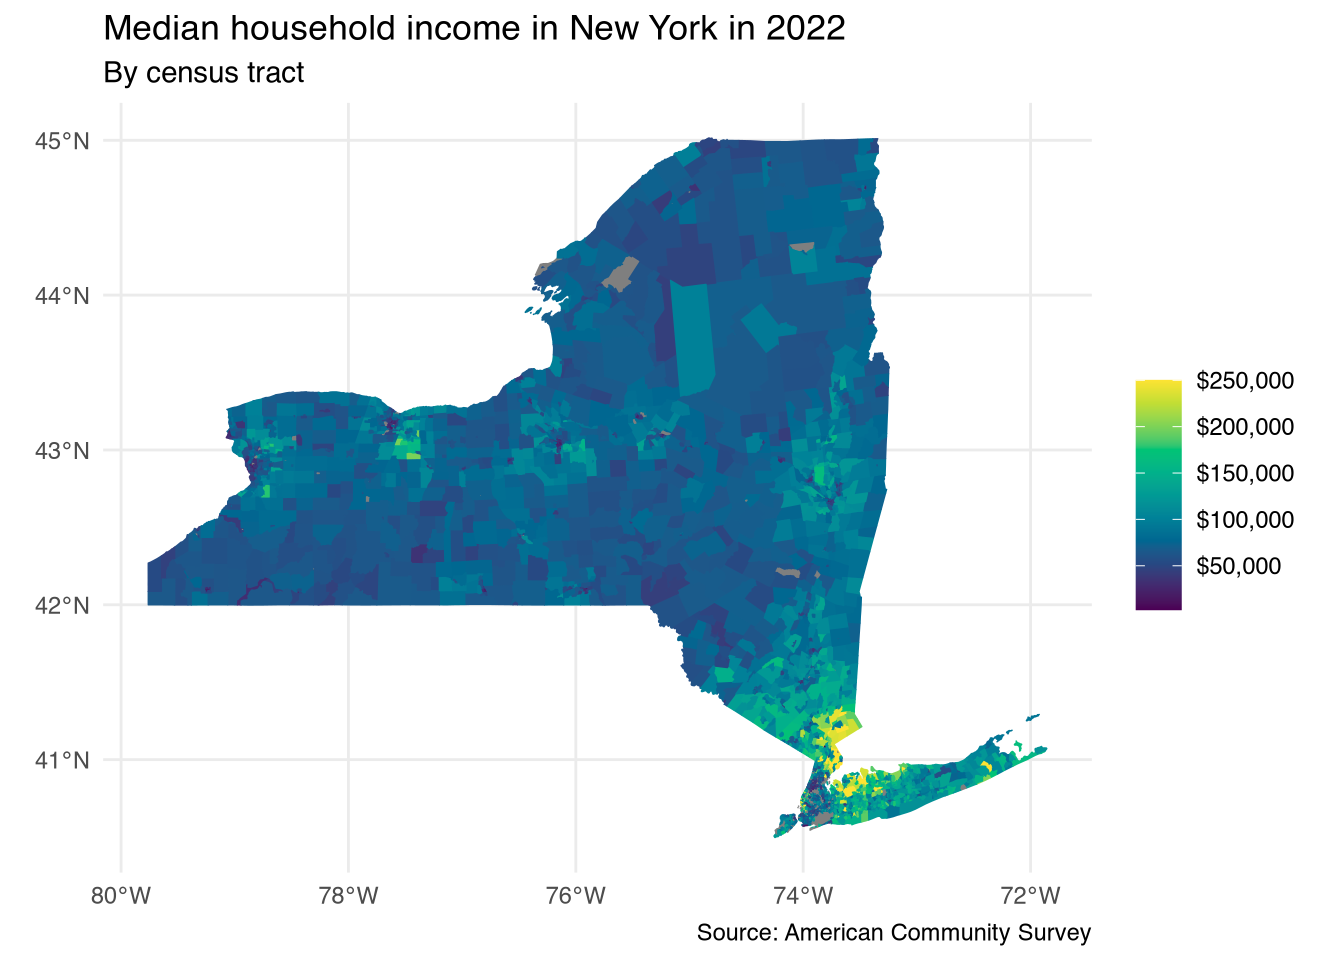
Overlay county borders
Your turn: To provide better context, overlay the NY county borders on the choropleth map.
ggplot(data = ny_inc) +
  # use fill and color to avoid gray boundary lines
  geom_sf(mapping = aes(fill = medincomeE, color = medincomeE)) +
  # add county borders
  geom_sf(data = ny_counties, color = "white", fill = NA) +
  # increase interpretability of graph
  scale_fill_continuous_sequential(
    palette = "viridis",
    rev = FALSE,
    aesthetics = c("fill", "color"),
    labels = label_dollar(),
    name = NULL
  ) +
  map_labels
Convert the map into 6 discrete levels for median household income
Your turn: Continuous color palettes can be hard to distinguish visibly. To improve readability, convert the continuous color palette into a discrete one with 6 levels.
# binned_scale() - default breaks
ggplot(data = ny_inc) +
  geom_sf(mapping = aes(fill = medincomeE)) +
  geom_sf(data = ny_counties, color = "white", fill = NA) +
  scale_fill_binned_sequential(
    palette = "viridis",
    rev = FALSE,
    labels = label_dollar()
  ) +
  # increase interpretability of graph
  map_labels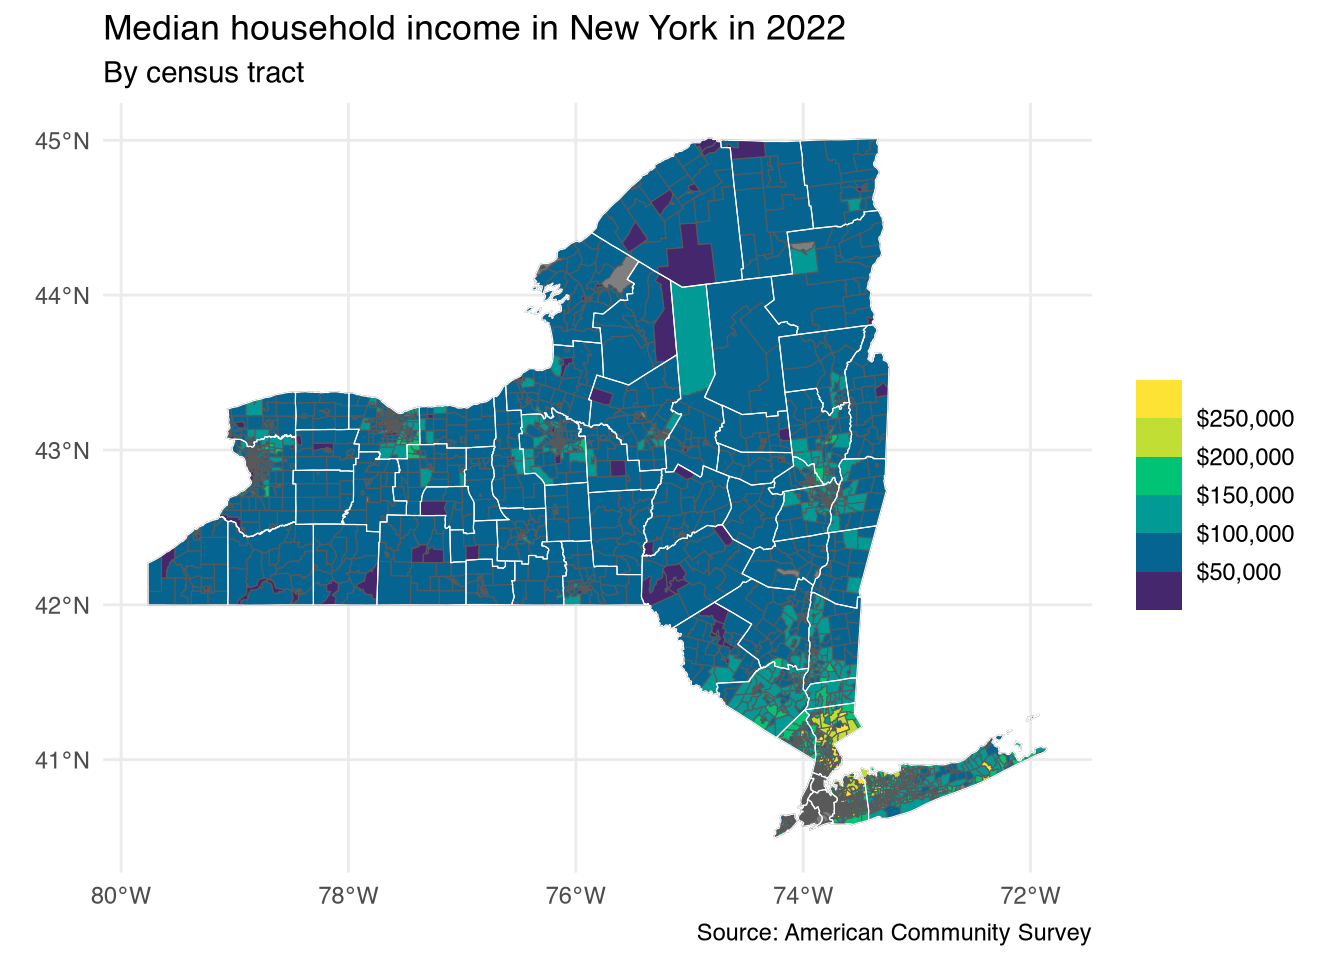
Session information
sessioninfo::session_info()─ Session info ───────────────────────────────────────────────────────────────
setting value
version R version 4.3.2 (2023-10-31)
os macOS Ventura 13.5.2
system aarch64, darwin20
ui X11
language (EN)
collate en_US.UTF-8
ctype en_US.UTF-8
tz America/New_York
date 2024-03-19
pandoc 3.1.1 @ /Applications/RStudio.app/Contents/Resources/app/quarto/bin/tools/ (via rmarkdown)
─ Packages ───────────────────────────────────────────────────────────────────
package * version date (UTC) lib source
class 7.3-22 2023-05-03 [1] CRAN (R 4.3.2)
classInt 0.4-10 2023-09-05 [1] CRAN (R 4.3.0)
cli 3.6.2 2023-12-11 [1] CRAN (R 4.3.1)
colorspace * 2.1-0 2023-01-23 [1] CRAN (R 4.3.0)
DBI 1.2.0 2023-12-21 [1] CRAN (R 4.3.1)
digest 0.6.34 2024-01-11 [1] CRAN (R 4.3.1)
dplyr * 1.1.4 2023-11-17 [1] CRAN (R 4.3.1)
e1071 1.7-14 2023-12-06 [1] CRAN (R 4.3.1)
evaluate 0.23 2023-11-01 [1] CRAN (R 4.3.1)
fansi 1.0.6 2023-12-08 [1] CRAN (R 4.3.1)
farver 2.1.1 2022-07-06 [1] CRAN (R 4.3.0)
fastmap 1.1.1 2023-02-24 [1] CRAN (R 4.3.0)
forcats * 1.0.0 2023-01-29 [1] CRAN (R 4.3.0)
generics 0.1.3 2022-07-05 [1] CRAN (R 4.3.0)
ggplot2 * 3.4.4 2023-10-12 [1] CRAN (R 4.3.1)
glue 1.7.0 2024-01-09 [1] CRAN (R 4.3.1)
gtable 0.3.4 2023-08-21 [1] CRAN (R 4.3.0)
here 1.0.1 2020-12-13 [1] CRAN (R 4.3.0)
hms 1.1.3 2023-03-21 [1] CRAN (R 4.3.0)
htmltools 0.5.7 2023-11-03 [1] CRAN (R 4.3.1)
htmlwidgets 1.6.4 2023-12-06 [1] CRAN (R 4.3.1)
jsonlite 1.8.8 2023-12-04 [1] CRAN (R 4.3.1)
KernSmooth 2.23-22 2023-07-10 [1] CRAN (R 4.3.2)
knitr 1.45 2023-10-30 [1] CRAN (R 4.3.1)
labeling 0.4.3 2023-08-29 [1] CRAN (R 4.3.0)
lifecycle 1.0.4 2023-11-07 [1] CRAN (R 4.3.1)
lubridate * 1.9.3 2023-09-27 [1] CRAN (R 4.3.1)
magrittr 2.0.3 2022-03-30 [1] CRAN (R 4.3.0)
munsell 0.5.0 2018-06-12 [1] CRAN (R 4.3.0)
pillar 1.9.0 2023-03-22 [1] CRAN (R 4.3.0)
pkgconfig 2.0.3 2019-09-22 [1] CRAN (R 4.3.0)
proxy 0.4-27 2022-06-09 [1] CRAN (R 4.3.0)
purrr * 1.0.2 2023-08-10 [1] CRAN (R 4.3.0)
R6 2.5.1 2021-08-19 [1] CRAN (R 4.3.0)
Rcpp 1.0.12 2024-01-09 [1] CRAN (R 4.3.1)
readr * 2.1.5 2024-01-10 [1] CRAN (R 4.3.1)
rlang 1.1.3 2024-01-10 [1] CRAN (R 4.3.1)
rmarkdown 2.25 2023-09-18 [1] CRAN (R 4.3.1)
rprojroot 2.0.4 2023-11-05 [1] CRAN (R 4.3.1)
rstudioapi 0.15.0 2023-07-07 [1] CRAN (R 4.3.0)
scales * 1.2.1 2024-01-18 [1] Github (r-lib/scales@c8eb772)
sessioninfo 1.2.2 2021-12-06 [1] CRAN (R 4.3.0)
sf * 1.0-15 2023-12-18 [1] CRAN (R 4.3.1)
stringi 1.8.3 2023-12-11 [1] CRAN (R 4.3.1)
stringr * 1.5.1 2023-11-14 [1] CRAN (R 4.3.1)
tibble * 3.2.1 2023-03-20 [1] CRAN (R 4.3.0)
tidyr * 1.3.0 2023-01-24 [1] CRAN (R 4.3.0)
tidyselect 1.2.0 2022-10-10 [1] CRAN (R 4.3.0)
tidyverse * 2.0.0 2023-02-22 [1] CRAN (R 4.3.0)
timechange 0.2.0 2023-01-11 [1] CRAN (R 4.3.0)
tzdb 0.4.0 2023-05-12 [1] CRAN (R 4.3.0)
units 0.8-5 2023-11-28 [1] CRAN (R 4.3.1)
utf8 1.2.4 2023-10-22 [1] CRAN (R 4.3.1)
vctrs 0.6.5 2023-12-01 [1] CRAN (R 4.3.1)
withr 2.5.2 2023-10-30 [1] CRAN (R 4.3.1)
xfun 0.41 2023-11-01 [1] CRAN (R 4.3.1)
yaml 2.3.8 2023-12-11 [1] CRAN (R 4.3.1)
[1] /Library/Frameworks/R.framework/Versions/4.3-arm64/Resources/library
──────────────────────────────────────────────────────────────────────────────