library(tidyverse)
library(ggmap)

# set default theme
theme_set(theme_minimal())Drawing maps with ggmap
Suggested answers
Application exercise
Answers
Packages
Load NYC 311 reports
Let’s first load a subset of 311 service requests in New York City.1
# load data
nyc_311 <- read_csv(file = "data/nyc-311.csv")
Rows: 39964 Columns: 6
── Column specification ────────────────────────────────────────────────────────
Delimiter: ","
chr (2): complaint_type, borough
dbl (3): unique_key, latitude, longitude
dttm (1): created_date
ℹ Use `spec()` to retrieve the full column specification for this data.
ℹ Specify the column types or set `show_col_types = FALSE` to quiet this message.glimpse(nyc_311)Rows: 39,964
Columns: 6
$ unique_key <dbl> 45110783, 45174178, 51109245, 45504380, 51297700, 51473…
$ created_date <dttm> 2019-12-07 05:00:00, 2019-12-16 05:00:00, 2021-07-05 0…
$ complaint_type <chr> "Food Poisoning", "Food Poisoning", "Food Poisoning", "…
$ borough <chr> "MANHATTAN", "BROOKLYN", "MANHATTAN", "BRONX", "BROOKLY…
$ latitude <dbl> 40.80788, 40.67821, 40.75941, 40.87517, 40.63832, 40.67…
$ longitude <dbl> -73.94575, -73.97923, -73.96958, -73.87949, -74.03440, …This subset includes 311 service requests related to Food Poisoning in commercial establishments (e.g. restaurants, cafeterias, food carts).
Register a Stadia Maps API Key
Your turn: Store your Stadia Maps API key using the function
register_stadiamaps(key = "YOUR-API-KEY", write = TRUE)replacing "YOUR-API-KEY" with your actual API key. Otherwise you will not be able to obtain map tiles and complete the application exercise.
Obtain map tiles for New York City
Your turn: Use bboxfinder.com to find bounding box coordinates for New York City. Then, use get_stamenmap() to obtain map tiles for New York City and visualize the map.
Note
I recommend a zoom level of 11.
# store bounding box coordinates
nyc_bb <- c(
  left = -74.263045,
  bottom = 40.487652,
  right = -73.675963,
  top = 40.934743
)

nyc <- get_stadiamap(
  bbox = nyc_bb,
  zoom = 11
)
ℹ © Stadia Maps © Stamen Design © OpenMapTiles © OpenStreetMap contributors.# plot the raster map
ggmap(nyc)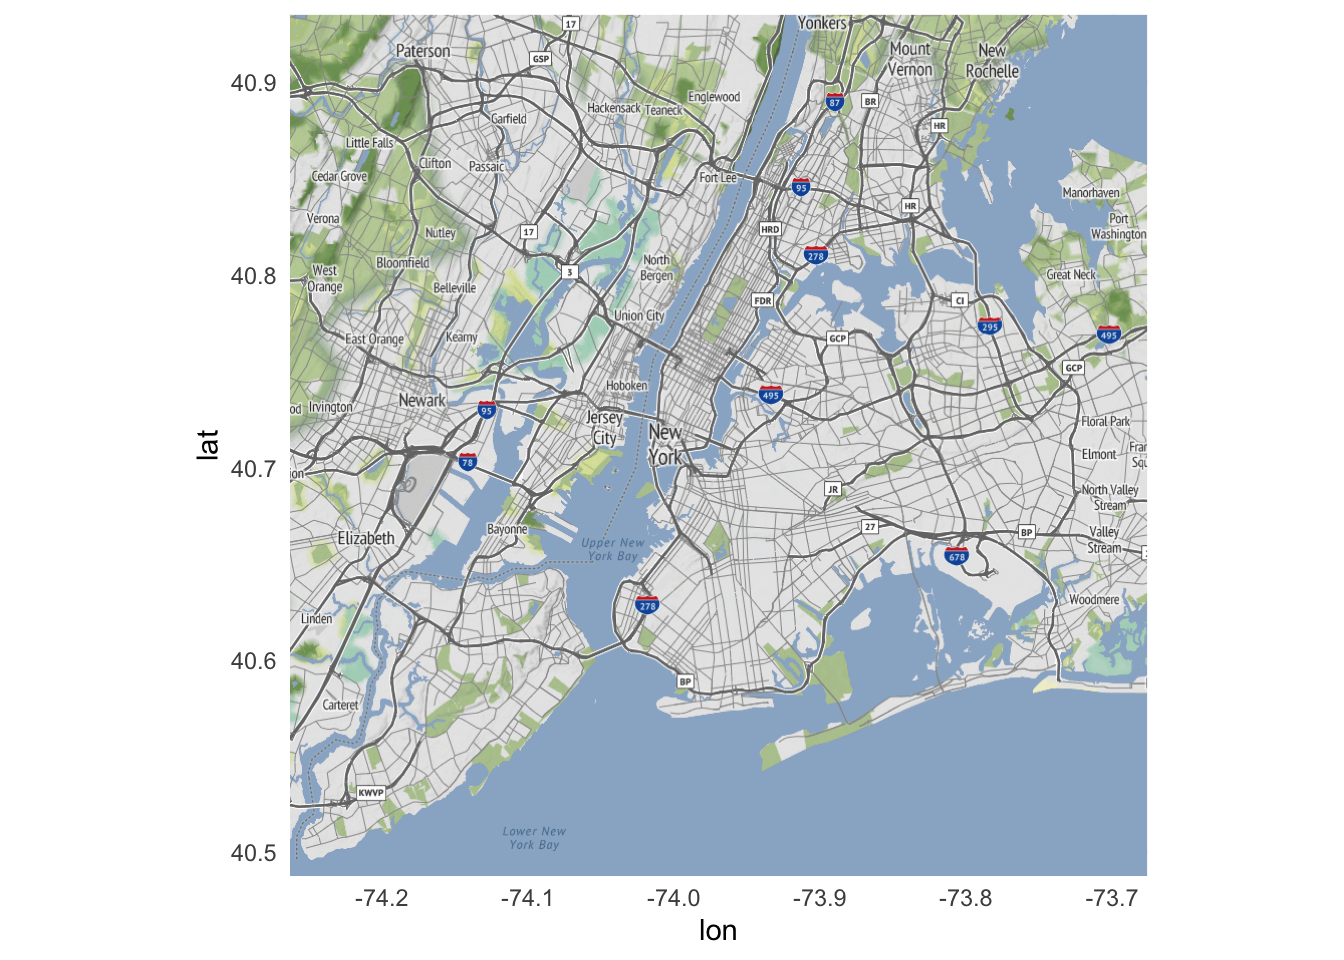
Food poisoning rates

The COVID-19 pandemic caused massive disruption in the restaurant industry. Due to social distancing measures and lockdowns, restaurant traffic decreased significantly.
While this had significant financial ramifications, one potentially overlooked consequence is the impact on food poisoning rates. With fewer people eating out, the number of food poisoning complaints may have decreased.
Your turn: Visualize the geospatial distribution of complaints related to food poisoning in NYC in March, April, and May over a four-year time period (2018-21). Construct the chart in such a way that you can make valid comparisons over time and geographically. What impact did COVID-19 have on food poisoning cases in NYC? Did it vary geographically?
nyc_covid_food_poison <- nyc_311 |>
  # generate a year variable
  mutate(year = year(created_date)) |>
  # only keep reports in March, April, and May from 2018-21
  filter(month(created_date) %in% 3:5, year %in% 2018:2021)

ggmap(nyc) +
  # add the heatmap
  stat_density_2d(
    data = nyc_covid_food_poison,
    mapping = aes(
      x = longitude,
      y = latitude,
      fill = after_stat(level)
    ),
    alpha = .1,
    bins = 50,
    geom = "polygon"
  ) +
  scale_fill_viridis_c() +
  facet_wrap(facets = vars(year))
Warning: Removed 26 rows containing non-finite values (`stat_density2d()`).
Visualize food poisoning complaints on Roosevelt Island
Your turn: Now focus on food poisoning complaints on or around Roosevelt Island.2 Use get_stamenmap() to obtain map tiles for the Roosevelt Island region and overlay with the food poisoning complaints. What type of chart is more effective for this task?
Note
Consider adjusting your zoom for this geographic region.
# Obtain map tiles for Roosevelt Island
roosevelt_bb <- c(
  left = -73.967121,
  bottom = 40.748700,
  right = -73.937080,
  top = 40.774704
)
roosevelt <- get_stadiamap(
  bbox = roosevelt_bb,
  zoom = 14
)
ℹ © Stadia Maps © Stamen Design © OpenMapTiles © OpenStreetMap contributors.# Generate a scatterplot of food poisoning complaints
ggmap(roosevelt) +
# add a scatterplot layer
geom_point(
data = filter(nyc_311, complaint_type == "Food Poisoning"),
mapping = aes(
x = longitude,
y = latitude
),
alpha = 0.2
)Warning: Removed 39000 rows containing missing values (`geom_point()`).
Session information
sessioninfo::session_info()─ Session info ───────────────────────────────────────────────────────────────
setting value
version R version 4.3.2 (2023-10-31)
os macOS Ventura 13.5.2
system aarch64, darwin20
ui X11
language (EN)
collate en_US.UTF-8
ctype en_US.UTF-8
tz America/New_York
date 2024-03-14
pandoc 3.1.1 @ /Applications/RStudio.app/Contents/Resources/app/quarto/bin/tools/ (via rmarkdown)
─ Packages ───────────────────────────────────────────────────────────────────
package * version date (UTC) lib source
bit 4.0.5 2022-11-15 [1] CRAN (R 4.3.0)
bit64 4.0.5 2020-08-30 [1] CRAN (R 4.3.0)
bitops 1.0-7 2021-04-24 [1] CRAN (R 4.3.0)
cli 3.6.2 2023-12-11 [1] CRAN (R 4.3.1)
colorspace 2.1-0 2023-01-23 [1] CRAN (R 4.3.0)
crayon 1.5.2 2022-09-29 [1] CRAN (R 4.3.0)
curl 5.2.0 2023-12-08 [1] CRAN (R 4.3.1)
digest 0.6.34 2024-01-11 [1] CRAN (R 4.3.1)
dplyr * 1.1.4 2023-11-17 [1] CRAN (R 4.3.1)
evaluate 0.23 2023-11-01 [1] CRAN (R 4.3.1)
fansi 1.0.6 2023-12-08 [1] CRAN (R 4.3.1)
farver 2.1.1 2022-07-06 [1] CRAN (R 4.3.0)
fastmap 1.1.1 2023-02-24 [1] CRAN (R 4.3.0)
forcats * 1.0.0 2023-01-29 [1] CRAN (R 4.3.0)
generics 0.1.3 2022-07-05 [1] CRAN (R 4.3.0)
ggmap * 4.0.0 2024-01-09 [1] Github (stadiamaps/ggmap@dbbca88)
ggplot2 * 3.4.4 2023-10-12 [1] CRAN (R 4.3.1)
glue 1.7.0 2024-01-09 [1] CRAN (R 4.3.1)
gtable 0.3.4 2023-08-21 [1] CRAN (R 4.3.0)
here 1.0.1 2020-12-13 [1] CRAN (R 4.3.0)
hms 1.1.3 2023-03-21 [1] CRAN (R 4.3.0)
htmltools 0.5.7 2023-11-03 [1] CRAN (R 4.3.1)
htmlwidgets 1.6.4 2023-12-06 [1] CRAN (R 4.3.1)
httr 1.4.7 2023-08-15 [1] CRAN (R 4.3.0)
isoband 0.2.7 2022-12-20 [1] CRAN (R 4.3.0)
jpeg 0.1-10 2022-11-29 [1] CRAN (R 4.3.0)
jsonlite 1.8.8 2023-12-04 [1] CRAN (R 4.3.1)
knitr 1.45 2023-10-30 [1] CRAN (R 4.3.1)
labeling 0.4.3 2023-08-29 [1] CRAN (R 4.3.0)
lifecycle 1.0.4 2023-11-07 [1] CRAN (R 4.3.1)
lubridate * 1.9.3 2023-09-27 [1] CRAN (R 4.3.1)
magrittr 2.0.3 2022-03-30 [1] CRAN (R 4.3.0)
MASS 7.3-60 2023-05-04 [1] CRAN (R 4.3.2)
munsell 0.5.0 2018-06-12 [1] CRAN (R 4.3.0)
pillar 1.9.0 2023-03-22 [1] CRAN (R 4.3.0)
pkgconfig 2.0.3 2019-09-22 [1] CRAN (R 4.3.0)
plyr 1.8.9 2023-10-02 [1] CRAN (R 4.3.1)
png 0.1-8 2022-11-29 [1] CRAN (R 4.3.0)
purrr * 1.0.2 2023-08-10 [1] CRAN (R 4.3.0)
R6 2.5.1 2021-08-19 [1] CRAN (R 4.3.0)
Rcpp 1.0.12 2024-01-09 [1] CRAN (R 4.3.1)
readr * 2.1.5 2024-01-10 [1] CRAN (R 4.3.1)
rlang 1.1.3 2024-01-10 [1] CRAN (R 4.3.1)
rmarkdown 2.25 2023-09-18 [1] CRAN (R 4.3.1)
rprojroot 2.0.4 2023-11-05 [1] CRAN (R 4.3.1)
rstudioapi 0.15.0 2023-07-07 [1] CRAN (R 4.3.0)
scales 1.2.1 2024-01-18 [1] Github (r-lib/scales@c8eb772)
sessioninfo 1.2.2 2021-12-06 [1] CRAN (R 4.3.0)
stringi 1.8.3 2023-12-11 [1] CRAN (R 4.3.1)
stringr * 1.5.1 2023-11-14 [1] CRAN (R 4.3.1)
tibble * 3.2.1 2023-03-20 [1] CRAN (R 4.3.0)
tidyr * 1.3.0 2023-01-24 [1] CRAN (R 4.3.0)
tidyselect 1.2.0 2022-10-10 [1] CRAN (R 4.3.0)
tidyverse * 2.0.0 2023-02-22 [1] CRAN (R 4.3.0)
timechange 0.2.0 2023-01-11 [1] CRAN (R 4.3.0)
tzdb 0.4.0 2023-05-12 [1] CRAN (R 4.3.0)
utf8 1.2.4 2023-10-22 [1] CRAN (R 4.3.1)
vctrs 0.6.5 2023-12-01 [1] CRAN (R 4.3.1)
viridisLite 0.4.2 2023-05-02 [1] CRAN (R 4.3.0)
vroom 1.6.5 2023-12-05 [1] CRAN (R 4.3.1)
withr 2.5.2 2023-10-30 [1] CRAN (R 4.3.1)
xfun 0.41 2023-11-01 [1] CRAN (R 4.3.1)
yaml 2.3.8 2023-12-11 [1] CRAN (R 4.3.1)
[1] /Library/Frameworks/R.framework/Versions/4.3-arm64/Resources/library
──────────────────────────────────────────────────────────────────────────────Footnotes
These reports were obtained from the NYC Open Data portal API.↩︎
Also the location of Cornell Tech.↩︎