AE 05: Waffle charts for visualizing proportions
Waffle charts
{waffle} provides a {ggplot2} implementation of waffle plots. The typical workflow consists of preparing the data by tabulating in advance and then plotting it with {ggplot2} and geom_waffle().
Basic waffle chart
Demonstration: Prepare the penguins data frame to visualize the number of penguins by species.
# add code hereDemonstration: Use the prepared data to draw a basic color-coded waffle chart
# add code hereImprove the waffle chart
Your turn: Adjust the waffle chart to use a fixed aspect ratio so the symbols are squares. Rotate the chart so the squares are stacked vertically.
# add code hereDemonstration: {waffle} will draw all observations on the chart. For larger datasets, this is problematic. Instead, we might want to visualize the proportion of observations in each category. Use geom_waffle() to represent the data as proportions instead.
# add code hereYour turn: Adjust the waffle chart to use a better color palette and move the legend to the top.
# add code hereCompare to a pie chart
Demonstration: Create a pie chart and a donut chart to visualize the proportions of penguins by species.
# pie chart
penguins |>
  count(species) |>
  ggplot(mapping = aes(x = "", y = n, fill = species)) +
  geom_col(color = "white") +
  coord_radial(theta = "y", expand = FALSE) +
  scale_fill_viridis_d(end = 0.8) +
  labs(
    title = "Penguins by species",
    x = NULL,
    y = NULL,
    fill = NULL
  ) +
  theme_void() +
  theme(legend.position = "top")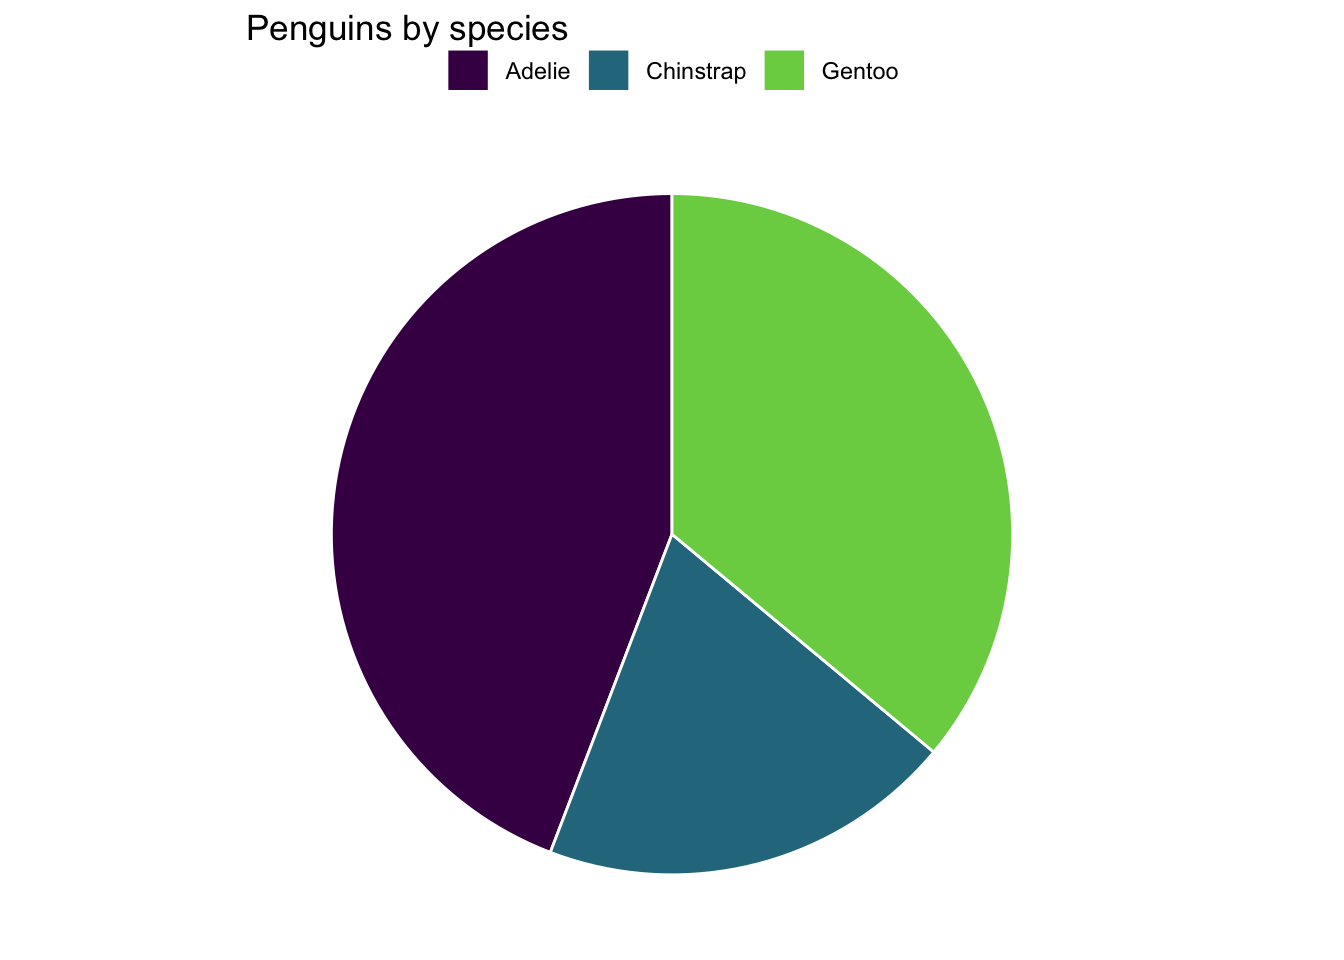
# donut chart
penguins |>
  count(species) |>
  ggplot(mapping = aes(x = 2, y = n, fill = species)) +
  geom_col(color = "white") +
  coord_radial(theta = "y", expand = FALSE) +
  xlim(0.5, 2.5) +
  scale_fill_viridis_d(end = 0.8) +
  labs(
    title = "Penguins by species",
    x = NULL,
    y = NULL,
    fill = NULL
  ) +
  theme_void() +
  theme(legend.position = "top")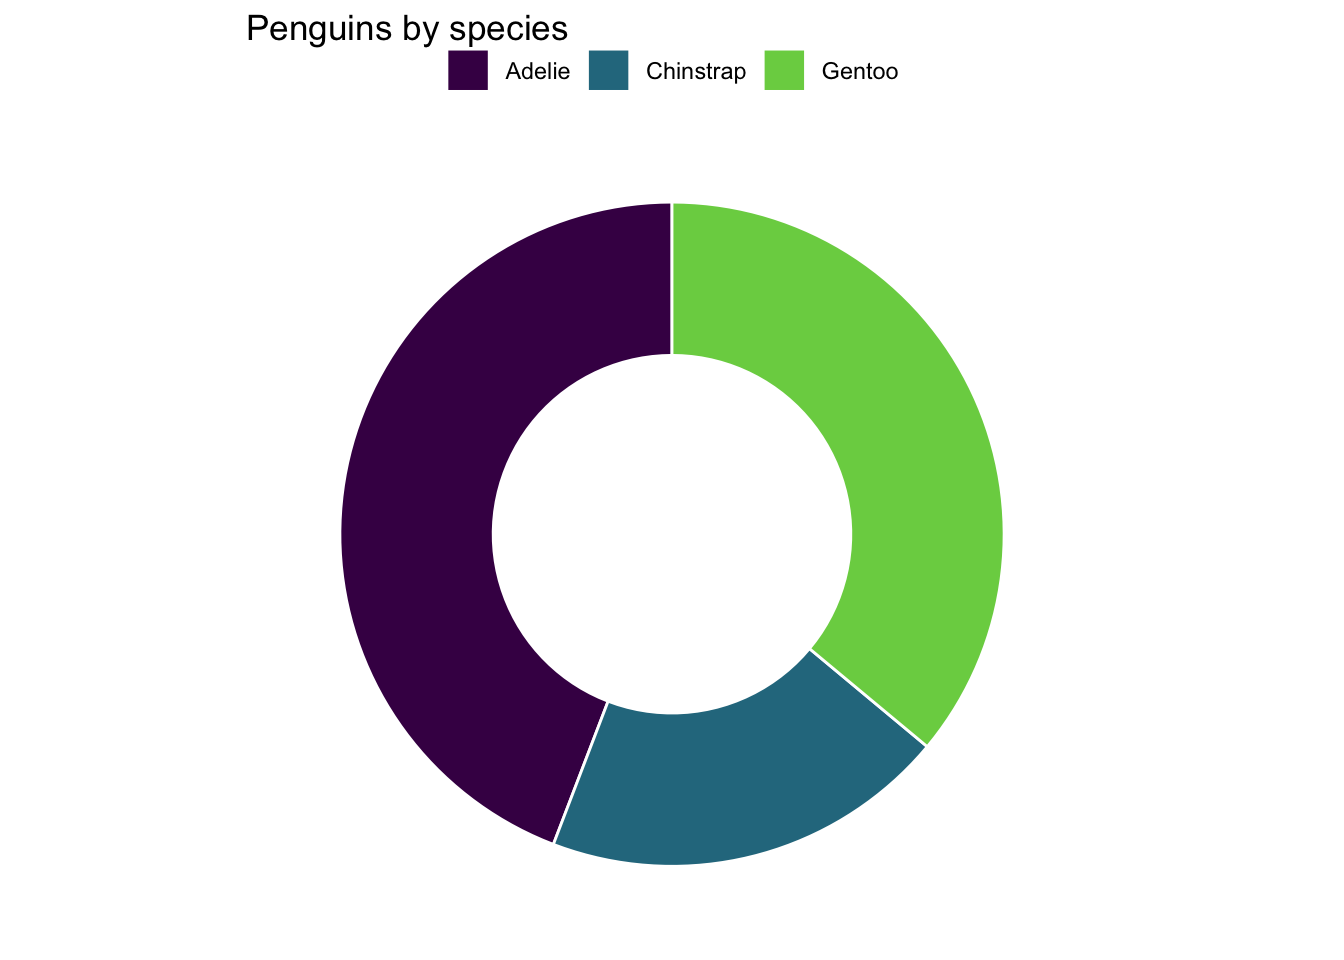
Your turn: Reflect on the differences between waffle charts and pie/donut charts. For this data, which chart type do you find more effective? Why?
Add response here.