AE 05: Waffle charts for visualizing proportions
Suggested answers
These are suggested answers. This document should be used as reference only, it’s not designed to be an exhaustive key.
Waffle charts
{waffle} provides a {ggplot2} implementation of waffle plots. The typical workflow consists of preparing the data by tabulating in advance and then plotting it with {ggplot2} and geom_waffle().
Basic waffle chart
Demonstration: Prepare the penguins data frame to visualize the number of penguins by species.
penguins |>
  count(species)
species n
1 Adelie 152
2 Chinstrap 68
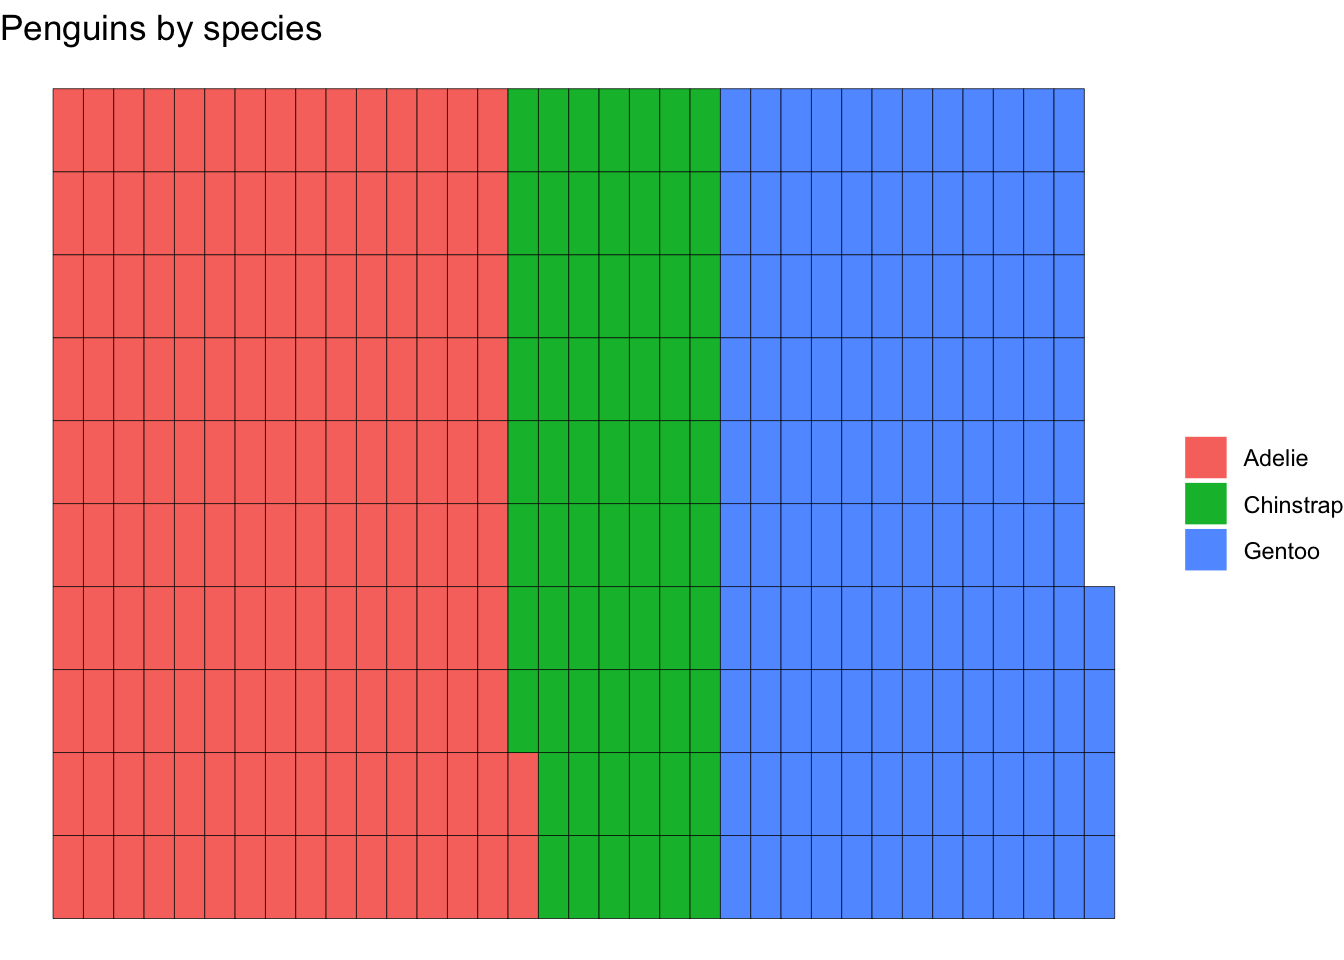
3 Gentoo 124Demonstration: Use the prepared data to draw a basic color-coded waffle chart
penguins |>
  count(species) |>
  ggplot(mapping = aes(fill = species, values = n)) +
  geom_waffle() +
  labs(
    title = "Penguins by species",
    x = NULL,
    y = NULL,
    fill = NULL
  )
Improve the waffle chart
Your turn: Adjust the waffle chart to use a fixed aspect ratio so the symbols are squares. Rotate the chart so the squares are stacked vertically.
penguins |>
  count(species) |>
  ggplot(mapping = aes(fill = species, values = n)) +
  geom_waffle(
    n_rows = 20,
    size = 1,
    color = "white",
    flip = TRUE
  ) +
  labs(
    title = "Penguins by species",
    x = NULL,
    y = NULL,
    fill = NULL
  ) +
  coord_cartesian(ratio = 1)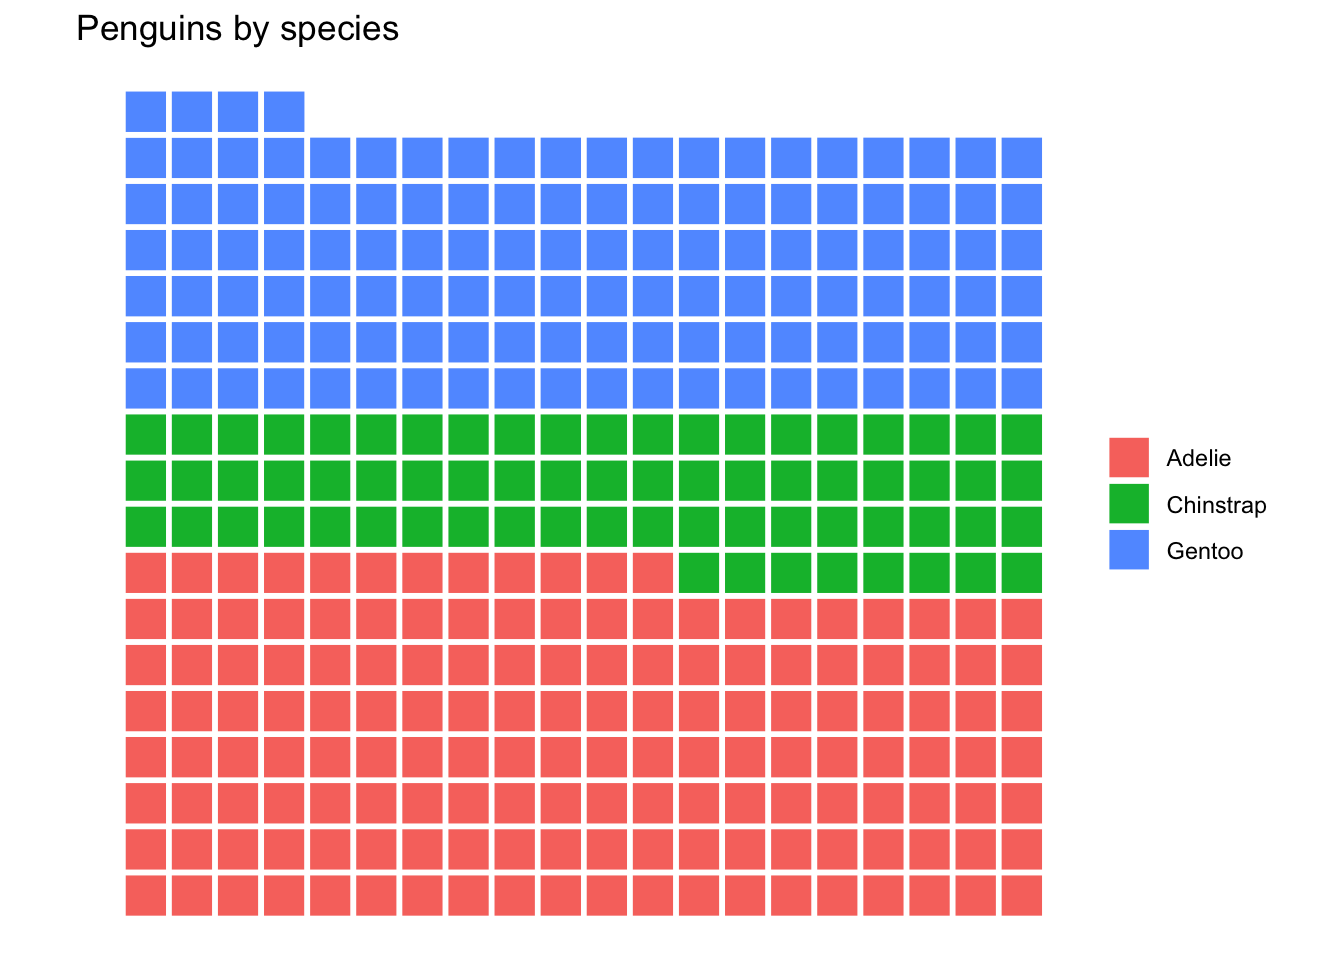
Demonstration: {waffle} will draw all observations on the chart. For larger datasets, this is problematic. Instead, we might want to visualize the proportion of observations in each category. Use geom_waffle() to represent the data as proportions instead.
penguins |>
  count(species) |>
  ggplot(mapping = aes(fill = species, values = n)) +
  geom_waffle(
    size = 1,
    color = "white",
    make_proportional = TRUE
  ) +
  labs(
    title = "Penguins by species",
    x = NULL,
    y = NULL,
    fill = NULL
  ) +
  coord_cartesian(ratio = 1)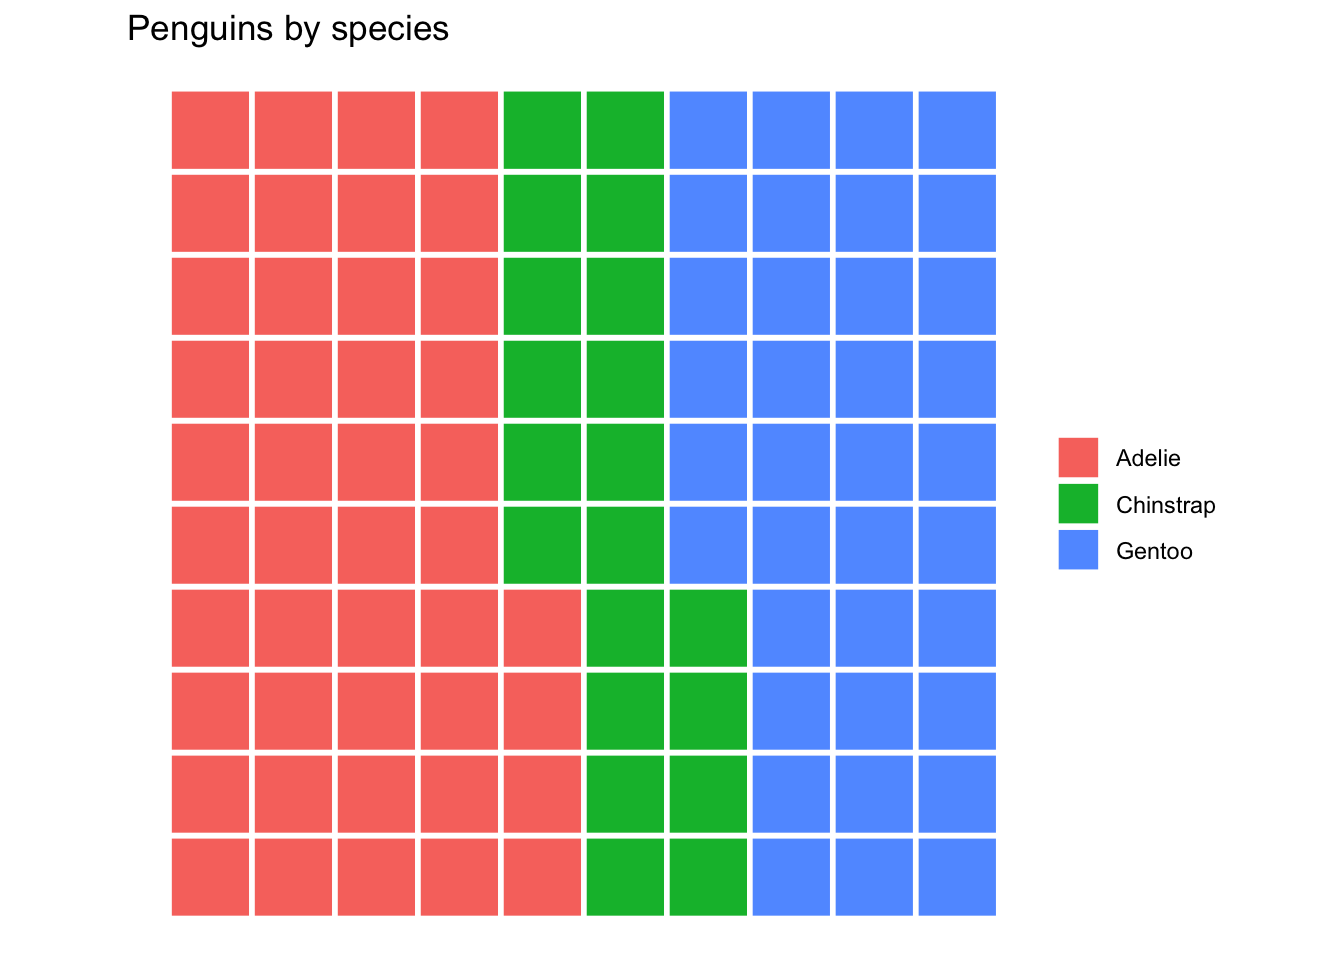
Your turn: Adjust the waffle chart to use a better color palette and move the legend to the top.
penguins |>
  count(species) |>
  ggplot(mapping = aes(fill = species, values = n)) +
  geom_waffle(
    size = 1,
    color = "white",
    make_proportional = TRUE
  ) +
  scale_fill_viridis_d(end = 0.8) +
  labs(
    title = "Penguins by species",
    x = NULL,
    y = NULL,
    fill = NULL
  ) +
  coord_cartesian(ratio = 1) +
  theme(legend.position = "top")
Compare to a pie chart
Demonstration: Create a pie chart and a donut chart to visualize the proportions of penguins by species.
# pie chart
penguins |>
  count(species) |>
  # set x mapping to a constant value
  ggplot(mapping = aes(x = "", y = n, fill = species)) +
  geom_col(color = "white") +
  # use coord_radial() to make it a pie chart
  # theta = "y" means we use y values for the angles
  # expand = FALSE removes a gap between the first and last slice
  coord_radial(theta = "y", expand = FALSE) +
  scale_fill_viridis_d(end = 0.8) +
  labs(
    title = "Penguins by species",
    x = NULL,
    y = NULL,
    fill = NULL
  ) +
  theme_void() +
  theme(legend.position = "top")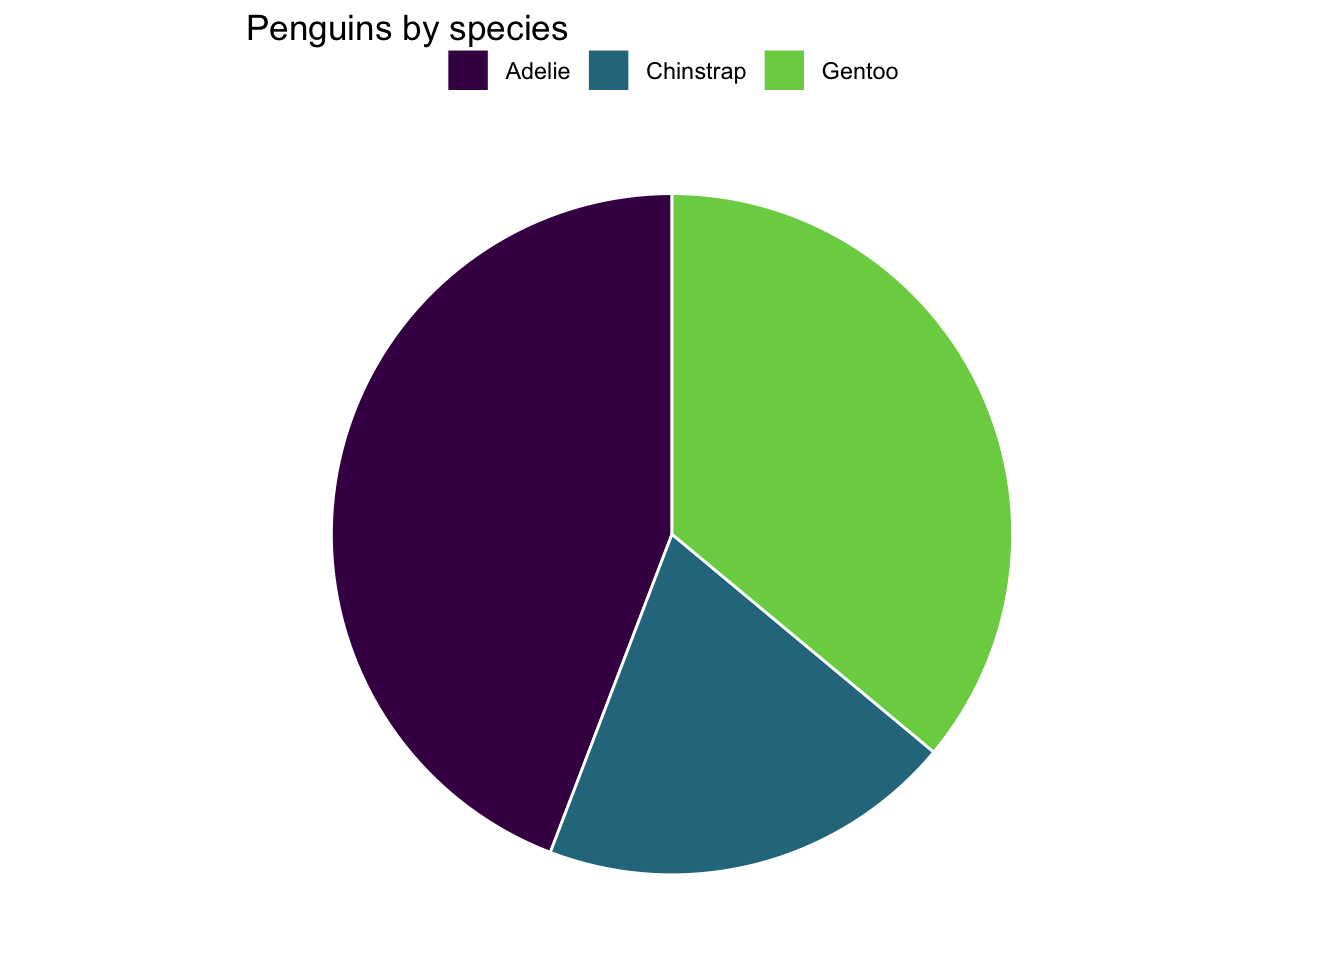
# donut chart
penguins |>
  count(species) |>
  # map x to a constant value of 2 to create space in the middle
  ggplot(mapping = aes(x = 2, y = n, fill = species)) +
  geom_col(color = "white") +
  coord_radial(theta = "y", expand = FALSE) +
  # increase limits to produce white space on the x dimension
  scale_x_continuous(limits = c(0.5, 2.5)) +
  scale_fill_viridis_d(end = 0.8) +
  labs(
    title = "Penguins by species",
    x = NULL,
    y = NULL,
    fill = NULL
  ) +
  theme_void() +
  theme(legend.position = "top")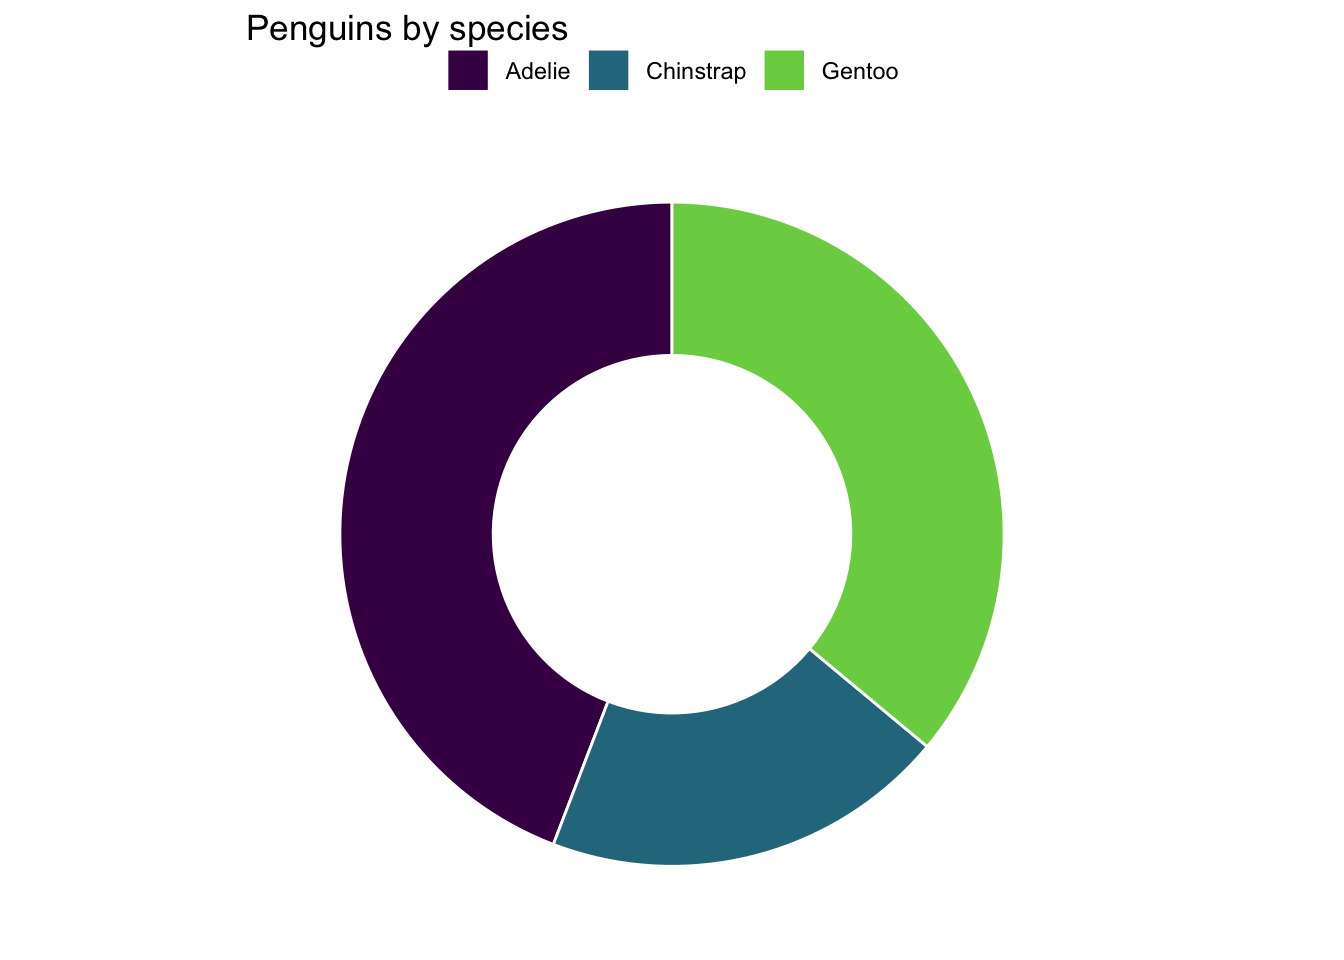
Your turn: Reflect on the differences between waffle charts and pie/donut charts. For this data, which chart type do you find more effective? Why?
Add response here.
sessioninfo::session_info()─ Session info ───────────────────────────────────────────────────────────────
setting value
version R version 4.5.2 (2025-10-31)
os macOS Tahoe 26.2
system aarch64, darwin20
ui X11
language (EN)
collate en_US.UTF-8
ctype en_US.UTF-8
tz America/New_York
date 2026-02-06
pandoc 3.4 @ /usr/local/bin/ (via rmarkdown)
quarto 1.9.18 @ /usr/local/bin/quarto
─ Packages ───────────────────────────────────────────────────────────────────
! package * version date (UTC) lib source
P cli 3.6.5 2025-04-23 [?] RSPM (R 4.5.0)
P curl 7.0.0 2025-08-19 [?] RSPM (R 4.5.0)
P digest 0.6.39 2025-11-19 [?] RSPM (R 4.5.0)
P dplyr * 1.1.4 2023-11-17 [?] RSPM (R 4.5.0)
P DT 0.34.0 2025-09-02 [?] RSPM
P evaluate 1.0.5 2025-08-27 [?] RSPM (R 4.5.0)
P extrafont 0.20 2025-09-24 [?] RSPM
P extrafontdb 1.1 2025-09-28 [?] RSPM
P farver 2.1.2 2024-05-13 [?] RSPM (R 4.5.0)
P fastmap 1.2.0 2024-05-15 [?] RSPM (R 4.5.0)
P forcats * 1.0.1 2025-09-25 [?] RSPM (R 4.5.0)
P generics 0.1.4 2025-05-09 [?] RSPM (R 4.5.0)
P ggplot2 * 4.0.1 2025-11-14 [?] RSPM (R 4.5.0)
P glue 1.8.0 2024-09-30 [?] RSPM (R 4.5.0)
P gridExtra 2.3 2017-09-09 [?] RSPM (R 4.5.0)
P gtable 0.3.6 2024-10-25 [?] RSPM (R 4.5.0)
P here 1.0.2 2025-09-15 [?] CRAN (R 4.5.0)
P hms 1.1.4 2025-10-17 [?] RSPM (R 4.5.0)
P htmltools 0.5.9 2025-12-04 [?] RSPM (R 4.5.0)
P htmlwidgets 1.6.4 2023-12-06 [?] RSPM (R 4.5.0)
P jsonlite 2.0.0 2025-03-27 [?] RSPM (R 4.5.0)
P knitr 1.51 2025-12-20 [?] RSPM (R 4.5.0)
P labeling 0.4.3 2023-08-29 [?] RSPM (R 4.5.0)
P lifecycle 1.0.4 2023-11-07 [?] RSPM (R 4.5.0)
P lubridate * 1.9.4 2024-12-08 [?] RSPM (R 4.5.0)
P magrittr 2.0.4 2025-09-12 [?] RSPM (R 4.5.0)
P otel 0.2.0 2025-08-29 [?] RSPM (R 4.5.0)
P pillar 1.11.1 2025-09-17 [?] RSPM (R 4.5.0)
P pkgconfig 2.0.3 2019-09-22 [?] RSPM (R 4.5.0)
P plyr 1.8.9 2023-10-02 [?] RSPM (R 4.5.0)
P purrr * 1.2.0 2025-11-04 [?] CRAN (R 4.5.0)
P R6 2.6.1 2025-02-15 [?] RSPM (R 4.5.0)
P RColorBrewer 1.1-3 2022-04-03 [?] RSPM (R 4.5.0)
P Rcpp 1.1.0 2025-07-02 [?] RSPM (R 4.5.0)
P readr * 2.1.6 2025-11-14 [?] RSPM (R 4.5.0)
renv 1.0.11 2024-10-12 [1] CRAN (R 4.5.2)
P rlang 1.1.6 2025-04-11 [?] RSPM (R 4.5.0)
P rmarkdown 2.30 2025-09-28 [?] RSPM (R 4.5.0)
P rprojroot 2.1.1 2025-08-26 [?] RSPM (R 4.5.0)
P Rttf2pt1 1.3.14 2025-09-26 [?] RSPM
P S7 0.2.1 2025-11-14 [?] RSPM (R 4.5.0)
P scales 1.4.0 2025-04-24 [?] RSPM (R 4.5.0)
P sessioninfo 1.2.3 2025-02-05 [?] RSPM (R 4.5.0)
P stringi 1.8.7 2025-03-27 [?] RSPM (R 4.5.0)
P stringr * 1.6.0 2025-11-04 [?] RSPM (R 4.5.0)
P tibble * 3.3.0 2025-06-08 [?] RSPM (R 4.5.0)
P tidyr * 1.3.2 2025-12-19 [?] RSPM (R 4.5.0)
P tidyselect 1.2.1 2024-03-11 [?] RSPM (R 4.5.0)
P tidyverse * 2.0.0 2023-02-22 [?] RSPM (R 4.5.0)
P timechange 0.3.0 2024-01-18 [?] RSPM (R 4.5.0)
P tzdb 0.5.0 2025-03-15 [?] RSPM (R 4.5.0)
P vctrs 0.6.5 2023-12-01 [?] RSPM (R 4.5.0)
P viridis * 0.6.5 2024-01-29 [?] RSPM (R 4.5.0)
P viridisLite * 0.4.2 2023-05-02 [?] RSPM (R 4.5.0)
P waffle * 1.0.2 2026-01-05 [?] Github (hrbrmstr/waffle@767875b)
P withr 3.0.2 2024-10-28 [?] RSPM (R 4.5.0)
P xfun 0.55 2025-12-16 [?] CRAN (R 4.5.2)
P yaml 2.3.12 2025-12-10 [?] RSPM (R 4.5.0)
[1] /Users/bcs88/Projects/info-3312/course-site/renv/library/macos/R-4.5/aarch64-apple-darwin20
[2] /Users/bcs88/Library/Caches/org.R-project.R/R/renv/sandbox/macos/R-4.5/aarch64-apple-darwin20/4cd76b74
* ── Packages attached to the search path.
P ── Loaded and on-disk path mismatch.
──────────────────────────────────────────────────────────────────────────────