library(tidyverse)
library(palmerpenguins)
library(ggwaffle)
library(viridis)
library(emojifont)

# fix seed value for reproducibility
set.seed(123)

theme_set(theme_void())
Waffle charts for visualizing proportions
Suggested answers
Application exercise
Answers
Important
These are suggested answers. This document should be used as reference only, it’s not designed to be an exhaustive key.
Waffle charts
ggwaffle provides a ggplot2 implementation of waffle plots. The typical workflow consists of preparing the data with waffle_iron() and then plotting it with ggplot2 and geom_waffle().
Basic waffle chart
Demonstration: Prepare the penguins data frame to visualize the number of penguins by species.
penguins |>
  waffle_iron(mapping = aes_d(group = species)) |>
  as_tibble()
# A tibble: 344 × 3
y x group
<int> <int> <fct>
1 1 1 Adelie
2 2 1 Adelie
3 3 1 Adelie
4 4 1 Adelie
5 5 1 Adelie
6 6 1 Adelie
7 7 1 Adelie
8 8 1 Adelie
9 1 2 Adelie
10 2 2 Adelie
# ℹ 334 more rowsDemonstration: Use the prepared data to draw a basic color-coded waffle chart
penguins |>
  waffle_iron(mapping = aes_d(group = species)) |>
  ggplot(mapping = aes(x = x, y = y, fill = group)) +
  geom_waffle() +
  labs(
    title = "Penguins by species",
    x = NULL, y = NULL, fill = NULL
  )
Improve the waffle chart
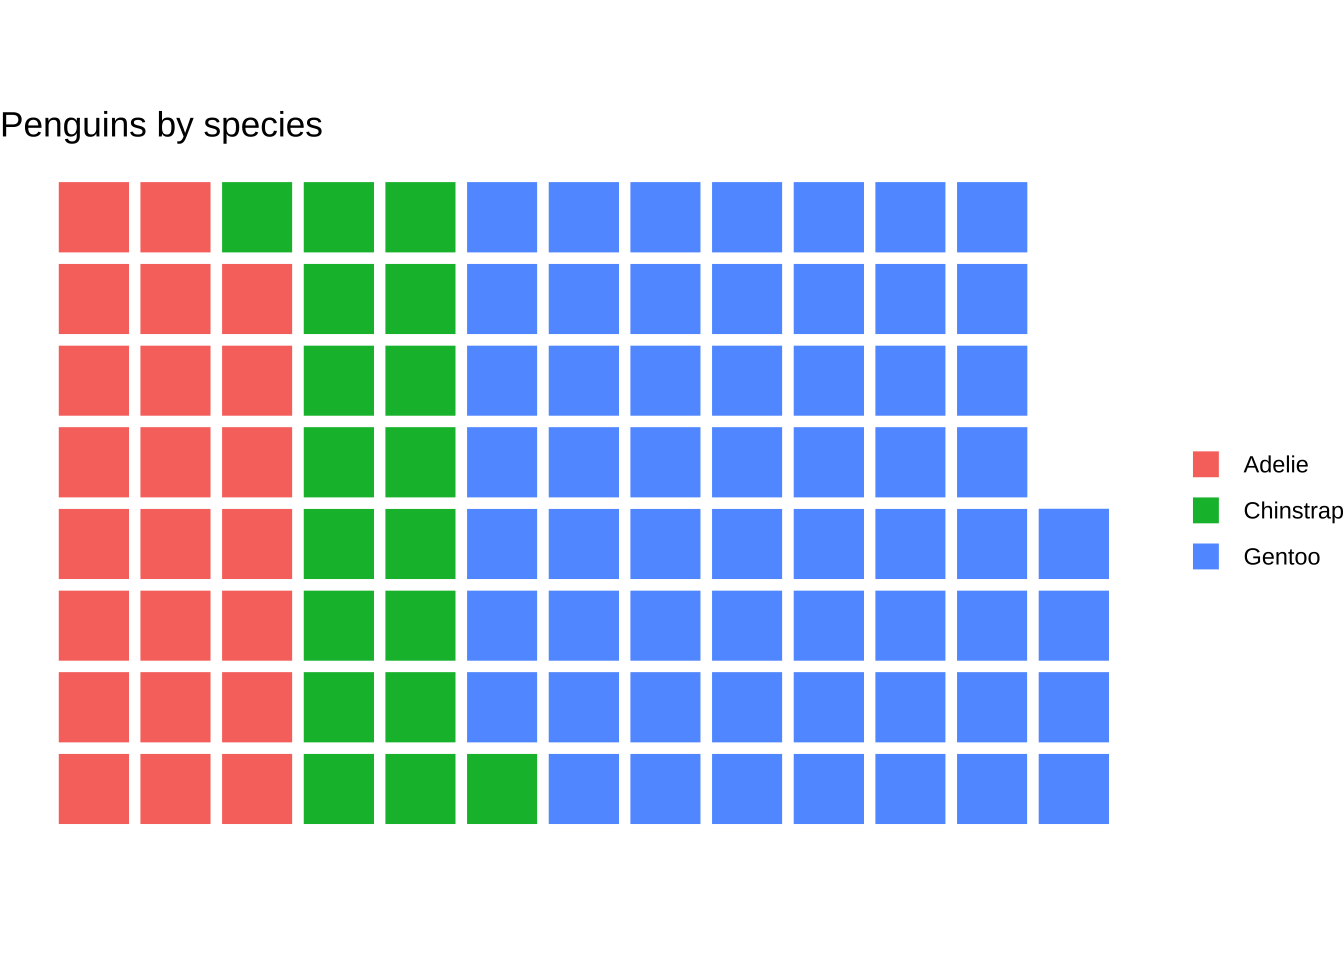
Your turn: Adjust the waffle chart to use a fixed aspect ratio so the symbols are squares.
penguins |>
  waffle_iron(mapping = aes_d(group = species)) |>
  ggplot(mapping = aes(x = x, y = y, fill = group)) +
  geom_waffle() +
  coord_equal() +
  labs(
    title = "Penguins by species",
    x = NULL, y = NULL, fill = NULL
  )
Demonstration: ggwaffle will draw all observations on the chart. For larger datasets, this is problematic. Instead, we might want to visualize the proportion of observations in each category. In order to produce the desired data structure, we need to use slice_sample() to sample the data and weight_by to sample the data proportionally to the number of observations in each category.
penguins |>
  slice_sample(n = 100, weight_by = species) |>
  waffle_iron(mapping = aes_d(group = species)) |>
  ggplot(mapping = aes(x = x, y = y, fill = group)) +
  geom_waffle() +
  coord_equal() +
  labs(
    title = "Penguins by species",
    x = NULL, y = NULL, fill = NULL
  )
Your turn: Adjust the waffle chart to use a better color palette and move the legend to the top.
penguins |>
  slice_sample(n = 100, weight_by = species) |>
  waffle_iron(mapping = aes_d(group = species)) |>
  ggplot(mapping = aes(x = x, y = y, fill = group)) +
  geom_waffle() +
  coord_equal() +
  scale_fill_viridis_d(end = 0.8) +
  labs(
    title = "Penguins by species",
    x = NULL, y = NULL, fill = NULL
  ) +
  theme(legend.position = "top")
(Stretch) demonstration: Use the emojifont package to visualize each waffle “square” using a penguin emoji.
penguins |>
  slice_sample(n = 100, weight_by = species) |>
  waffle_iron(mapping = aes_d(group = species)) |>
  mutate(label = fontawesome("fa-linux")) |>
  ggplot(mapping = aes(x = x, y = y, color = group)) +
  geom_text(mapping = aes(label = label), family = "fontawesome-webfont", size = 12) +
  coord_equal() +
  scale_color_viridis_d(end = 0.8) +
  labs(
    title = "Penguins by species",
    x = NULL, y = NULL, color = NULL
  ) +
  theme_void() +
  theme(legend.position = "top")
Session information
sessioninfo::session_info()─ Session info ───────────────────────────────────────────────────────────────
setting value
version R version 4.3.2 (2023-10-31)
os macOS Ventura 13.5.2
system aarch64, darwin20
ui X11
language (EN)
collate en_US.UTF-8
ctype en_US.UTF-8
tz America/New_York
date 2024-02-10
pandoc 3.1.1 @ /Applications/RStudio.app/Contents/Resources/app/quarto/bin/tools/ (via rmarkdown)
─ Packages ───────────────────────────────────────────────────────────────────
package * version date (UTC) lib source
cli 3.6.2 2023-12-11 [1] CRAN (R 4.3.1)
colorspace 2.1-0 2023-01-23 [1] CRAN (R 4.3.0)
digest 0.6.34 2024-01-11 [1] CRAN (R 4.3.1)
dplyr * 1.1.4 2023-11-17 [1] CRAN (R 4.3.1)
emojifont * 0.5.5 2021-04-20 [1] CRAN (R 4.3.0)
evaluate 0.23 2023-11-01 [1] CRAN (R 4.3.1)
fansi 1.0.6 2023-12-08 [1] CRAN (R 4.3.1)
farver 2.1.1 2022-07-06 [1] CRAN (R 4.3.0)
fastmap 1.1.1 2023-02-24 [1] CRAN (R 4.3.0)
forcats * 1.0.0 2023-01-29 [1] CRAN (R 4.3.0)
generics 0.1.3 2022-07-05 [1] CRAN (R 4.3.0)
ggplot2 * 3.4.4 2023-10-12 [1] CRAN (R 4.3.1)
ggwaffle * 0.2.5 2023-06-19 [1] Github (liamgilbey/ggwaffle@e4f18e9)
glue 1.7.0 2024-01-09 [1] CRAN (R 4.3.1)
gridExtra 2.3 2017-09-09 [1] CRAN (R 4.3.0)
gtable 0.3.4 2023-08-21 [1] CRAN (R 4.3.0)
here 1.0.1 2020-12-13 [1] CRAN (R 4.3.0)
hms 1.1.3 2023-03-21 [1] CRAN (R 4.3.0)
htmltools 0.5.7 2023-11-03 [1] CRAN (R 4.3.1)
htmlwidgets 1.6.4 2023-12-06 [1] CRAN (R 4.3.1)
jsonlite 1.8.8 2023-12-04 [1] CRAN (R 4.3.1)
knitr 1.45 2023-10-30 [1] CRAN (R 4.3.1)
labeling 0.4.3 2023-08-29 [1] CRAN (R 4.3.0)
lifecycle 1.0.4 2023-11-07 [1] CRAN (R 4.3.1)
lubridate * 1.9.3 2023-09-27 [1] CRAN (R 4.3.1)
magrittr 2.0.3 2022-03-30 [1] CRAN (R 4.3.0)
munsell 0.5.0 2018-06-12 [1] CRAN (R 4.3.0)
palmerpenguins * 0.1.1 2022-08-15 [1] CRAN (R 4.3.0)
pillar 1.9.0 2023-03-22 [1] CRAN (R 4.3.0)
pkgconfig 2.0.3 2019-09-22 [1] CRAN (R 4.3.0)
proto 1.0.0 2016-10-29 [1] CRAN (R 4.3.0)
purrr * 1.0.2 2023-08-10 [1] CRAN (R 4.3.0)
R6 2.5.1 2021-08-19 [1] CRAN (R 4.3.0)
readr * 2.1.5 2024-01-10 [1] CRAN (R 4.3.1)
rlang 1.1.3 2024-01-10 [1] CRAN (R 4.3.1)
rmarkdown 2.25 2023-09-18 [1] CRAN (R 4.3.1)
rprojroot 2.0.4 2023-11-05 [1] CRAN (R 4.3.1)
rstudioapi 0.15.0 2023-07-07 [1] CRAN (R 4.3.0)
scales 1.2.1 2024-01-18 [1] Github (r-lib/scales@c8eb772)
sessioninfo 1.2.2 2021-12-06 [1] CRAN (R 4.3.0)
showtext 0.9-6 2023-05-03 [1] CRAN (R 4.3.0)
showtextdb 3.0 2020-06-04 [1] CRAN (R 4.3.0)
stringi 1.8.3 2023-12-11 [1] CRAN (R 4.3.1)
stringr * 1.5.1 2023-11-14 [1] CRAN (R 4.3.1)
sysfonts 0.8.8 2022-03-13 [1] CRAN (R 4.3.0)
tibble * 3.2.1 2023-03-20 [1] CRAN (R 4.3.0)
tidyr * 1.3.0 2023-01-24 [1] CRAN (R 4.3.0)
tidyselect 1.2.0 2022-10-10 [1] CRAN (R 4.3.0)
tidyverse * 2.0.0 2023-02-22 [1] CRAN (R 4.3.0)
timechange 0.2.0 2023-01-11 [1] CRAN (R 4.3.0)
tzdb 0.4.0 2023-05-12 [1] CRAN (R 4.3.0)
utf8 1.2.4 2023-10-22 [1] CRAN (R 4.3.1)
vctrs 0.6.5 2023-12-01 [1] CRAN (R 4.3.1)
viridis * 0.6.4 2023-07-22 [1] CRAN (R 4.3.0)
viridisLite * 0.4.2 2023-05-02 [1] CRAN (R 4.3.0)
withr 2.5.2 2023-10-30 [1] CRAN (R 4.3.1)
xfun 0.41 2023-11-01 [1] CRAN (R 4.3.1)
yaml 2.3.8 2023-12-11 [1] CRAN (R 4.3.1)
[1] /Library/Frameworks/R.framework/Versions/4.3-arm64/Resources/library
──────────────────────────────────────────────────────────────────────────────