Qualities of great visualizations
Lecture 02
August 27, 2026

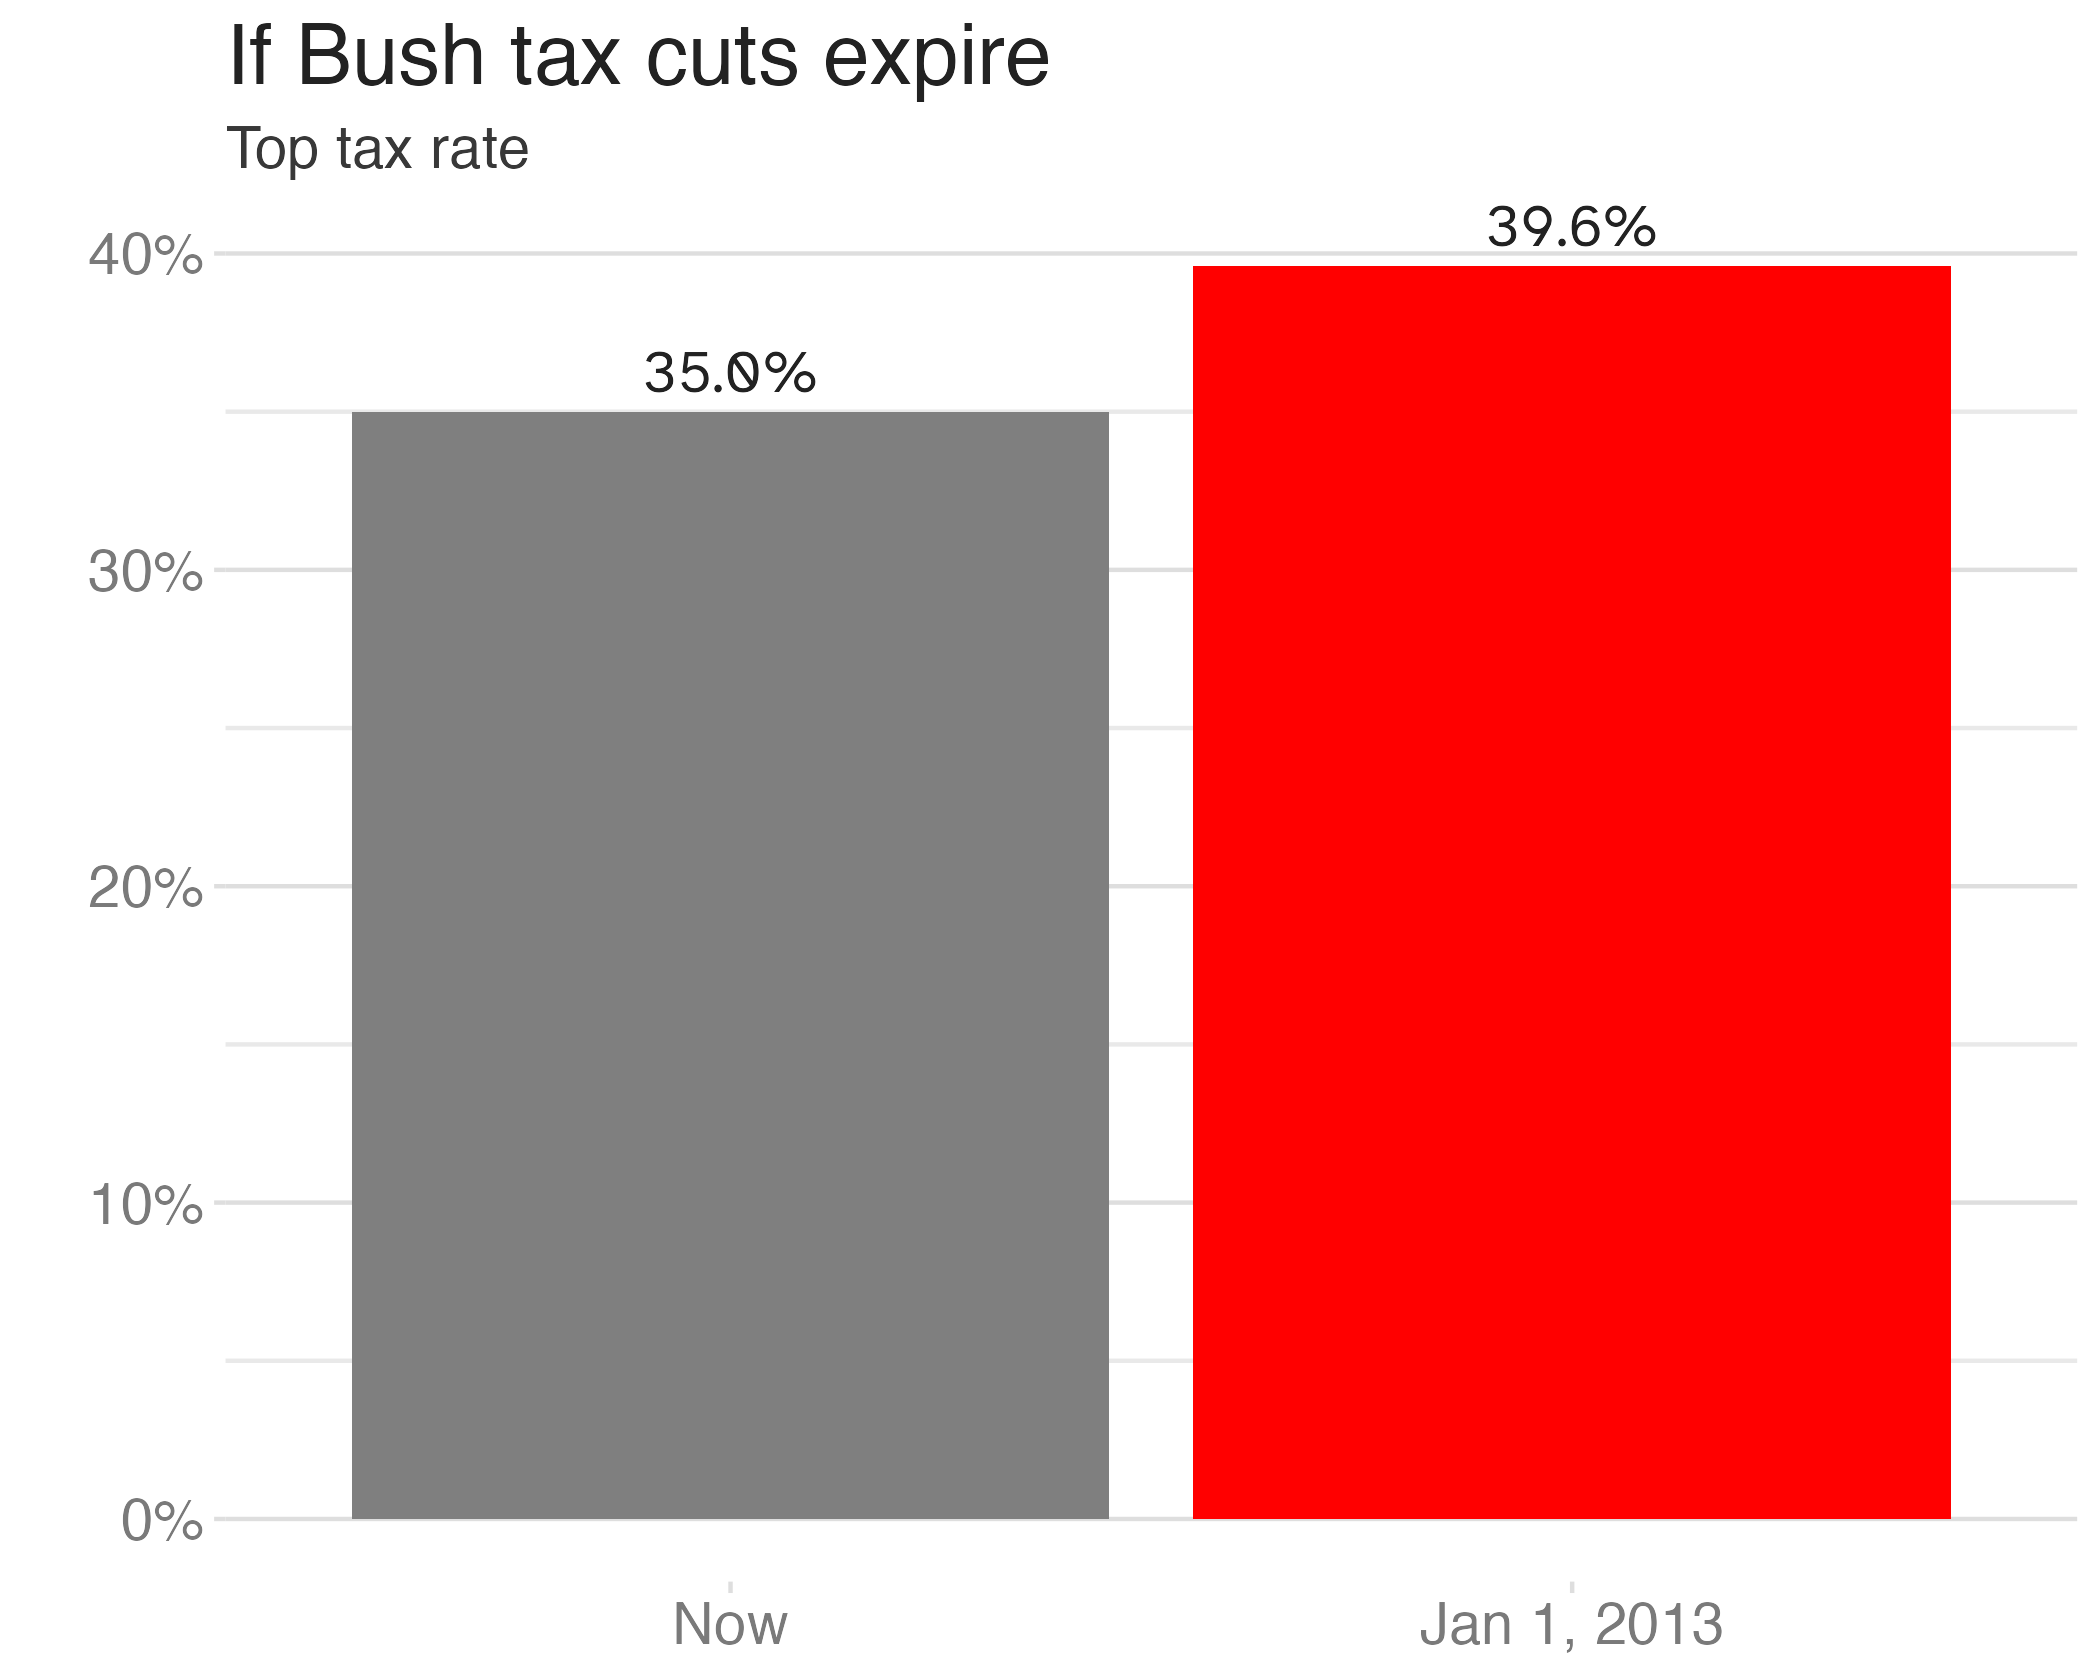
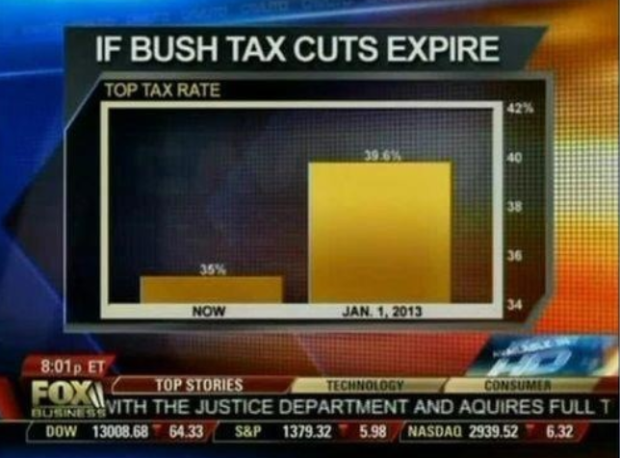
Truncated axes
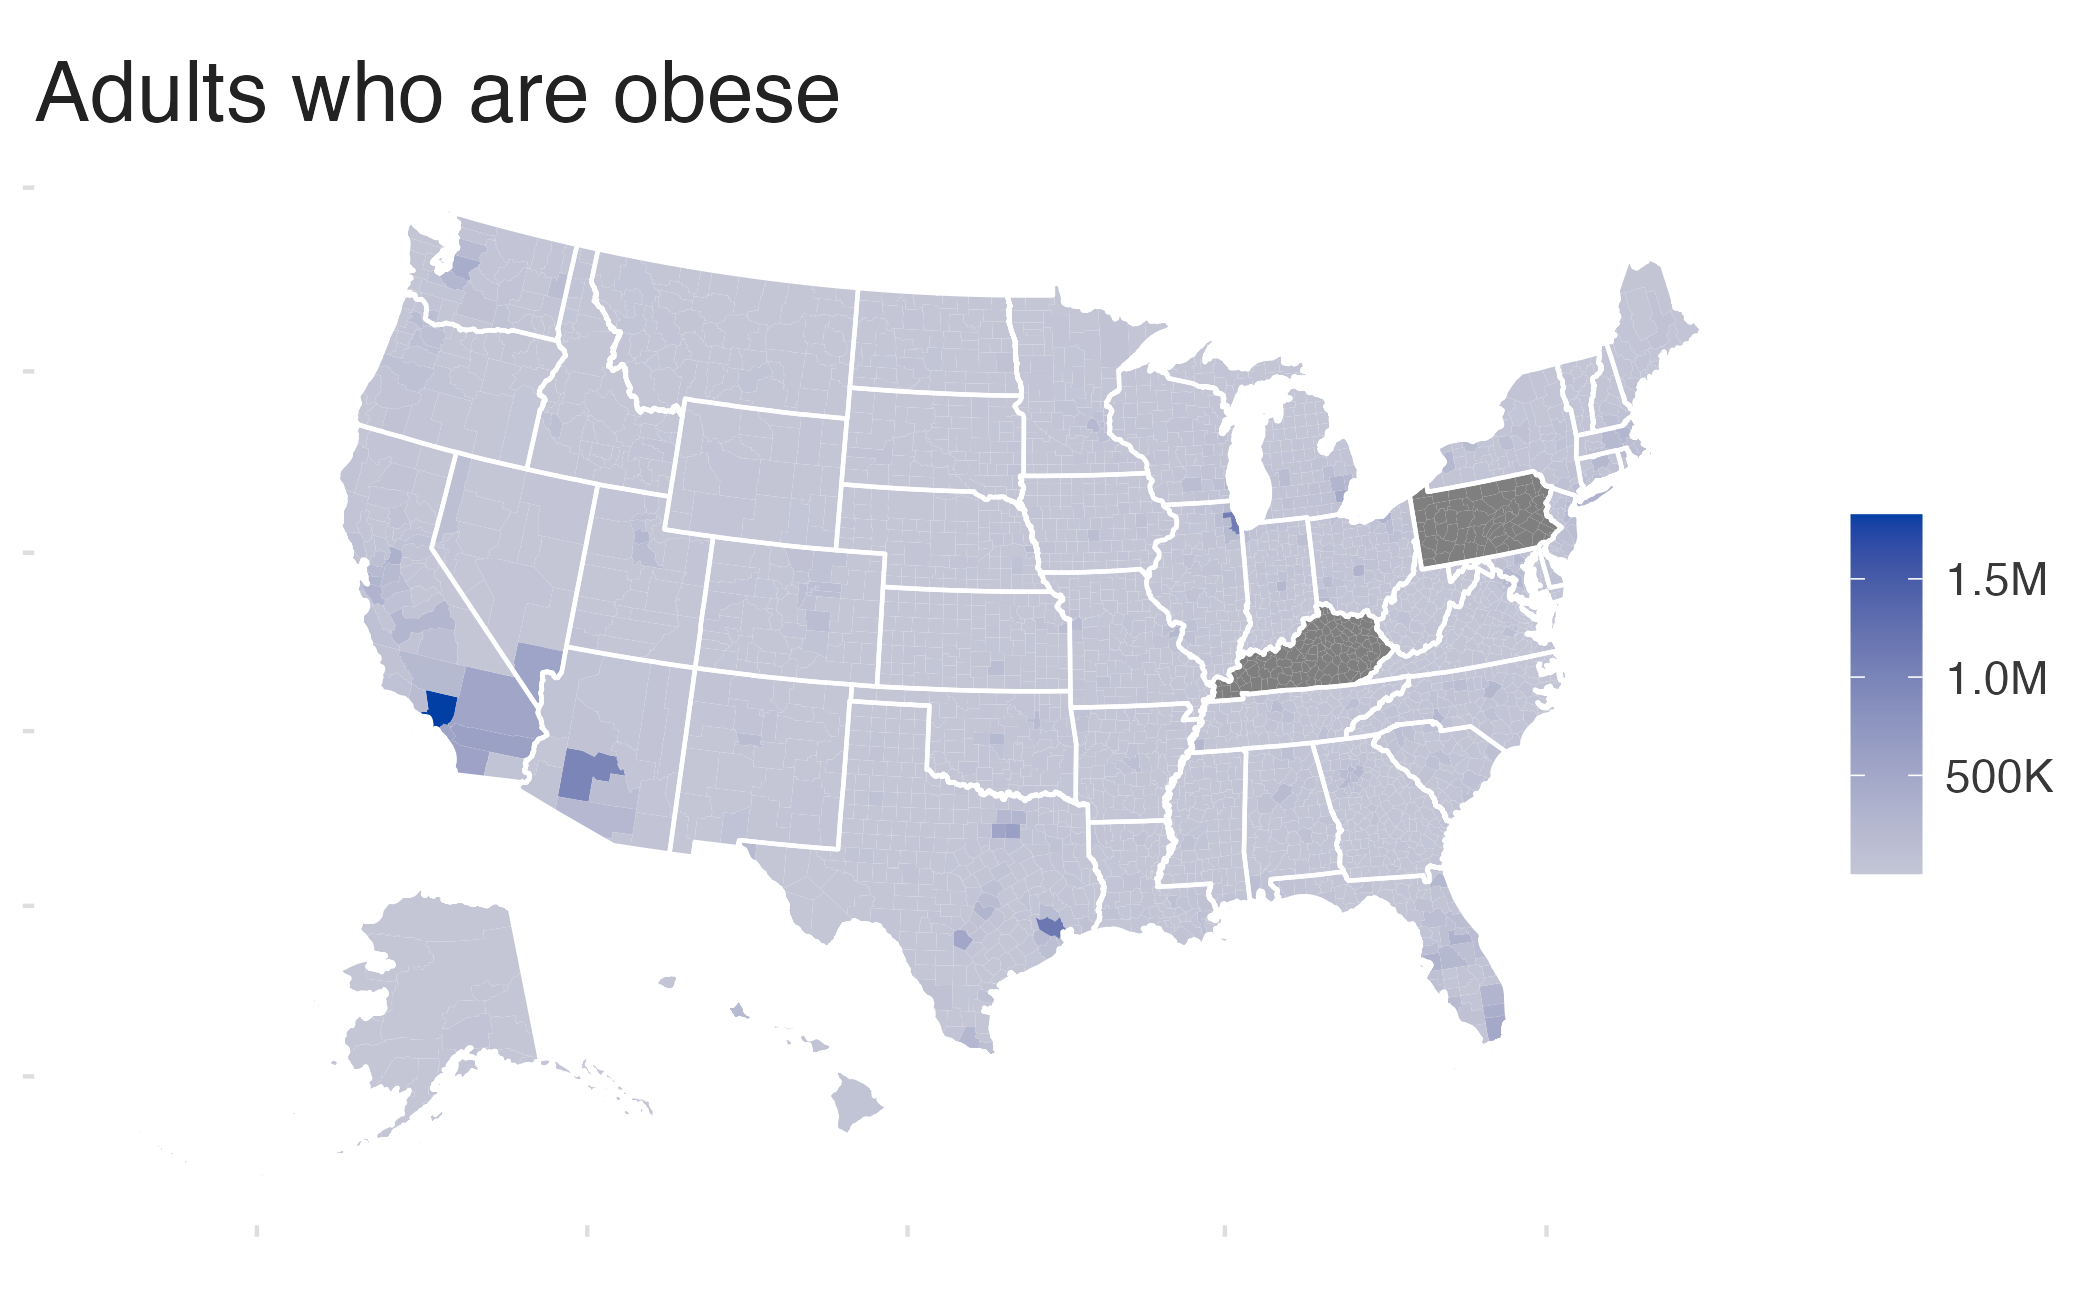
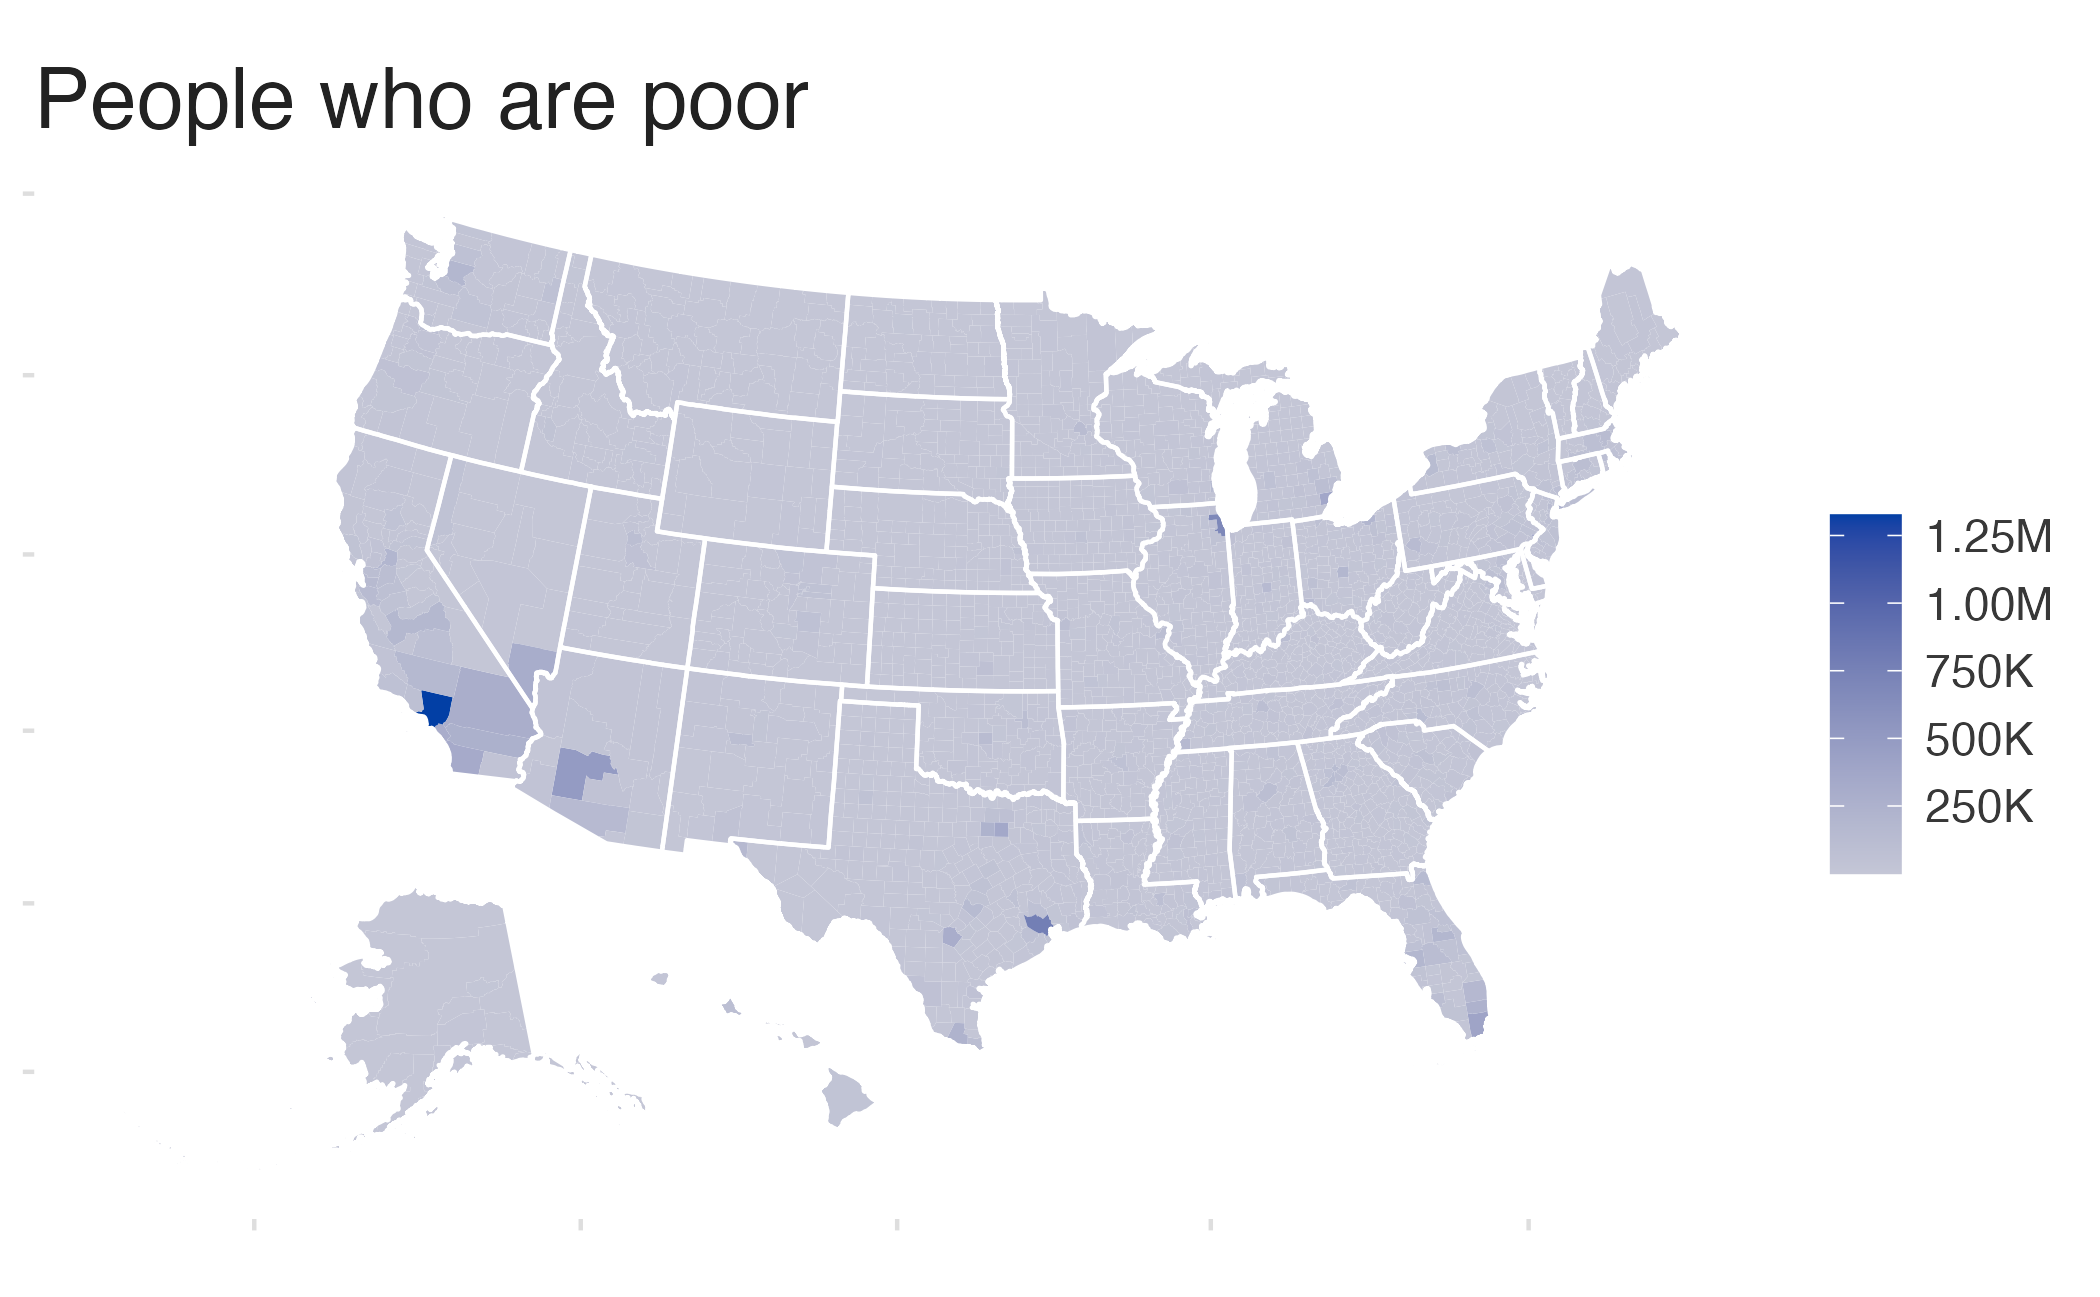
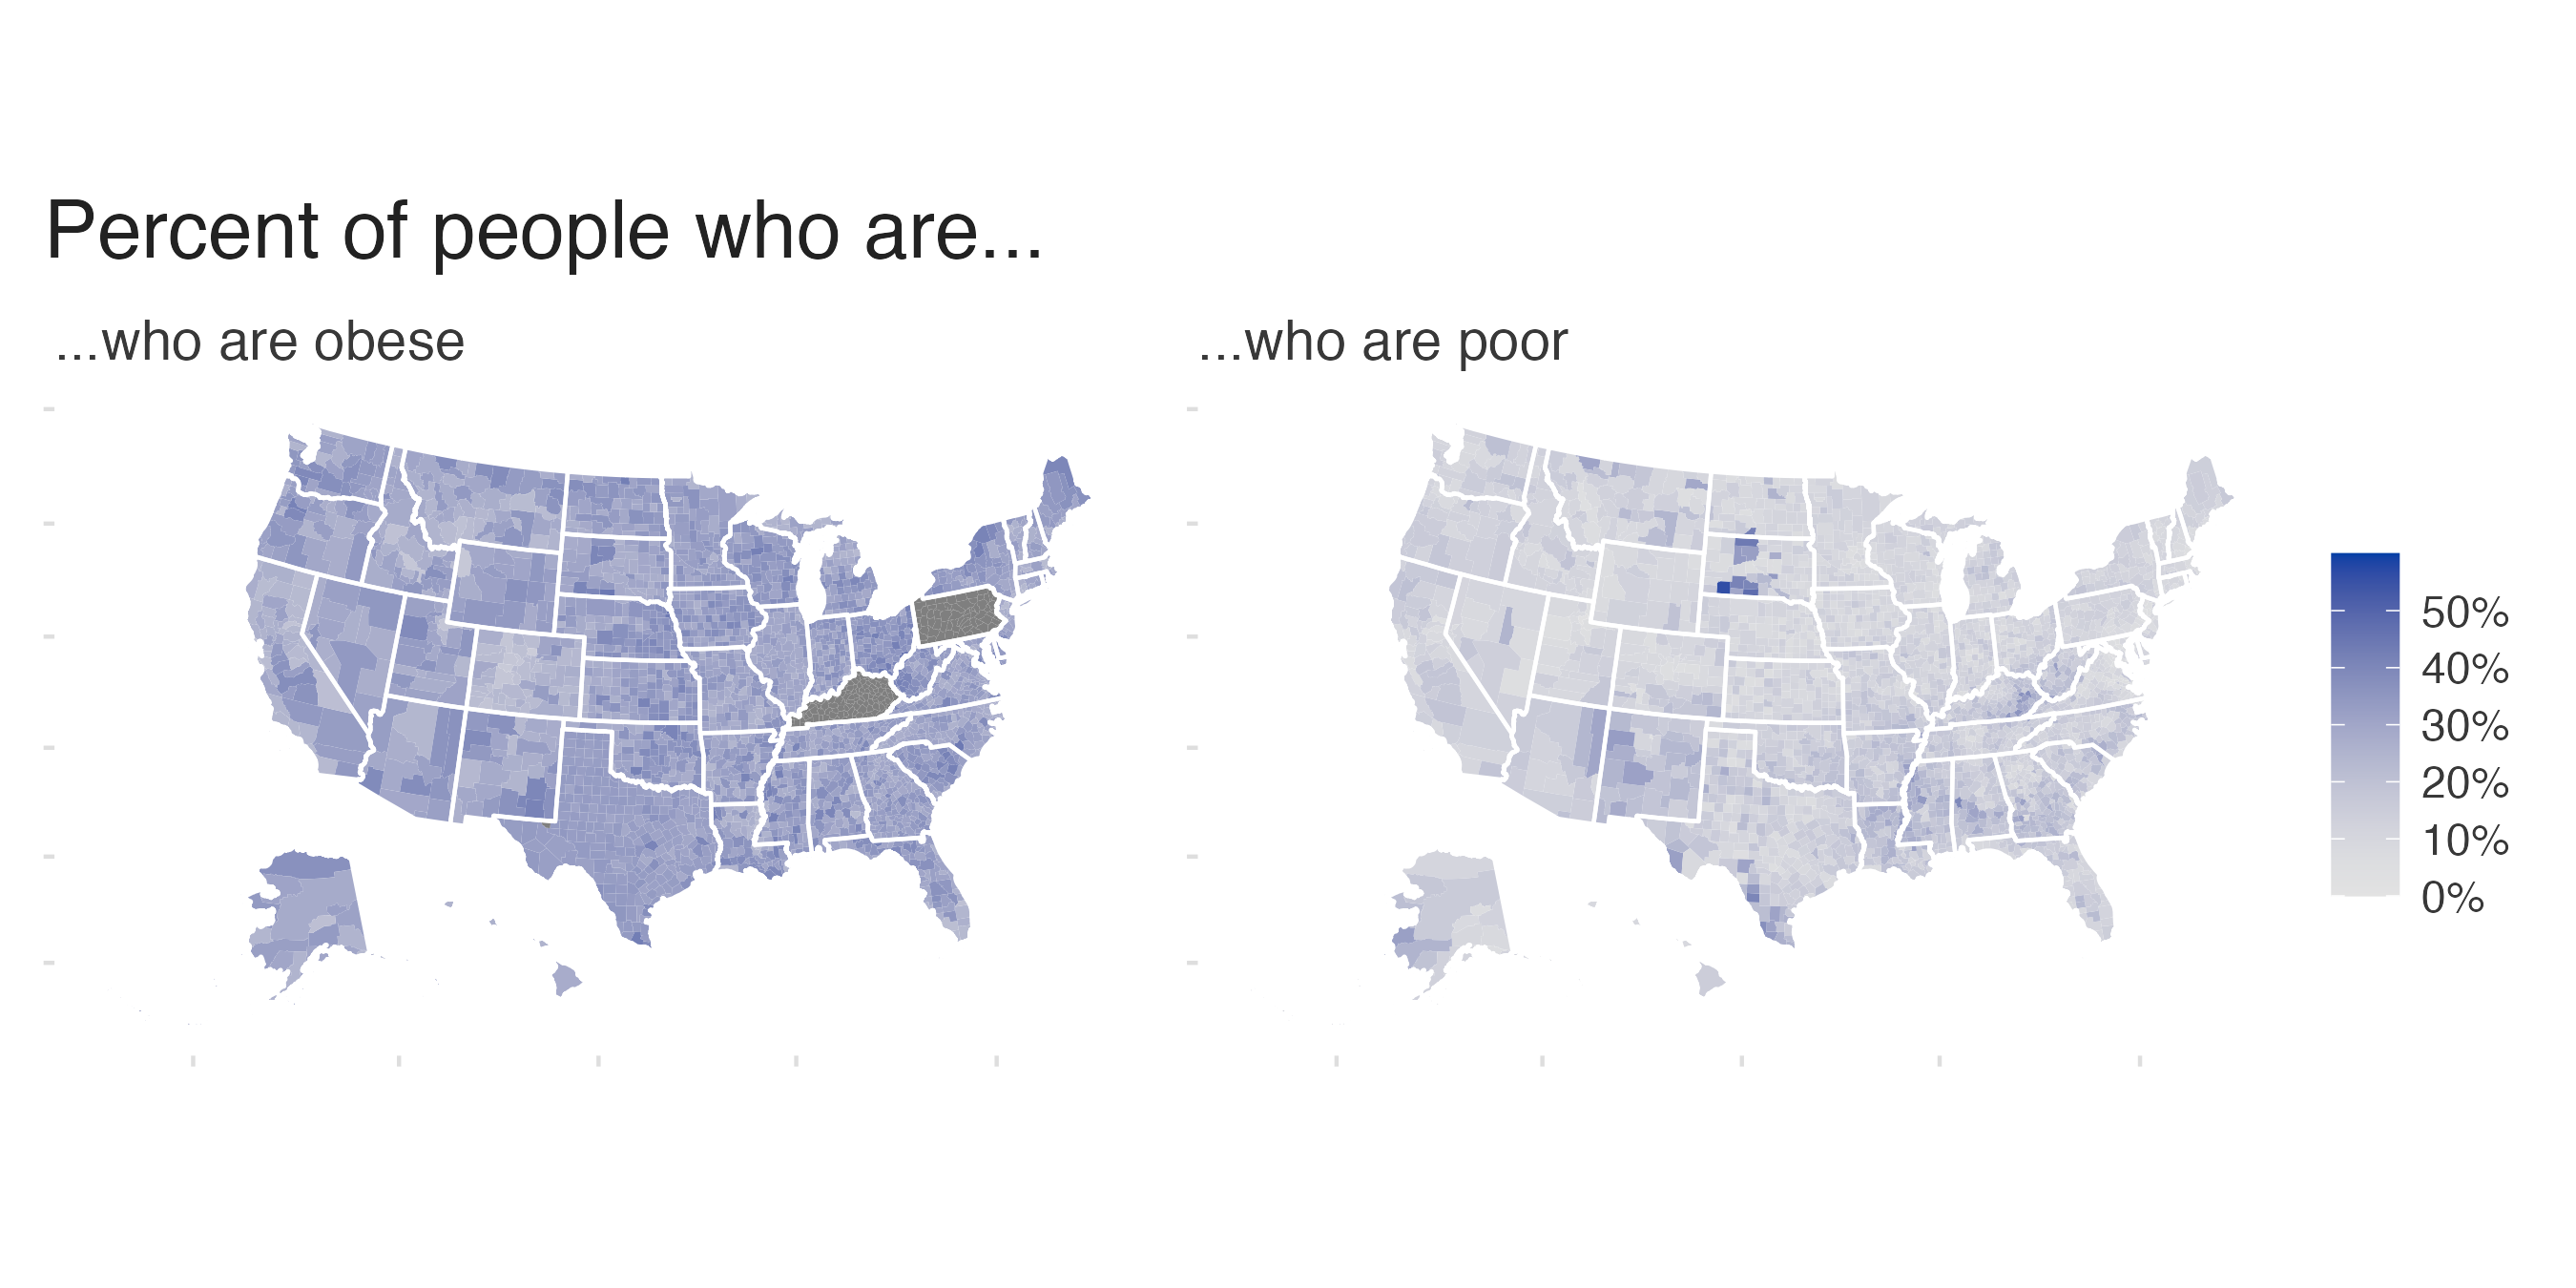
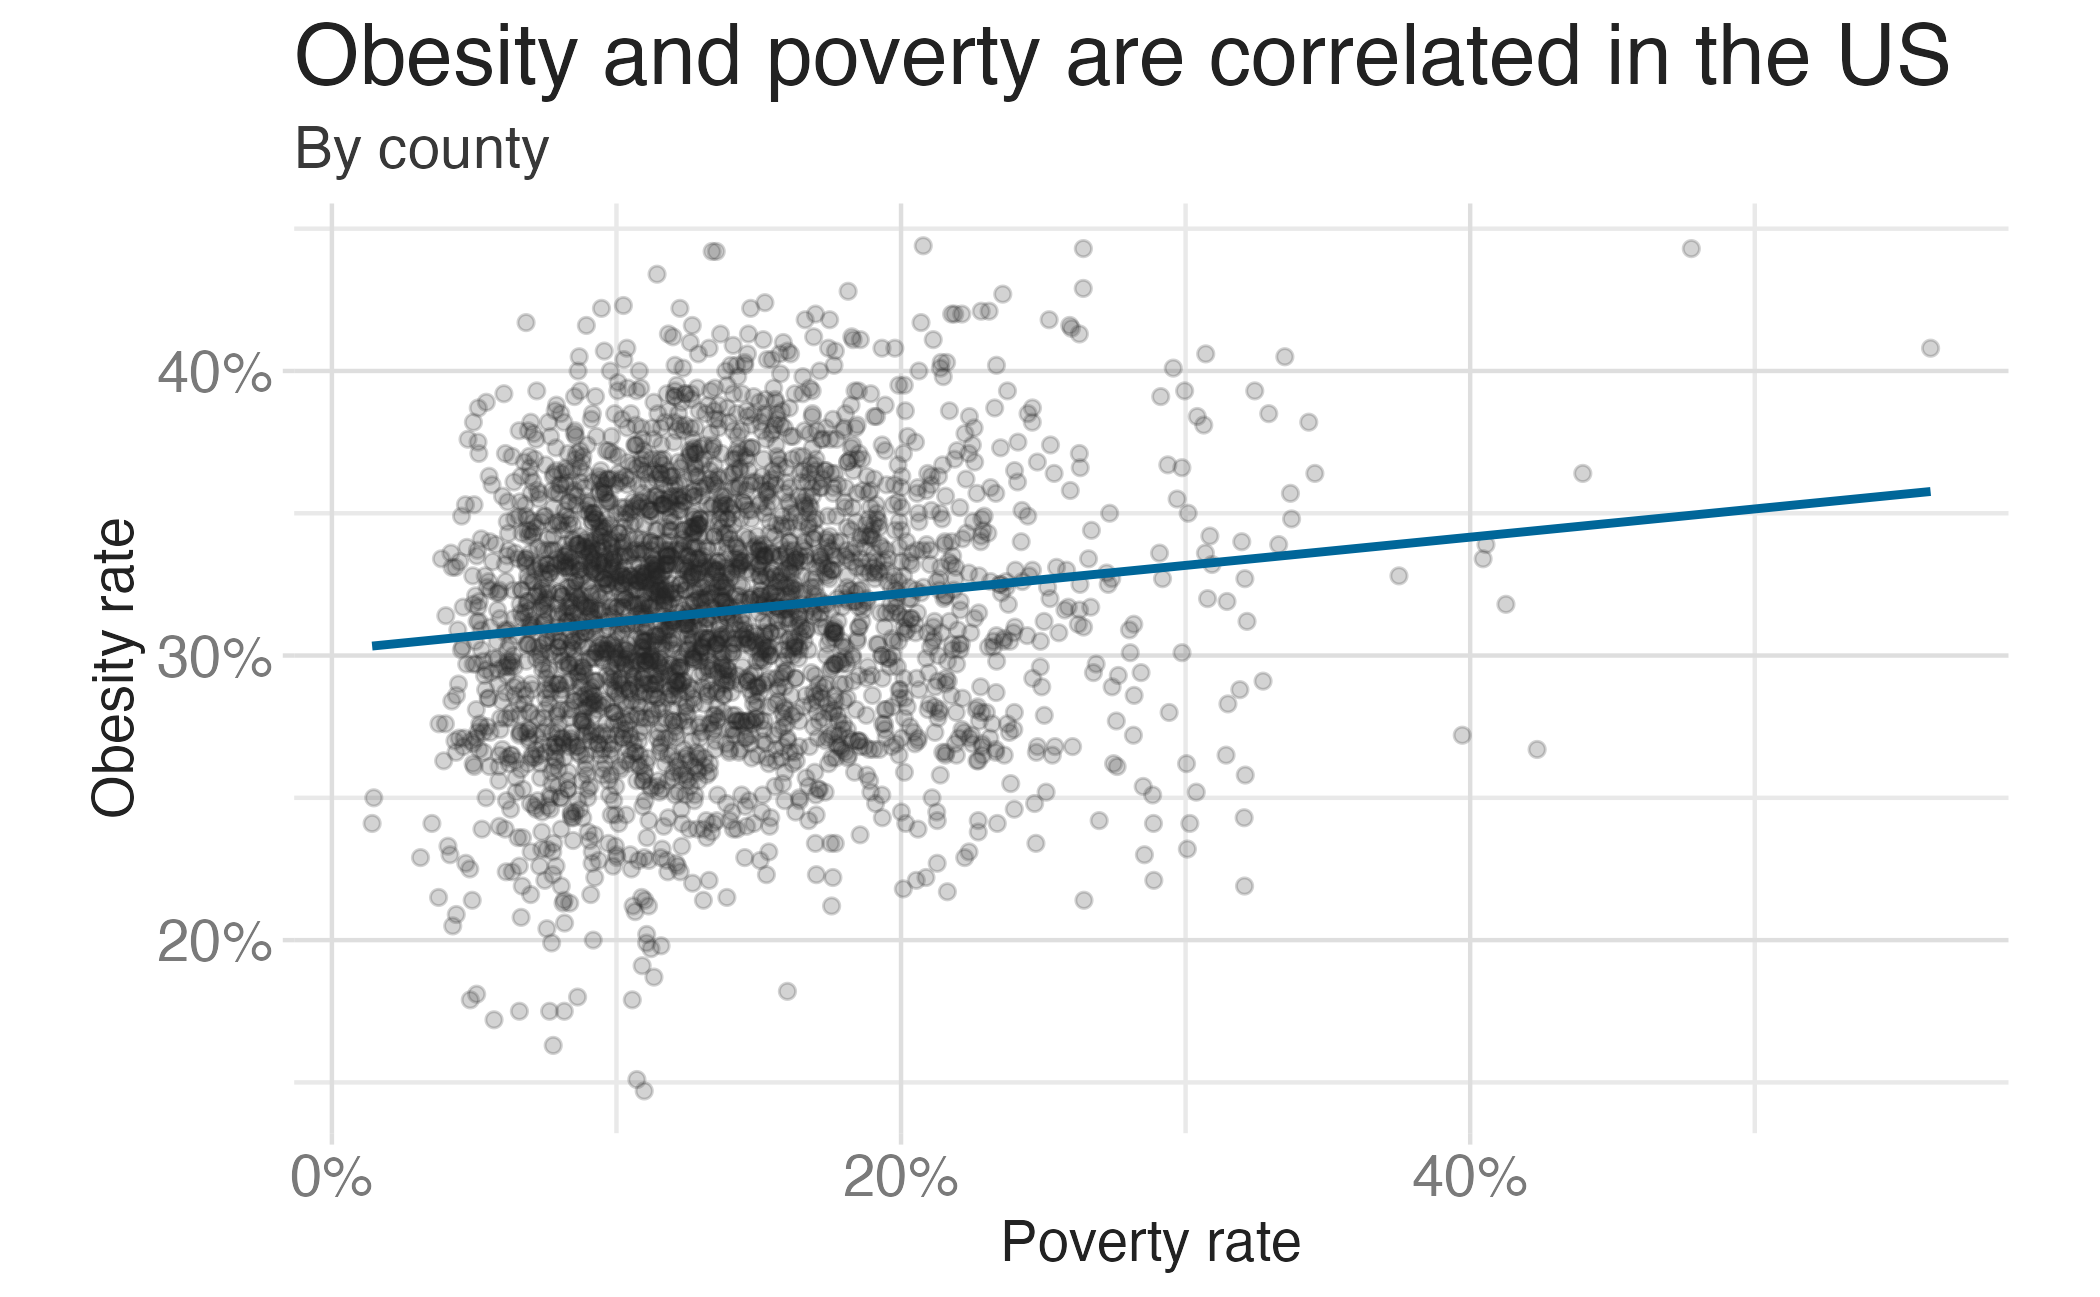
Obesity and poverty in the United States
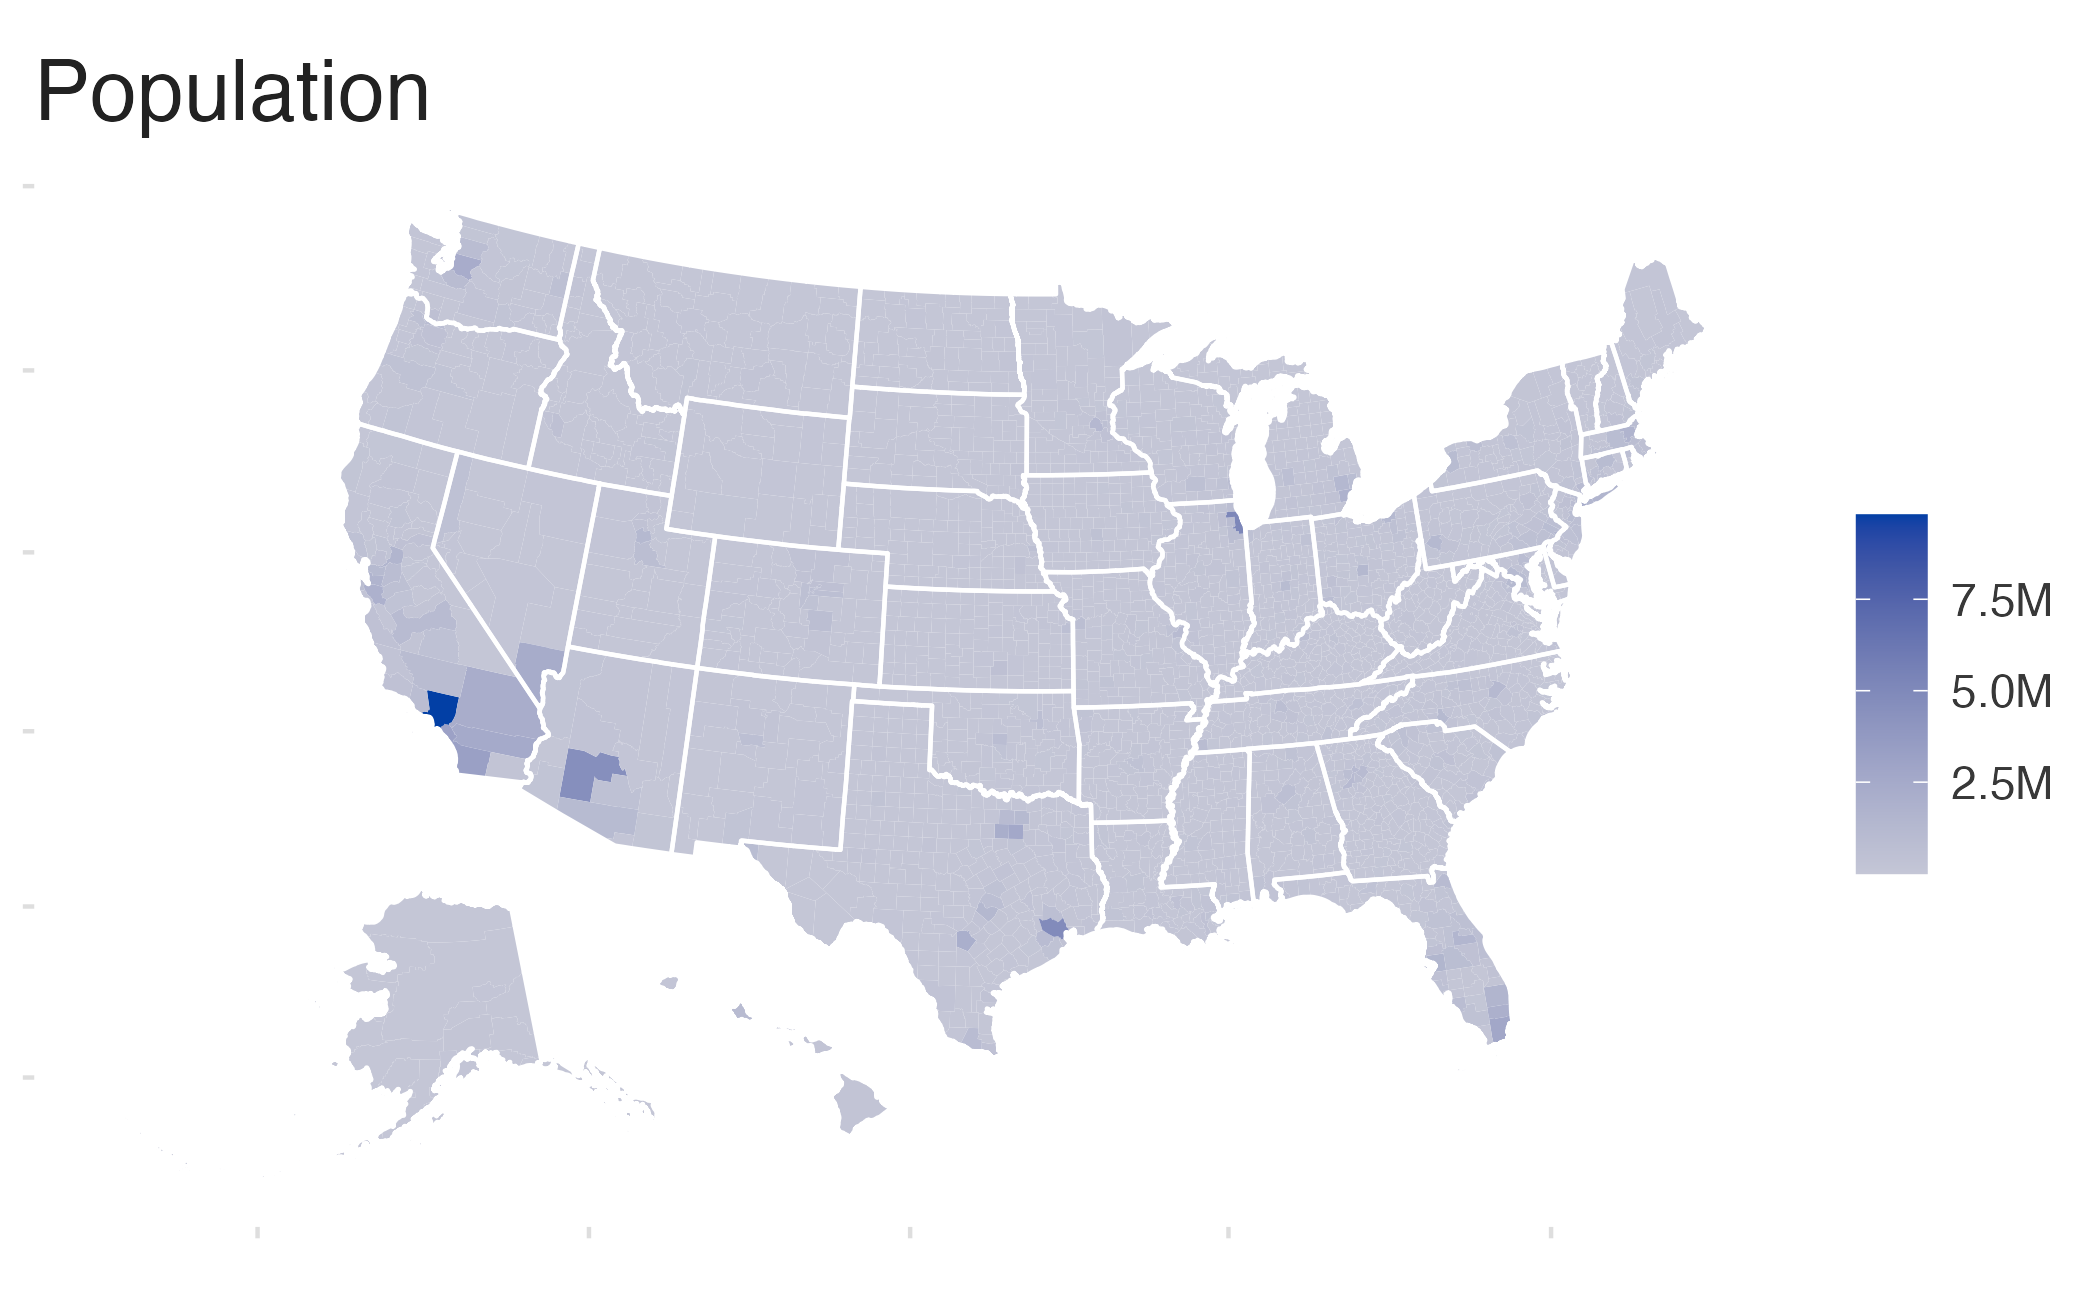
Population in the United States
Adjusted for population
Scatterplot
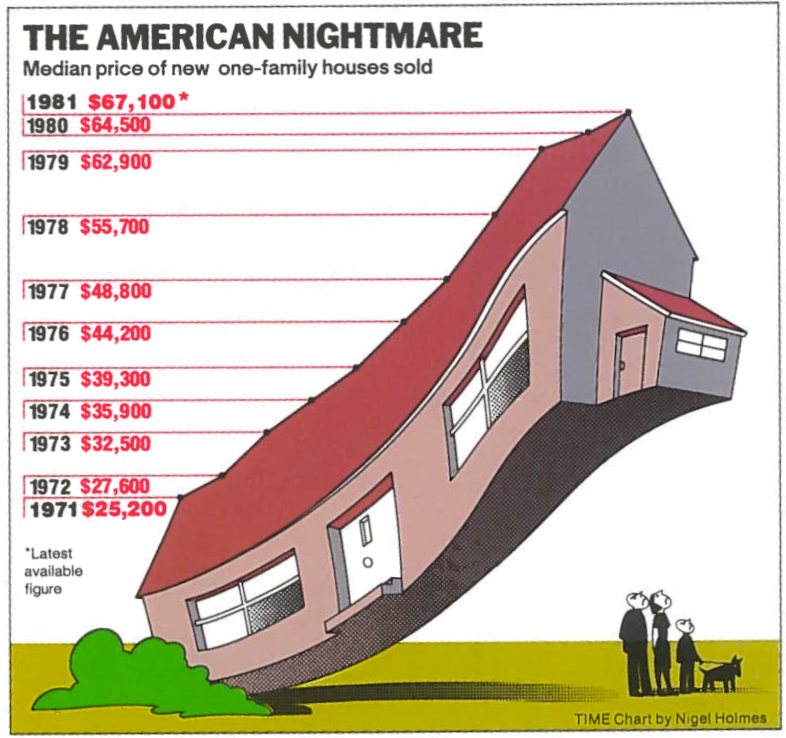
Beauty is in the eye of the beholder
Beauty is in the eye of the beholder

Beauty is in the eye of the beholder
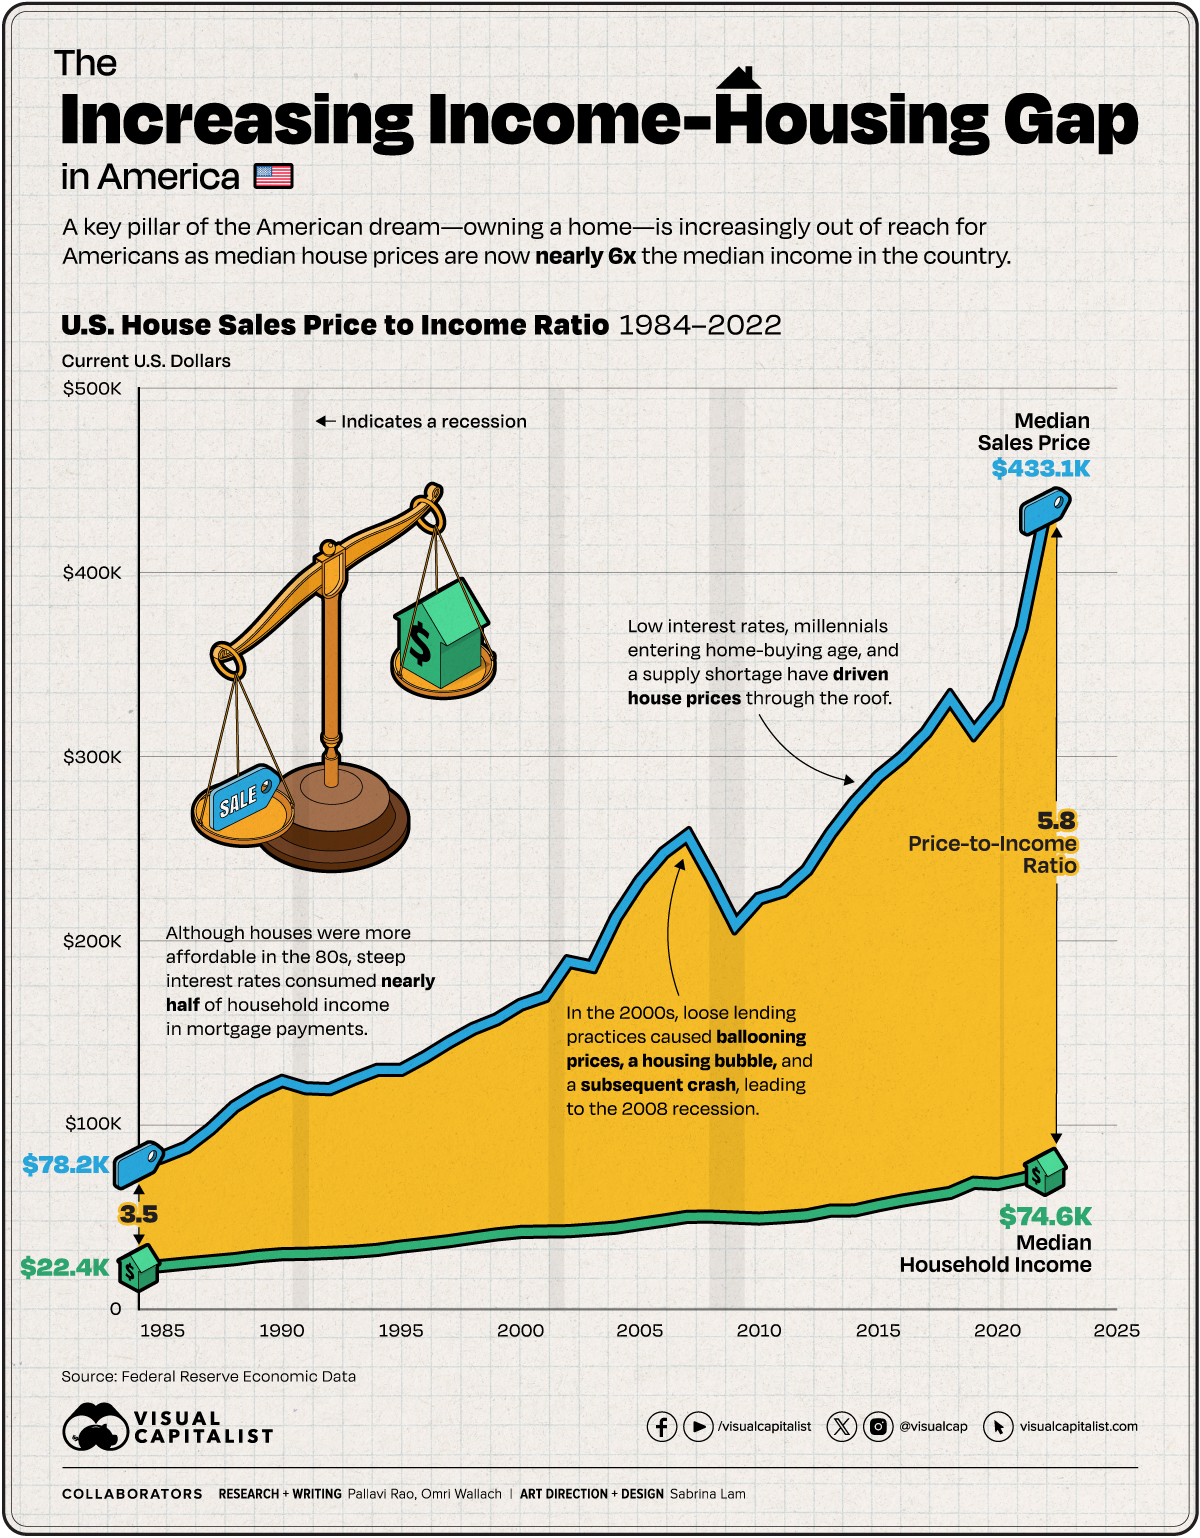
Beauty is in the eye of the beholder

Not insightful
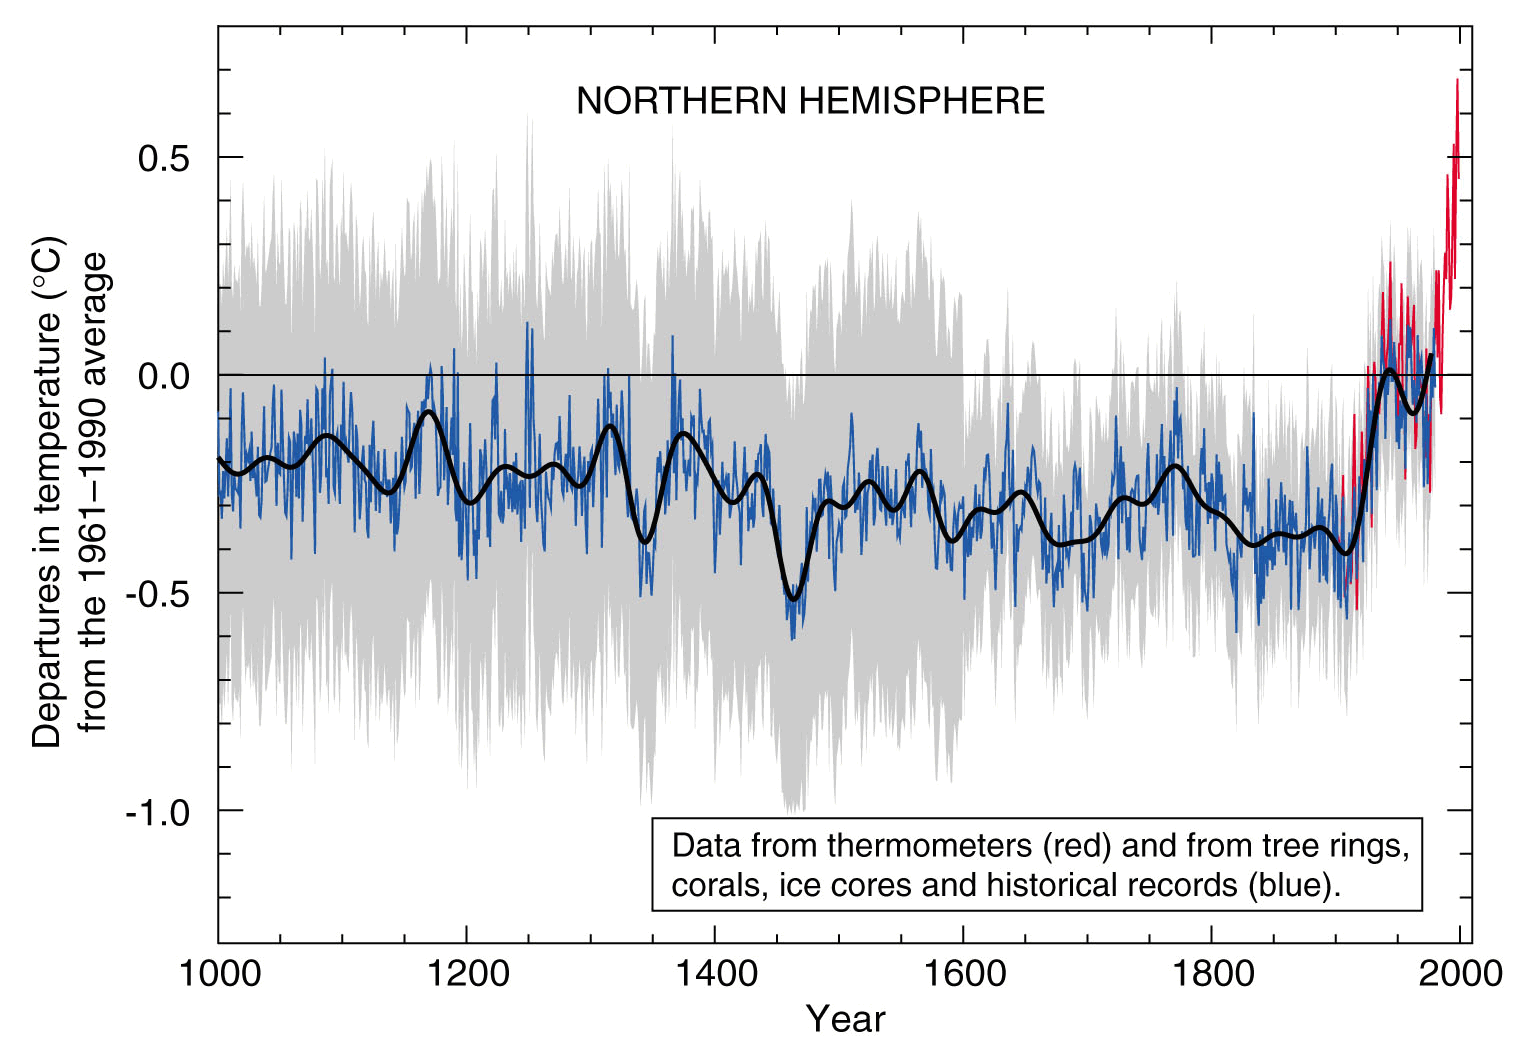
Hockey stick chart
Warming stripes

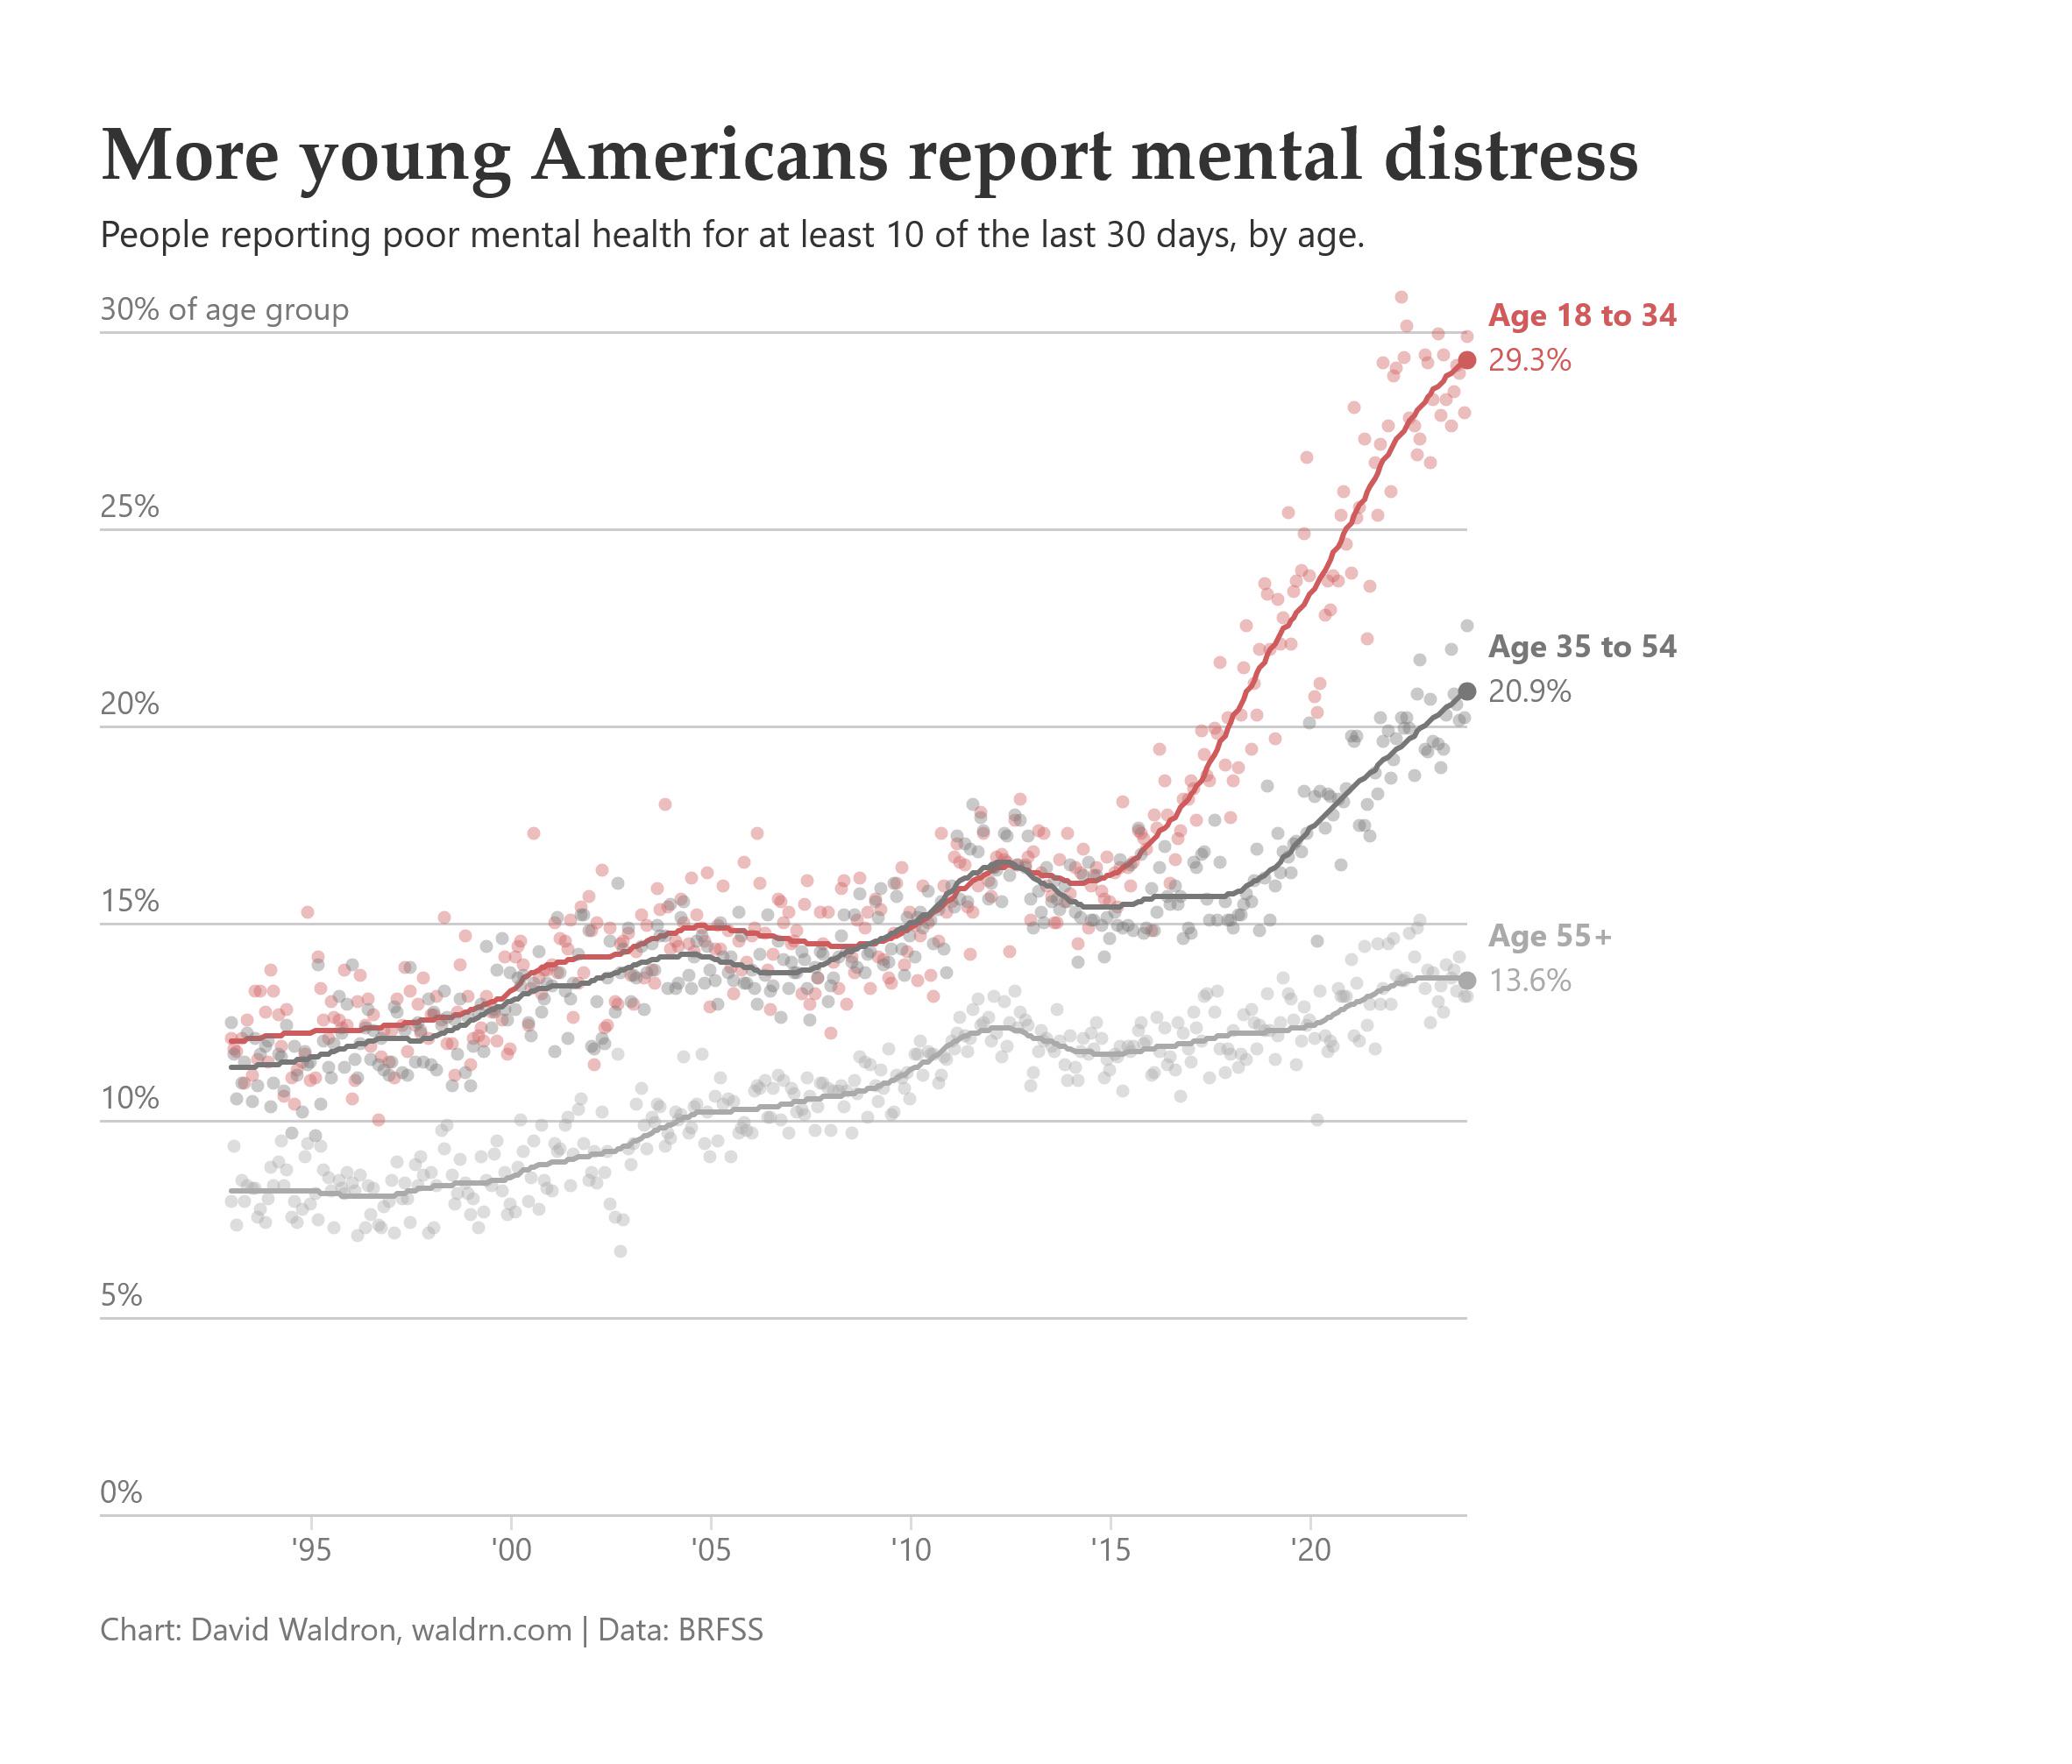
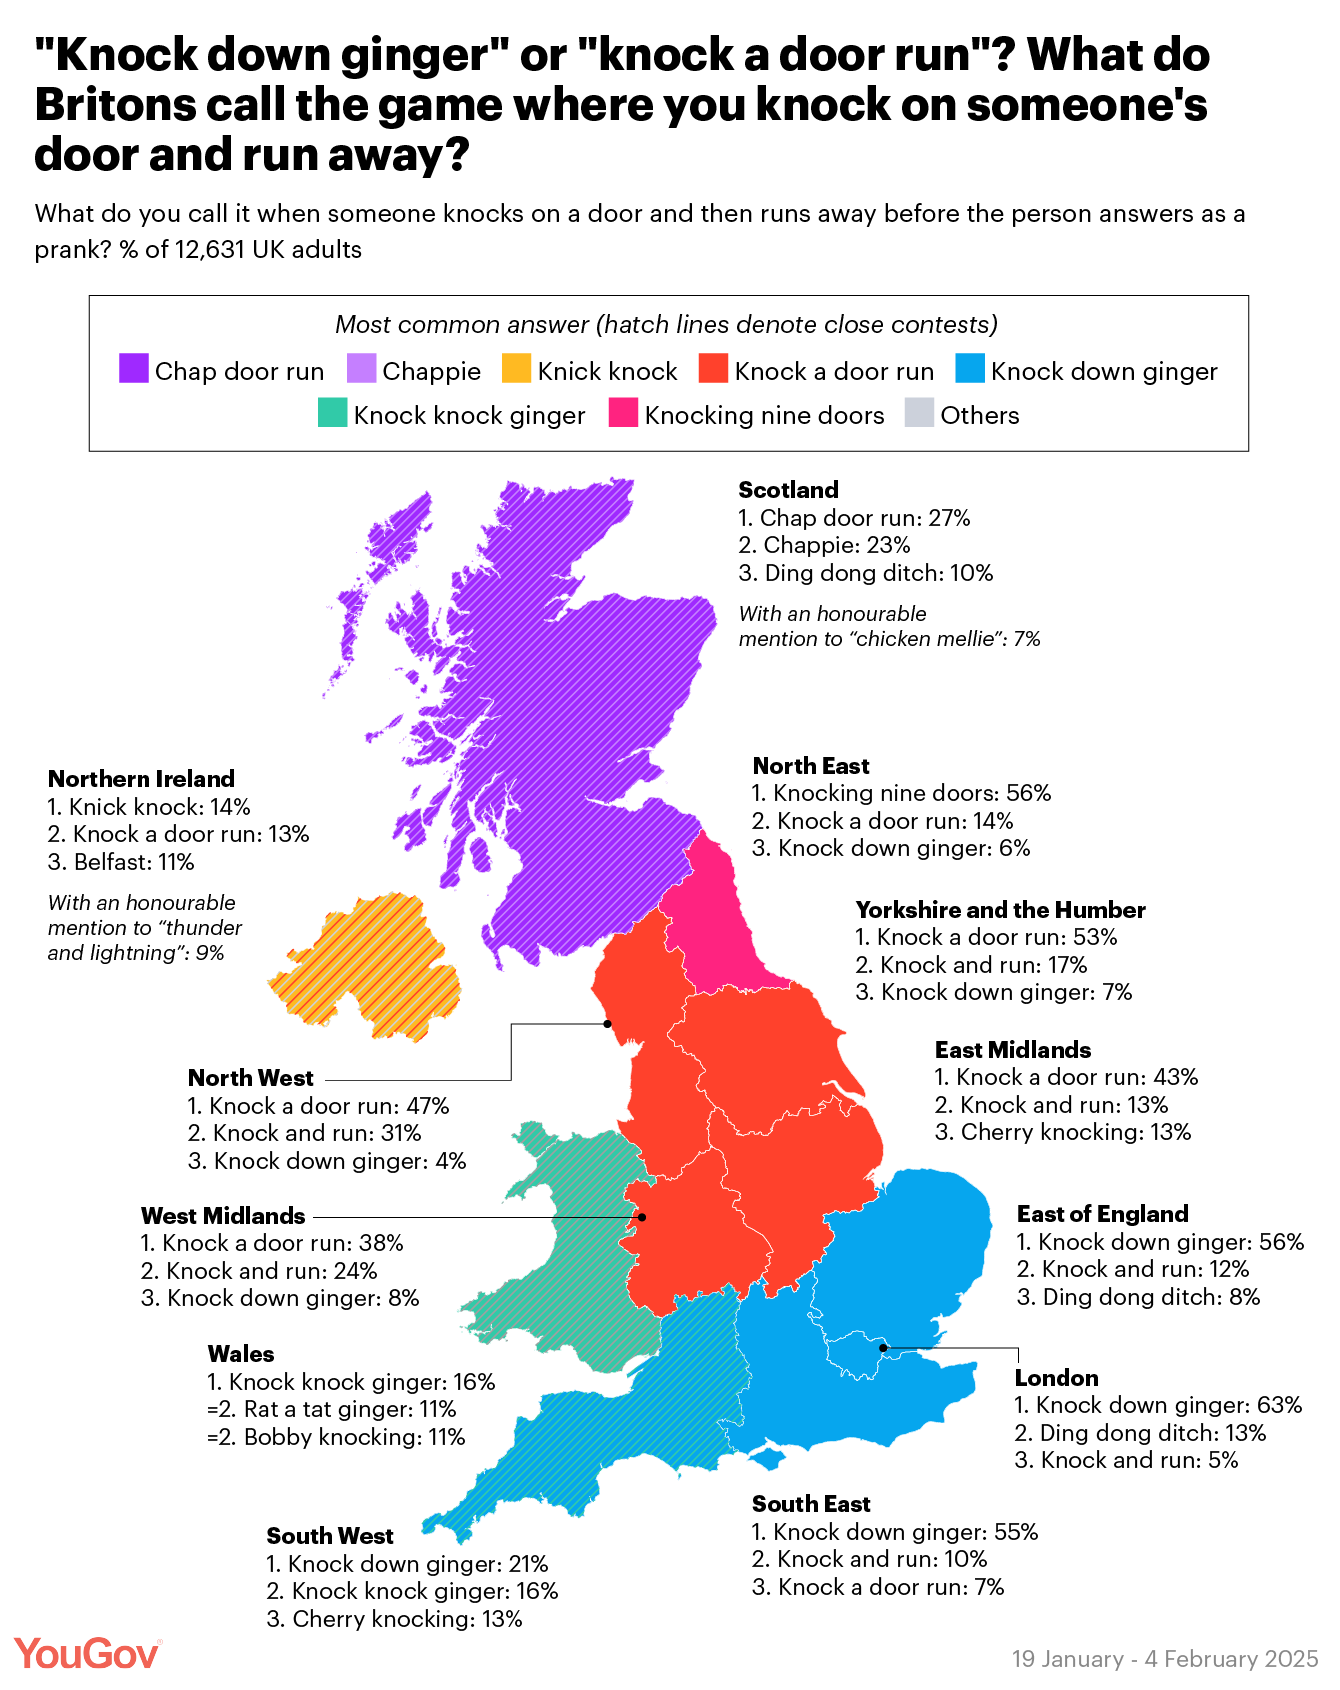
Critique a visualization