Wrap-up: Where to go from here
Lecture 25
Dr. Benjamin Soltoff
Cornell University
INFO 3312/5312 - Spring 2026
May 5, 2026
End-of-semester logistics
Remaining assignments
Build a simple data science stack

![]()
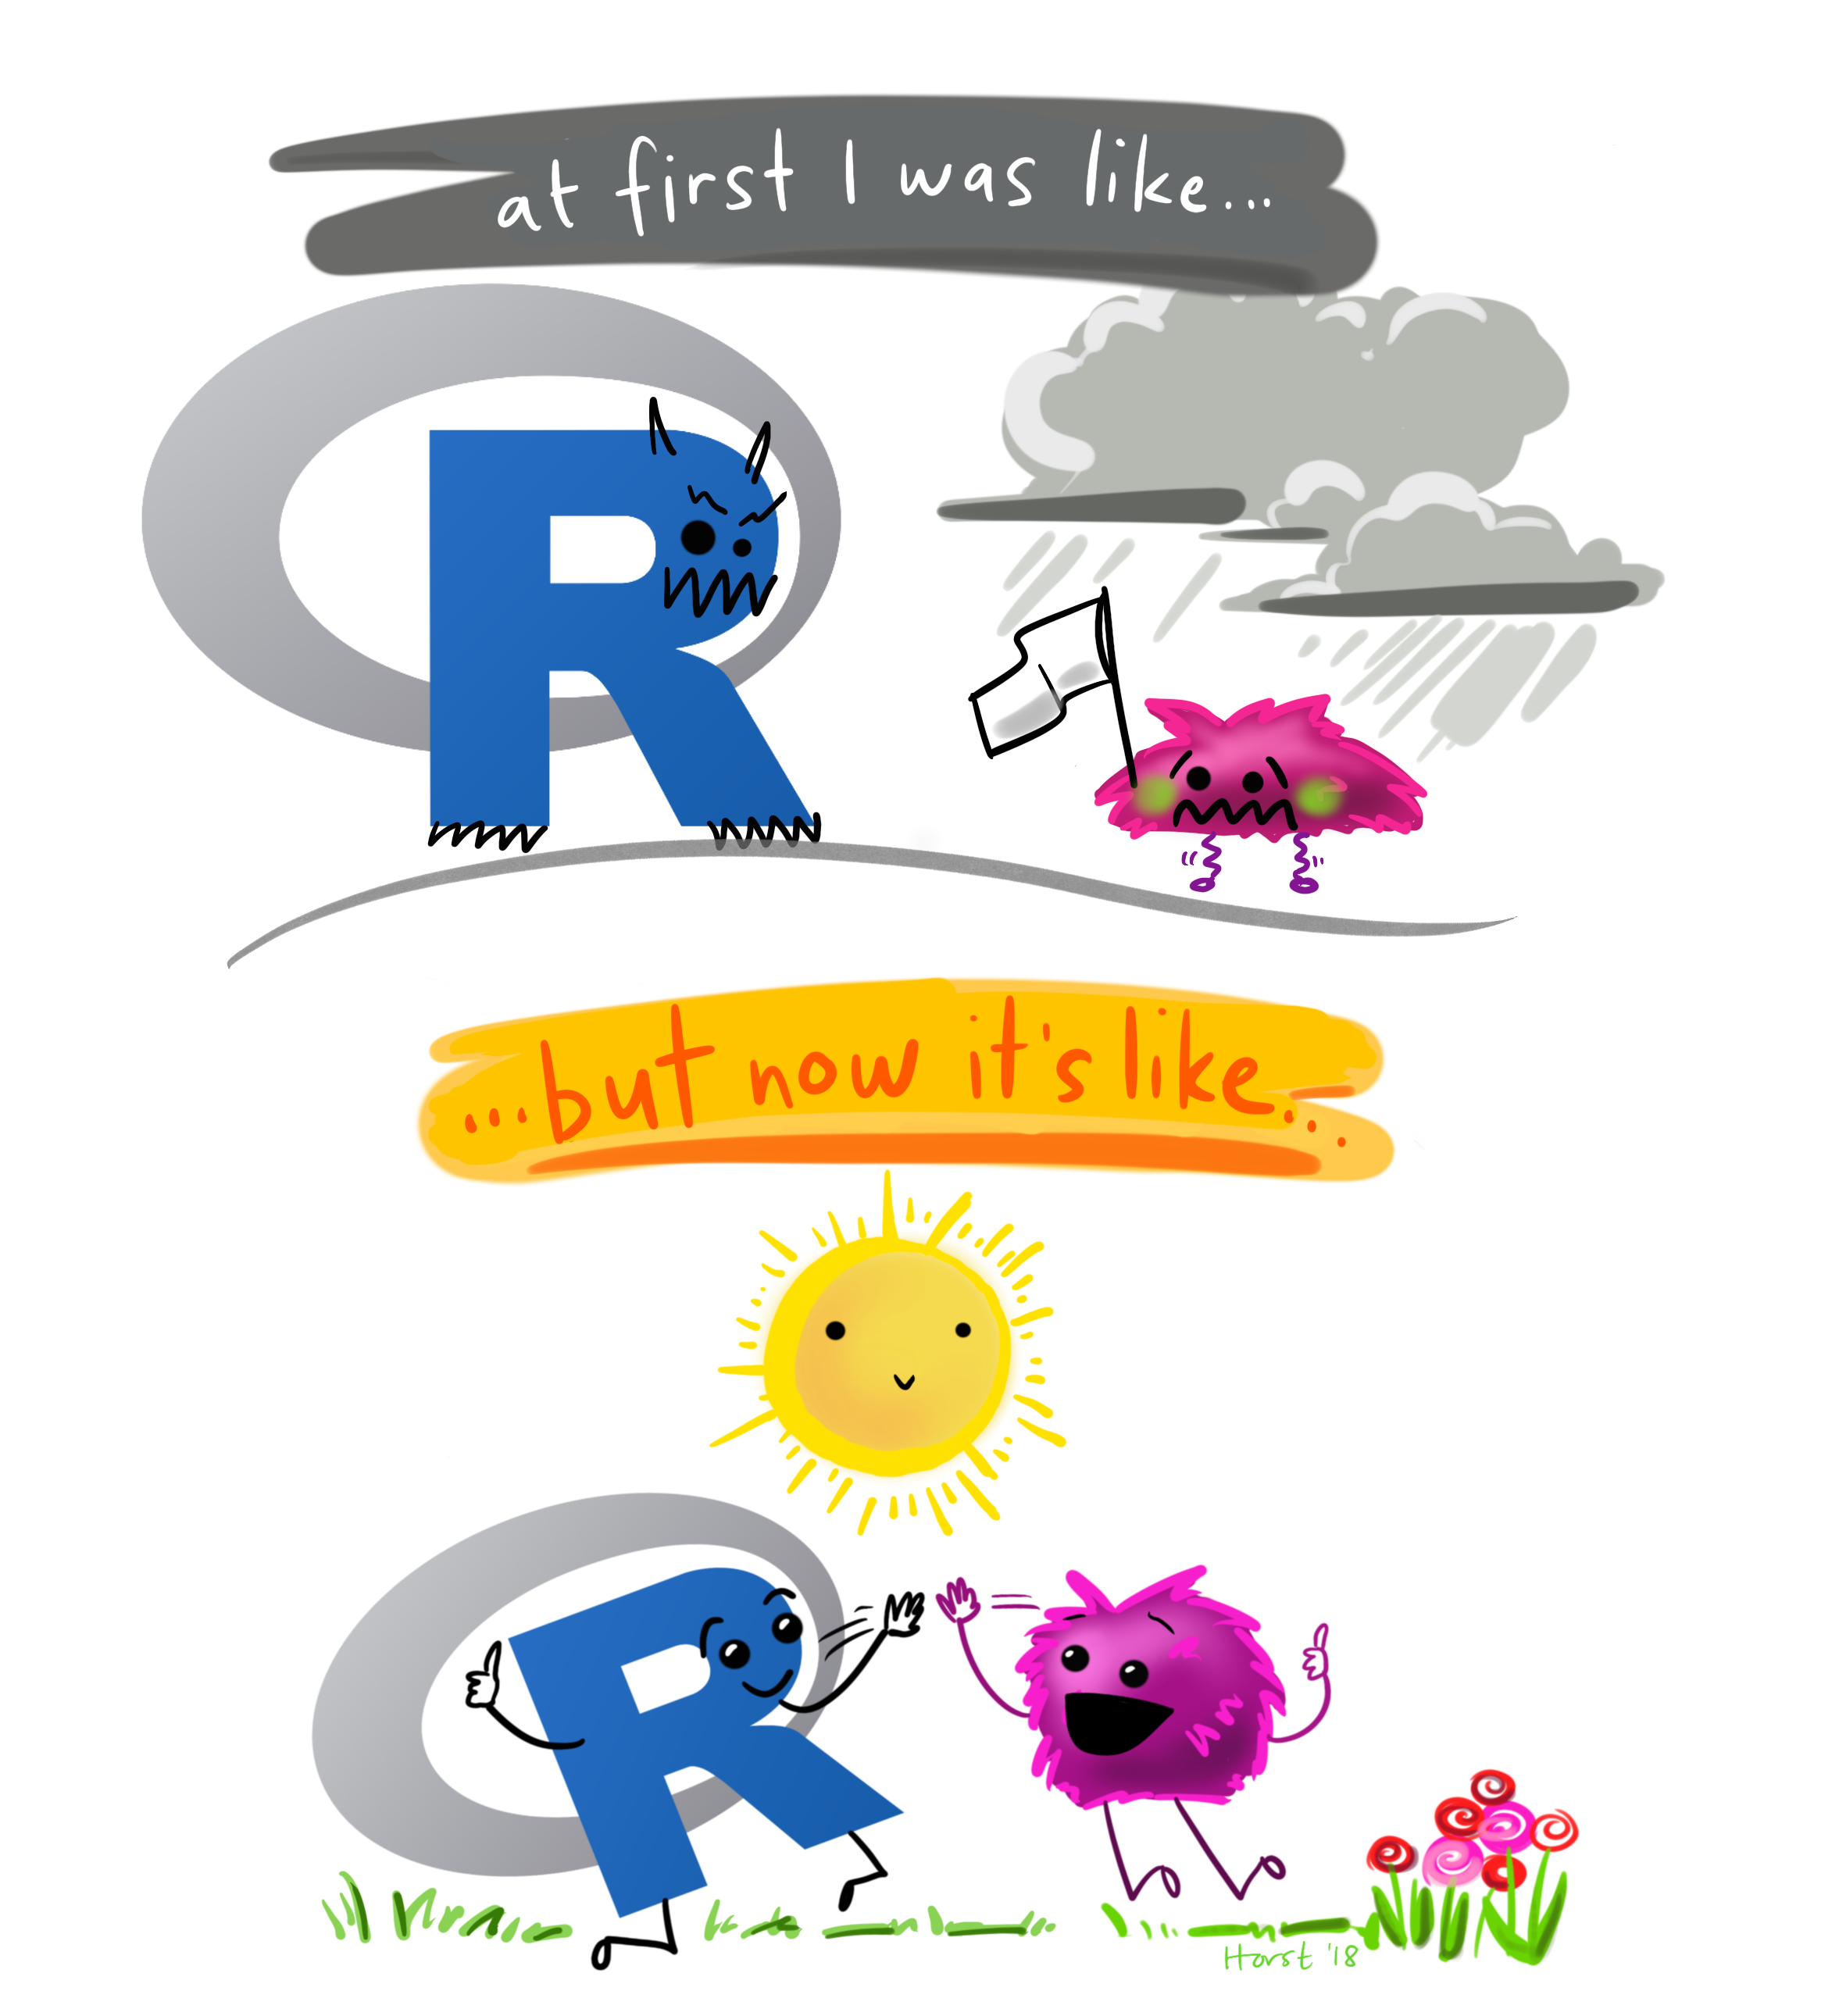
Image credit: Artwork by @allison_horst
Posit Workbench
- Access to Posit Workbench will end at some point after May 17th
- All INFO 3312/5312 materials remain available in your repos on GitHub as long as you are an active student
- Any other work you have done on the server will not be accessible after the end of the semester
- Where will you go from here?
Software installation
Programming language
{renv}
To {renv} or not to {renv}
Benefits
- Isolated
- Portable
- Reproducible
Drawbacks
- It’s a pain to configure for every project
- Some packages have issues installing via {renv}
Install some core R packages
Create a GitHub account
Configure Git
Painless authentication with PAT
Personal Access Token
- Uses HTTPS protocol
- Integrates with the {usethis} package to automate some Git workflows
- Alternative: use SSH
More info: Happy Git and GitHub for the useR
Setup PAT authentication
Create PAT
Store PAT
Create PAT
Store PAT
What have you learned?
Learning objectives for INFO 3312/5312
- Implement principles of designing and creating effective data visualizations.
- Evaluate, critique, and improve upon one’s own and others’ data visualizations based on how good a job the visualization does for communicating a message clearly and correctly.
- Post-process and refine plots for effective communication.
- Master using R and a variety of modern data visualization packages to reproducibly create data visualizations.
- Work reproducibly individually and collaboratively using Git and GitHub.
What’s next?
Find a community

Image credit: Artwork by @allison_horst
Online communities
Keep your skills fresh
- Integrate reproducible workflows into other courses/projects
- Tidy Tuesday
- Create a blog

Presentations on Wednesday the 13th!
