Dashboards
Lecture 21
Cornell University
INFO 3312/5312 - Spring 2026
April 14, 2026
Announcements
Announcements
- Homework 05
The Big Mac Index
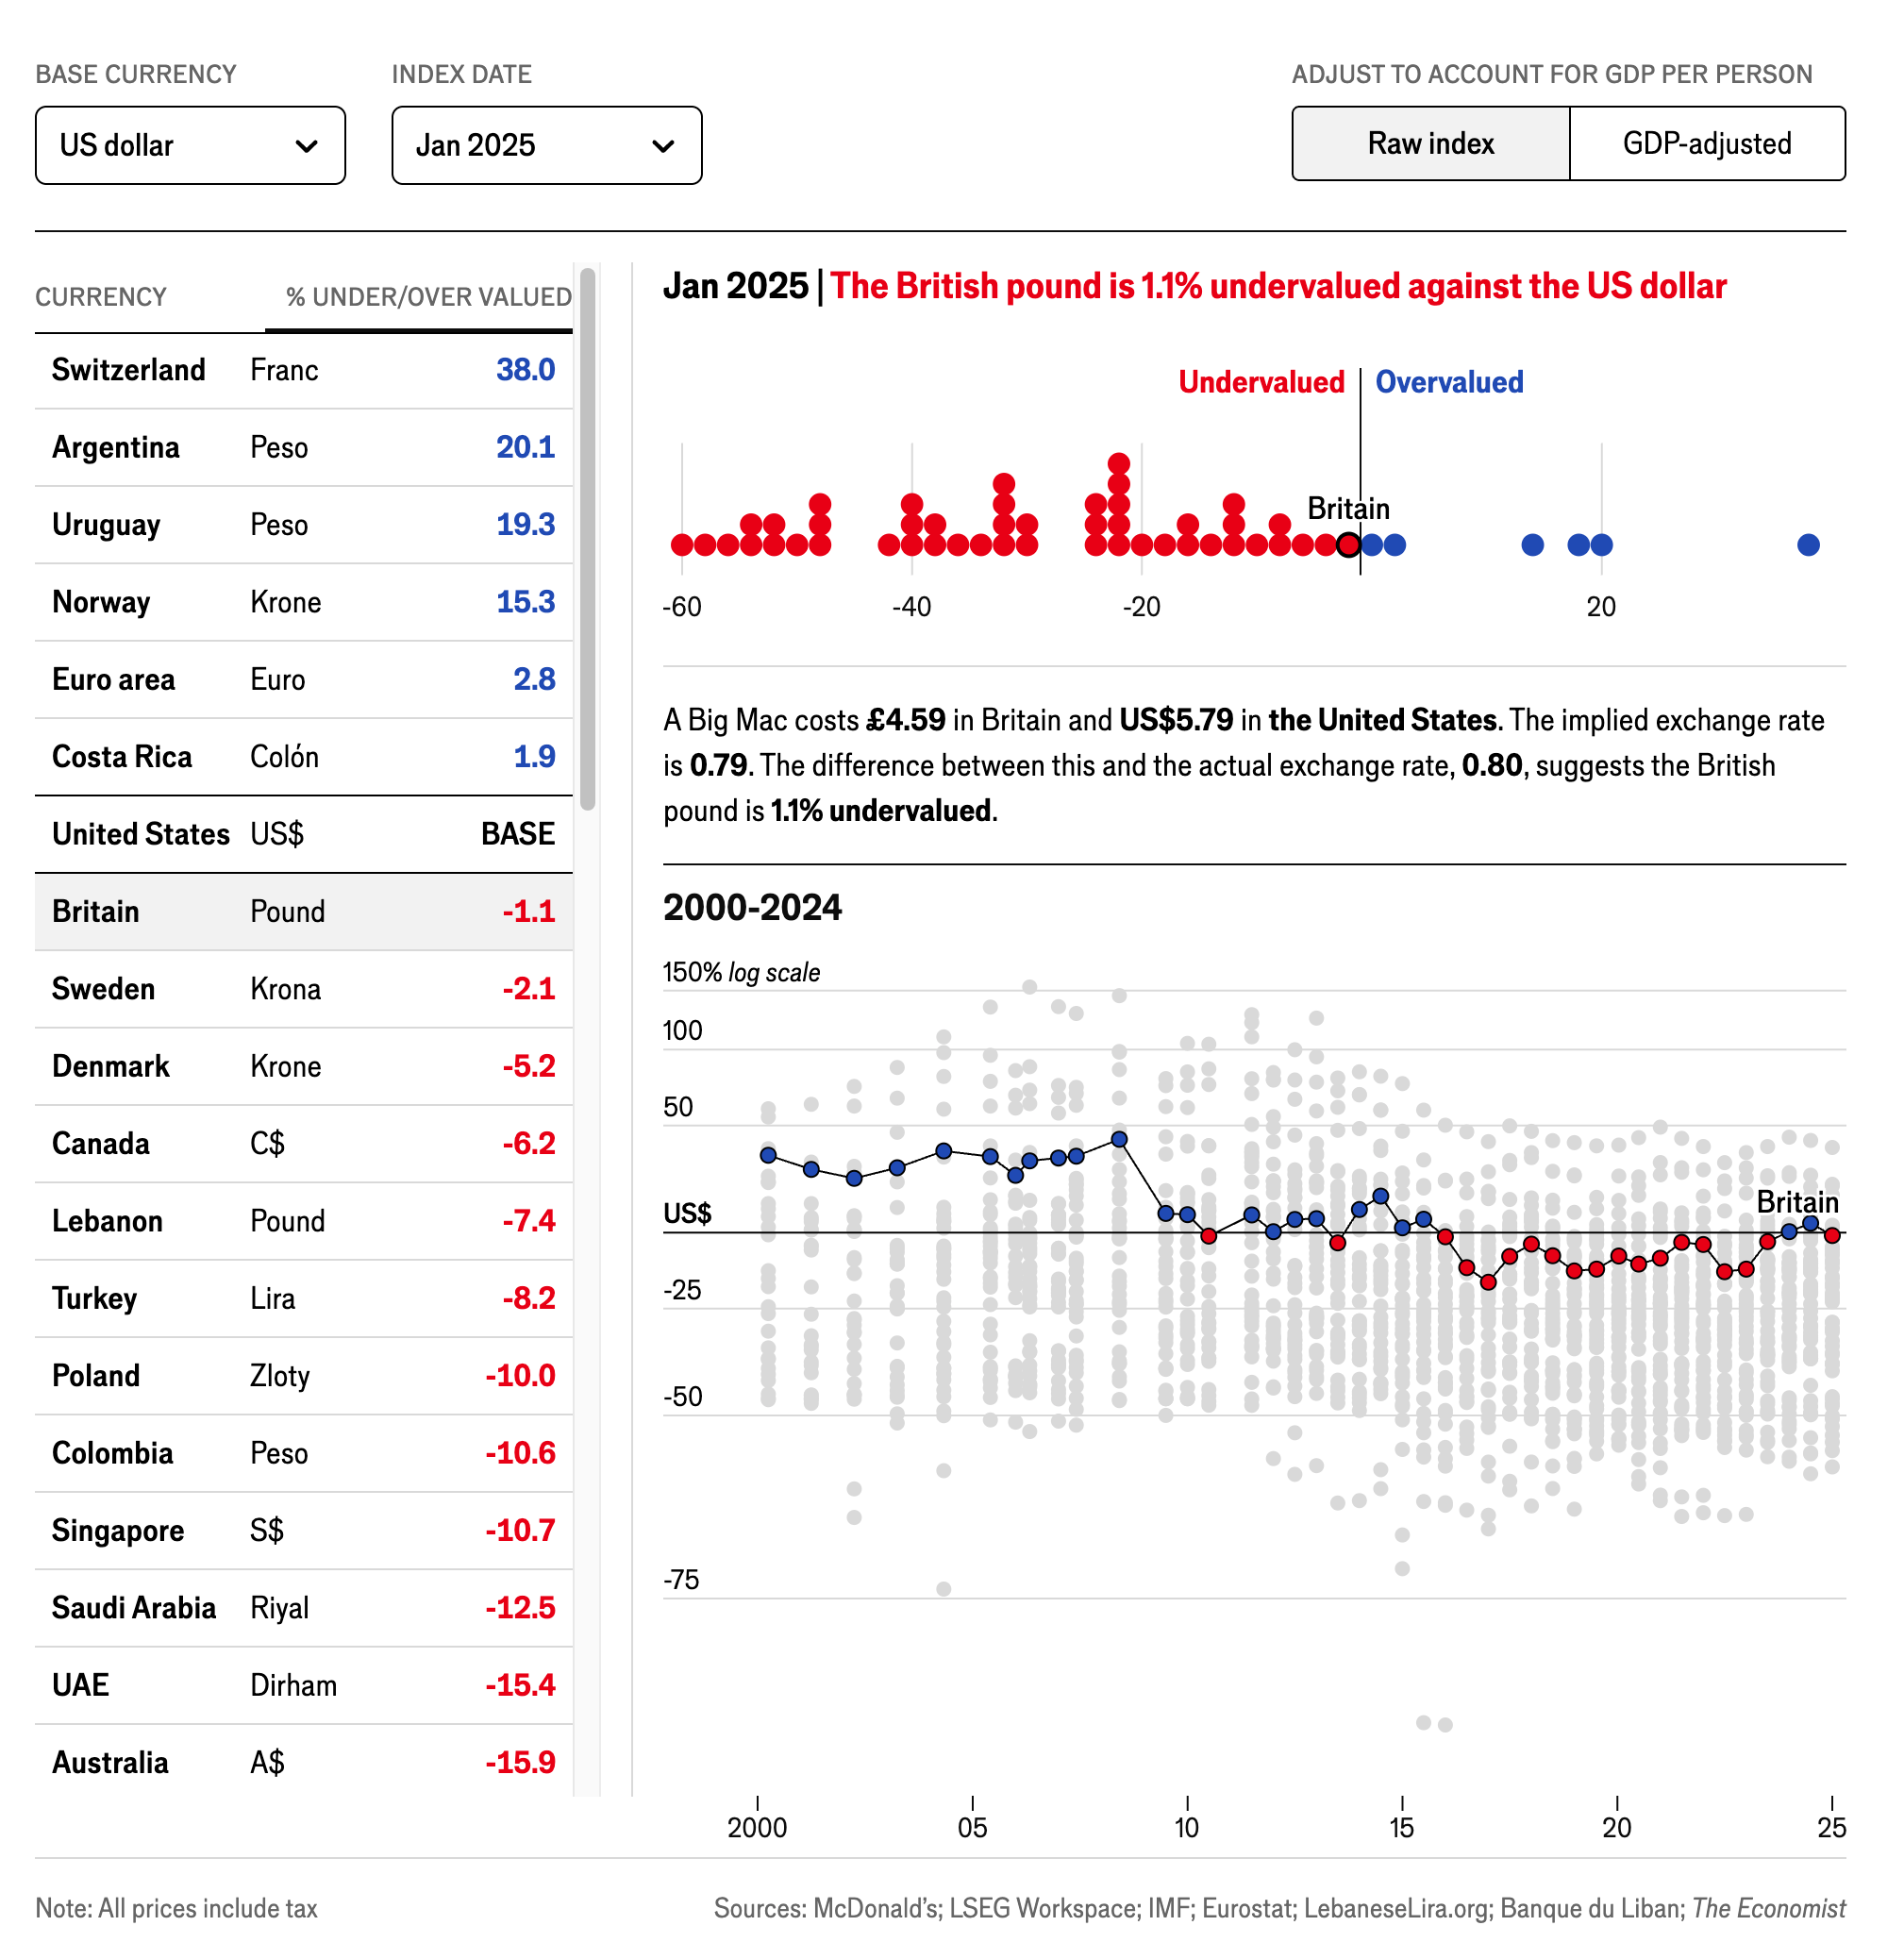
- What is the topic of this dashboard?
- How does the dashboard present information? What kinds of techniques does it use?
Source: The Economist
Learning objectives
- Define dashboards for data communication
- Evaluate the effectiveness of dashboards for communicating data
- Distinguish between client-side and server-side interactivity
- Create and revise Quarto dashboards
Communicating interactively with data
- Interactive charts
- Scrollytelling
- Dashboards
- Interactive web applications
Dashboards
What is a dashboard?
A dashboard is a visual display of data used to monitor conditions and/or facilitate understanding.
- Collection of related data points
- Information presented in a single view
- Uses a range of methods for data communication (charts, tables, text, etc.)
- Can be static or interactive
Source: The Big Book of Dashboards
Interactivity in dashboards
Client-side interactivity
Application code is executed in the browser
- All elements/components must be defined in HTML/CSS/JavaScript
- Interactivity is rendered within the browser
- Limited computational power
- Can be published as a static webpage
- Examples
- {ggiraph}
- {leaflet}
- Interactive {gt} tables
- {htmlwidgets}
Server-side interactivity
Application code is executed on the server
- Content can be generated dynamically in response to user input
- Allows execution of R code on the server
- Requires a server to host the application (or specialized server-less deployment)
- Examples
- Input fields (toggle buttons, dropdown menus, search bars, etc.)
- Regenerated charts/tables
Dashboards with Quarto
Dashboards with Quarto
- Build dashboards using the Quarto framework
- Flexible row and column-based layouts
- Can include interactive/dynamic elements
- Use parameterized reporting to create static dashboards for different datasets
- Publish as a static web page or integrate with Shiny for server-side interactivity
Example dashboards
.qmd ➝ Dashboard
Dashboard Components
Navigation Bar and Pages — Icon, title, and author along with links to sub-pages (if more than one page is defined).
Sidebars, Rows & Columns, and Tabsets — Rows and columns using Markdown heading (with optional attributes to control height, width, etc.). Sidebars for interactive inputs. Tabsets to further divide content.
Cards (Plots, Tables, Value Boxes, Content) — Cards are containers for cell outputs and free form Markdown text. The content of cards typically maps to cells in your notebook or source document.
Why not use Tableau/PowerBi?
- Closed-source proprietary software
- Use point-and-click interface to construct dashboards (limited programming)
- Limited customization and flexibility
Application exercise
ae-20
Instructions
- Go to the course GitHub org and find your
ae-20(repo name will be suffixed with your GitHub name). - Clone the repo in Positron, run
renv::restore()to install the required packages, open the Quarto document in the repo, and follow along and complete the exercises. - Render, commit, and push your edits by the AE deadline – end of the day
Wrap-up
Recap
- Dashboards provide a compact, comprehensive communication of related data points
- Avoid overwhelming readers with unnecessary or confusing information
- Leverage interactivity to provide additional information on an as-needed basis
- Use Quarto to create dashboards that can be published as static web pages
