Interactive reporting with Shiny (II)
Lecture 20
April 11, 2024
Navigation Bar and Pages

Sidebars: Page Level
Sidebars: Global
Layout: Rows
Layout: Columns

Tabset
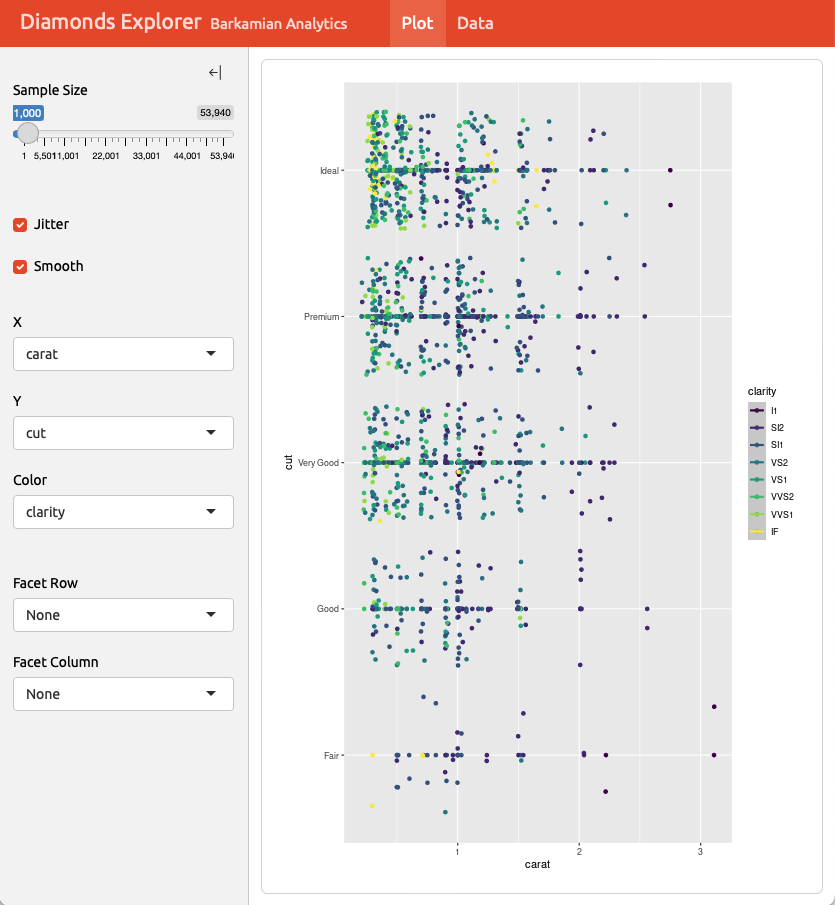
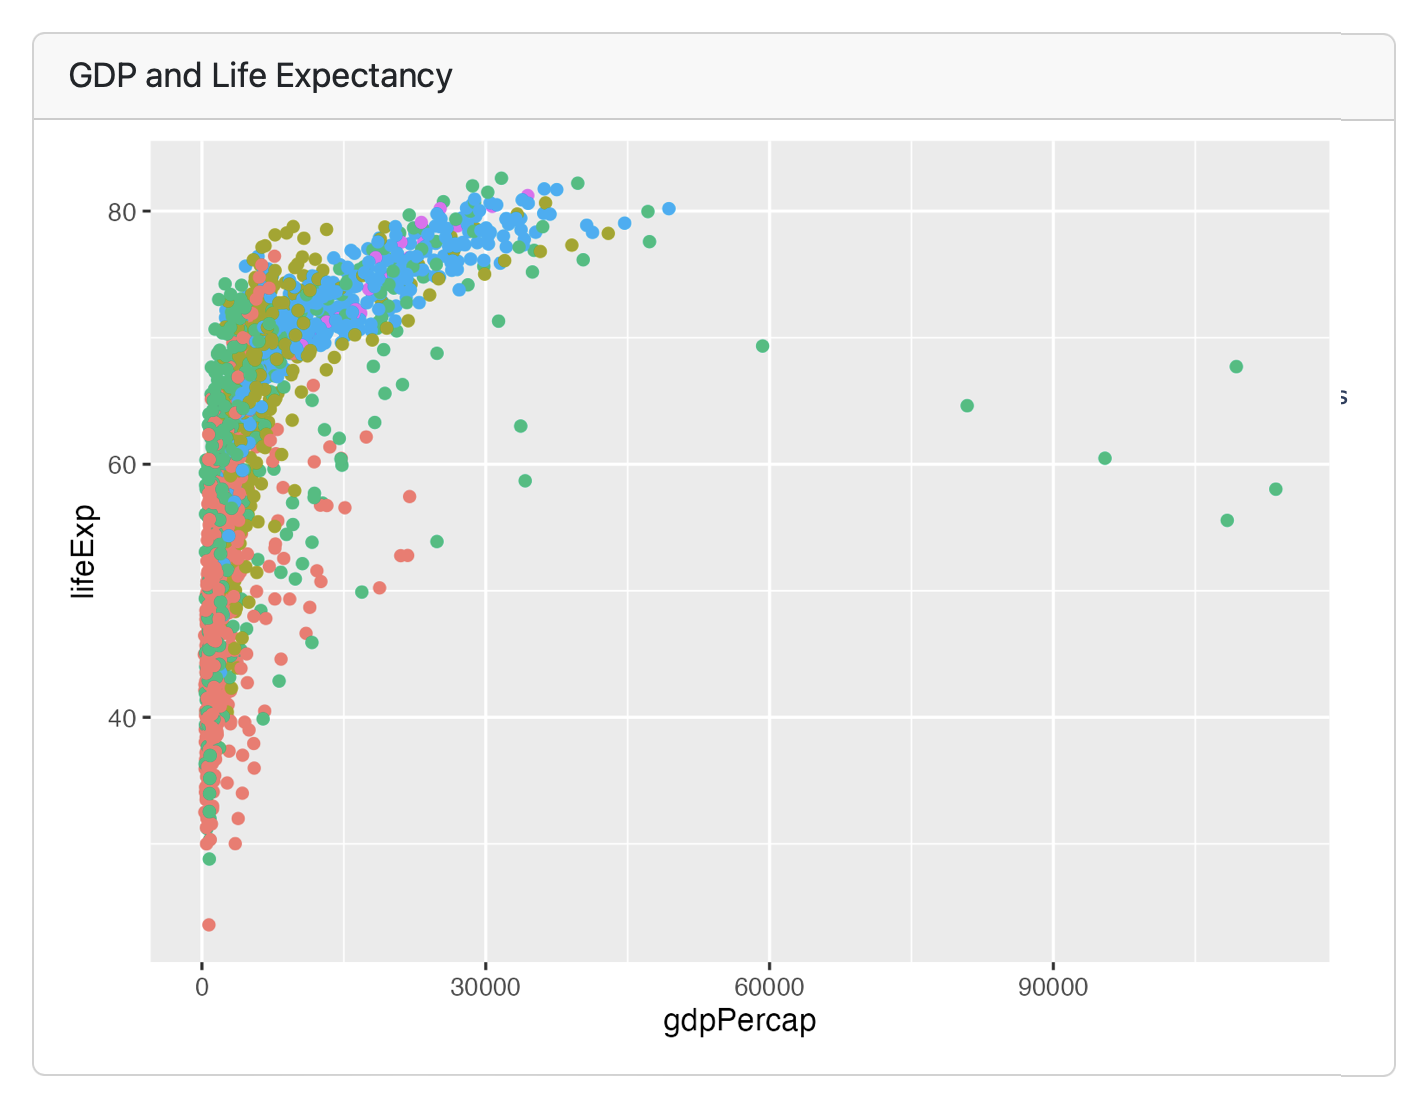
Plots
Each code chunk makes a card, and can take a title
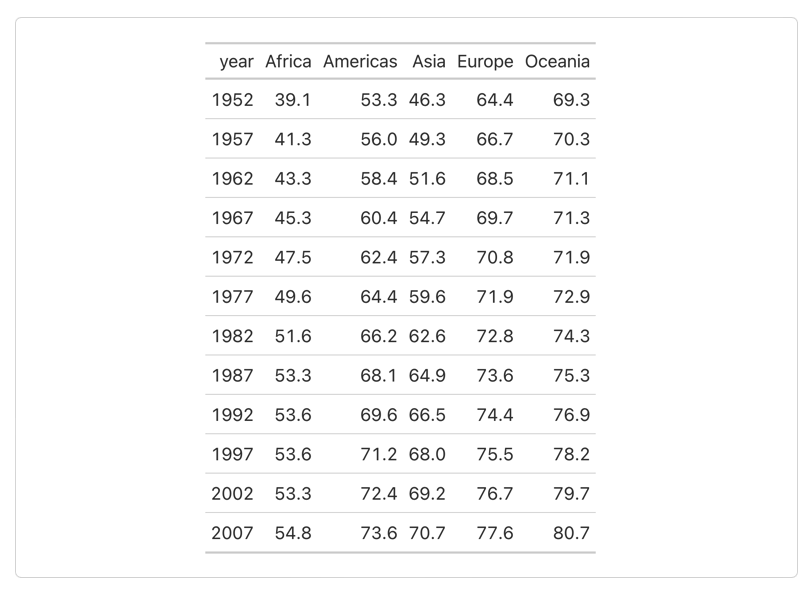
Tables
Each code chunk makes a card, doesn’t have to have a title