
Interactive reporting with Shiny (I)
Lecture 19
Dr. Benjamin Soltoff
Cornell University
INFO 3312/5312 - Spring 2025
April 9, 2024
Announcements
Announcements
- Friday labs canceled - group meetings with me instead for project feedback
- Revised project proposals due Wednesday at 11:59pm
Goals
- Introduce Shiny for interactive web applications
- Review implementation of basic Shiny app
- Develop user interfaces with Shiny
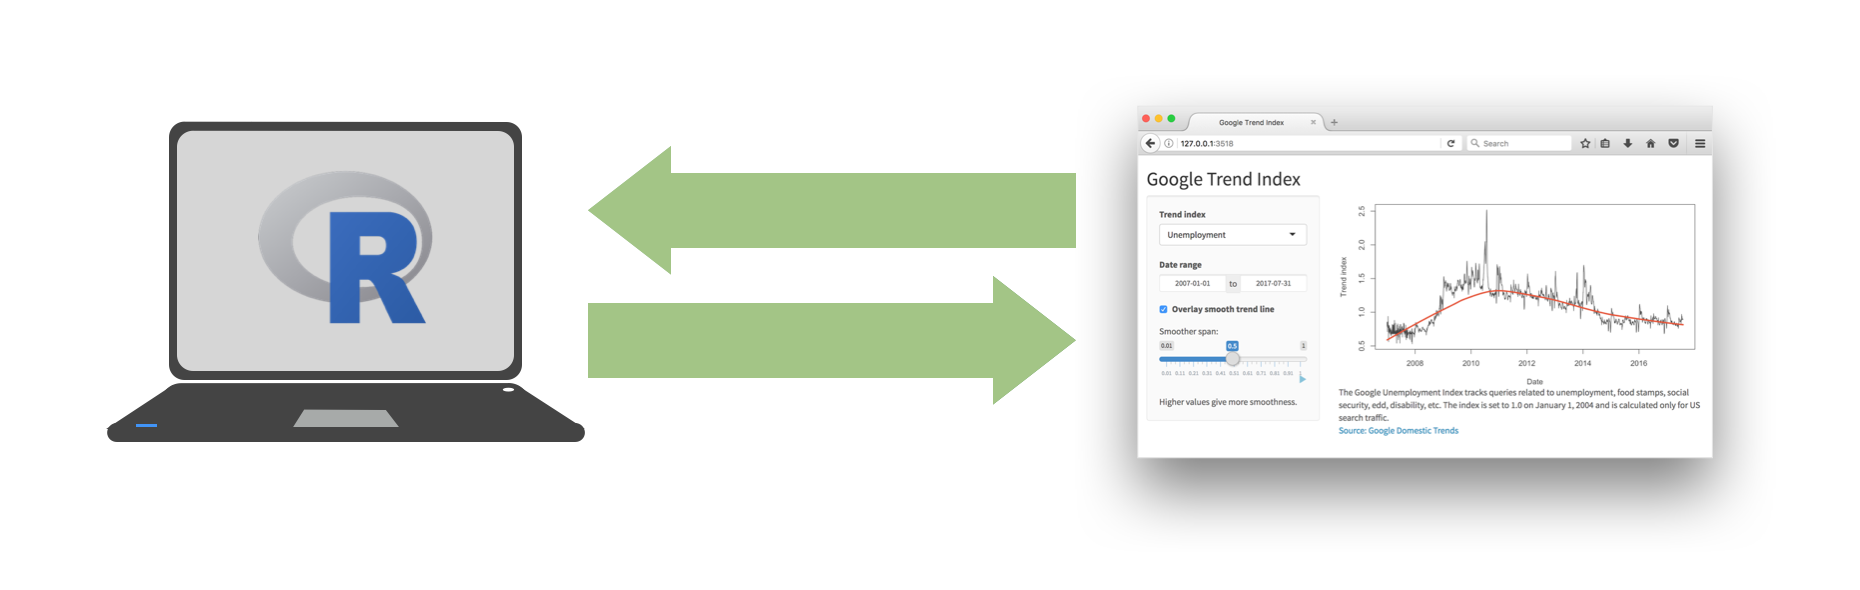
Shiny: High level view
Every Shiny app has a webpage that the user visits,
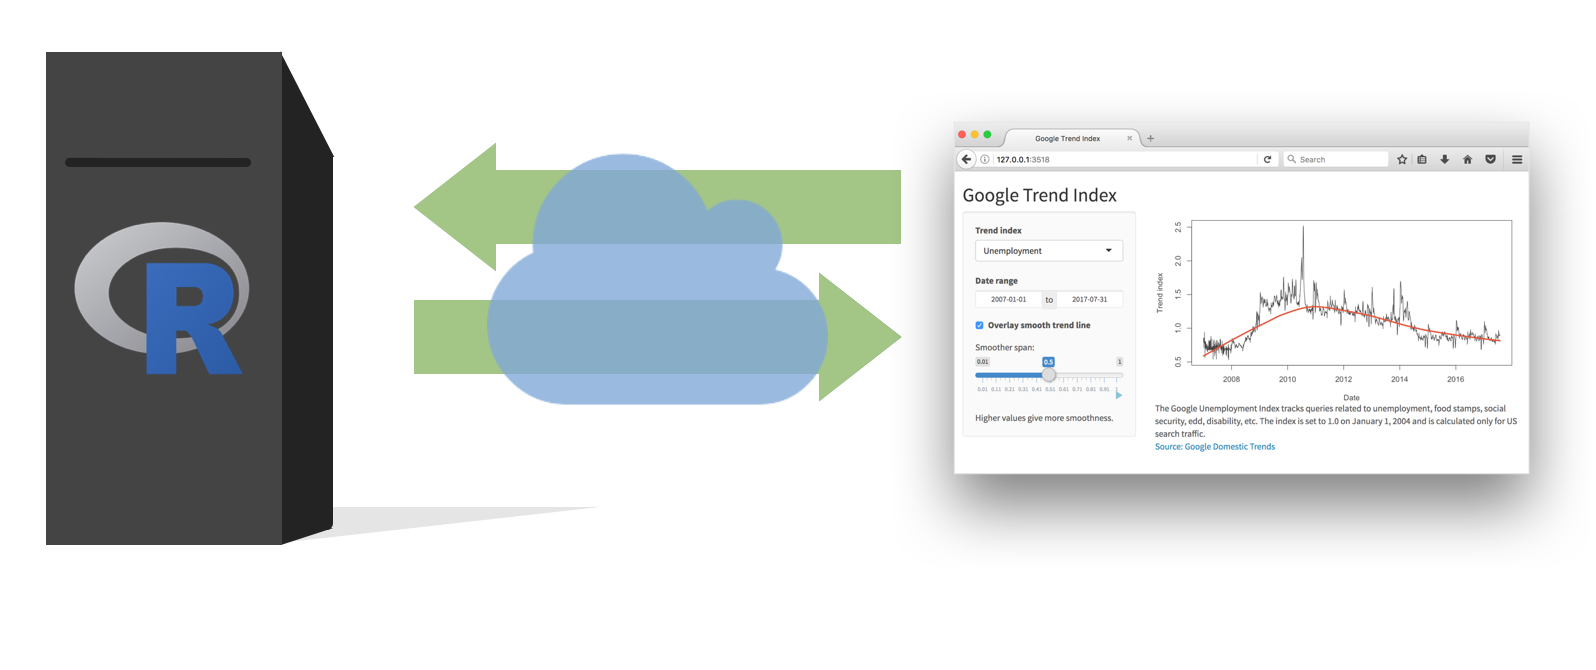
and behind this webpage there is a computer that serves this webpage by running R (or Python!).
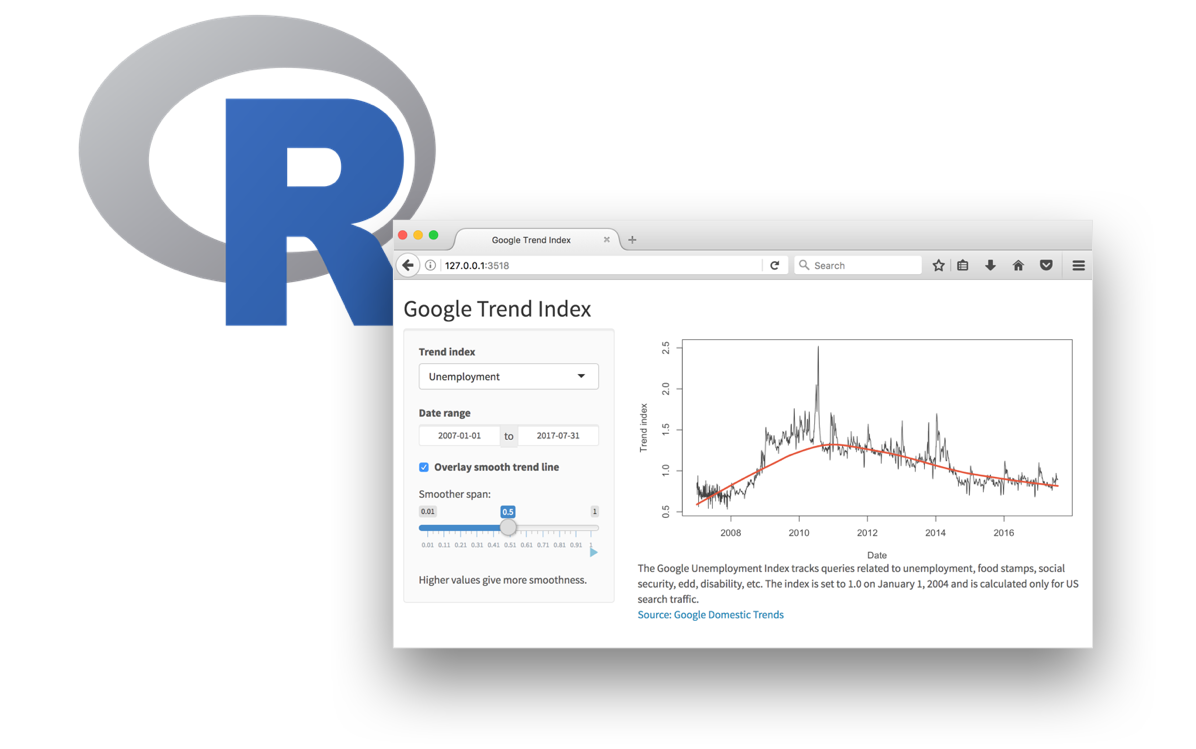
When running your app locally, the computer serving your app is your computer.
When your app is deployed, the computer serving your app is a web server.
Dating rules
Age gaps

Dating rules
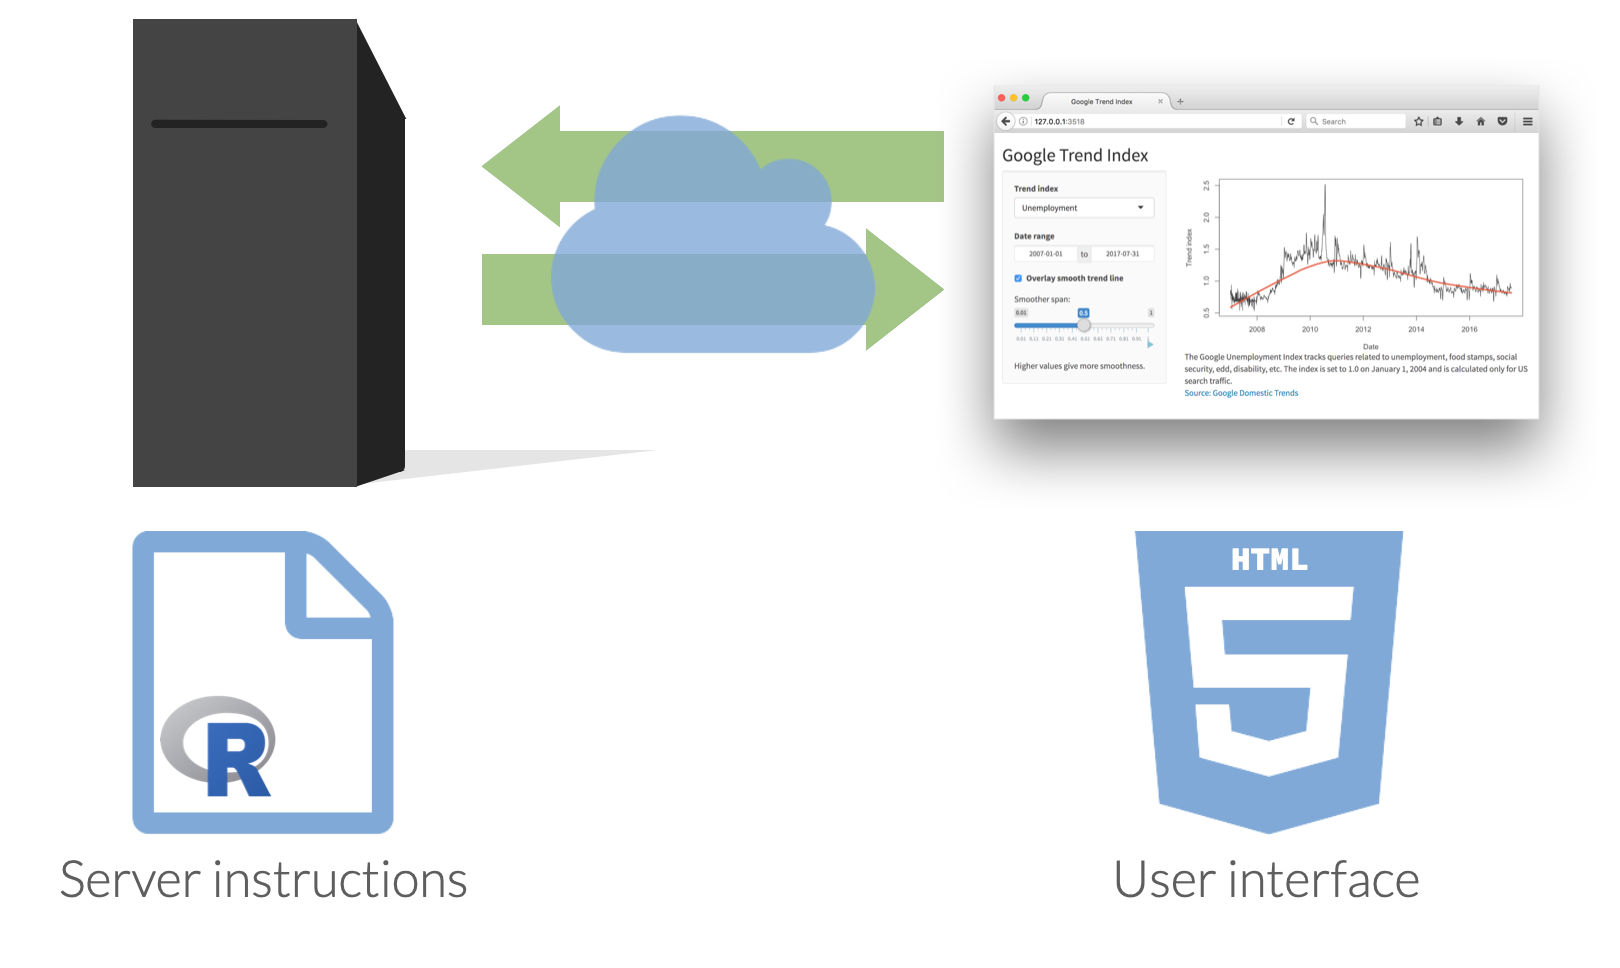
Anatomy of a Shiny app
What’s in an app?
Inputs and outputs
- For interactivity, app needs inputs and outputs
- Inputs - things user can toggle/adjust
- Output - R objects user can see, often depend on inputs
Inputs
Inputs
<div class="form-group shiny-input-container">
  <label class="control-label" id="num-label" for="num">Choose a number</label>
  <input class="js-range-slider" id="num" data-skin="shiny" data-min="0" data-max="100" data-from="20" data-step="1" data-grid="true" data-grid-num="10" data-grid-snap="false" data-prettify-separator="," data-prettify-enabled="true" data-keyboard="true" data-data-type="number"/>
</div>
Inputs

Inputs
Outputs
| Function | Outputs |
|---|---|
plotOutput() |
plot |
tableOutput() |
table |
uiOutput() |
Shiny UI element |
textOutput() |
text |
- Plots, tables, text - anything that R creates and users see
- Initialize as empty placeholder space until object is created
Outputs
bslib
Modern UI toolkit for Shiny based on Bootstrap:
Creation of delightful and customizable Shiny dashboards with cards, value boxes, sidebars, etc.
Use of modern versions of Bootstrap and Bootswatch
Learn more at https://rstudio.github.io/bslib.
bslib
Shiny + Quarto
Any document can be a Shiny document
Include
runtime: shinyin YAML headerInclude a
context: serverchunk which replacesserver.R```r #| context: server ```
- Combine with Quarto dashboards for server-side interactivity
Application exercise
ae-16
- Go to the course GitHub org and find your
ae-16(repo name will be suffixed with your GitHub name). - Clone the repo in RStudio Workbench, open the Quarto document in the repo, and follow along and complete the exercises.
Age rule app
- Navigate to the
age-rulefolder, and launch the app by opening theapp.Rfile and clicking on Run App. - Close the app by clicking the stop icon
Exploring the impact of climate change
National Risk Index
- National Risk Index (NRI) assesses natural hazard risk in the United States
- FEMA map
- Design a Shiny + Quarto dashboard
Wrap-up
Wrap-up
- Shiny apps are interactive web applications built using R or Python
- Use server-side rendering to dynamically generate content
- Design a user interface with inputs and outputs
- Combine Shiny with Quarto for interactive documents/dashboards
Acknowledgements
- Some portion of slides derived from Advanced Data Visualization