Interactivity in charts
Lecture 17
Dr. Benjamin Soltoff
Cornell University
INFO 3312/5312 - Fall 2026
November 3, 2026
Announcements
Announcements
- Continue work on project 02
Learning objectives
- Introduce forms of interactivity for data visualizations
- Identify core interactivity techniques
- Critique interactivity in data visualizations
- Implement interactive charts using {ggiraph}
Interactive data visualization
Forms of interactivity
Overview first, zoom and filter, then details on demand
- Present the most important figures or most relevant points to the audience
- Allow readers to dig into the information, explore, and come up with their own stories
Interactivity techniques
Storytelling form
- Linear
- Nonlinear
Interaction techniques
- Scroll and pan
- Zoom
- Open and close
- Sort and rearrange
- Search and filter
Examples of interactive graphics
Instructions
Pick one example below. Which interaction techniques does it use? What does the interactivity add that a static chart could not?
04:00
Interactive charts with {ggiraph}
Interactive charts with {ggiraph}
- {ggiraph} makes {ggplot2} graphics interactive
- Keep familiar {ggplot2} structure while adding hover labels and click behavior
girafe()renders an interactive widget from aggplot()object
Basic {ggiraph} example
Basic {ggiraph} example
Custom hover text
my_plot <- ggplot(
  data = gapminder_2007,
  mapping = aes(
    x = gdpPercap,
    y = lifeExp,
    color = continent
  )
) +
  geom_point_interactive(
    mapping = aes(
      tooltip = str_glue(
        "{country}<br>Life expectancy: {round(lifeExp, 1)}"
      ),
      data_id = country
    )
  ) +
  scale_x_log10() +
  theme_minimal()

girafe(ggobj = my_plot) |>
  girafe_options(
    opts_tooltip(
      use_fill = TRUE,
      css = "background-color: #f8f9fa; color: #111000;"
    )
  )
Custom hover text
Works with many geoms
Works with many geoms
Create a (basic) interactive chart with {ggplot2} and {ggiraph}
Get and clean data
Static chart
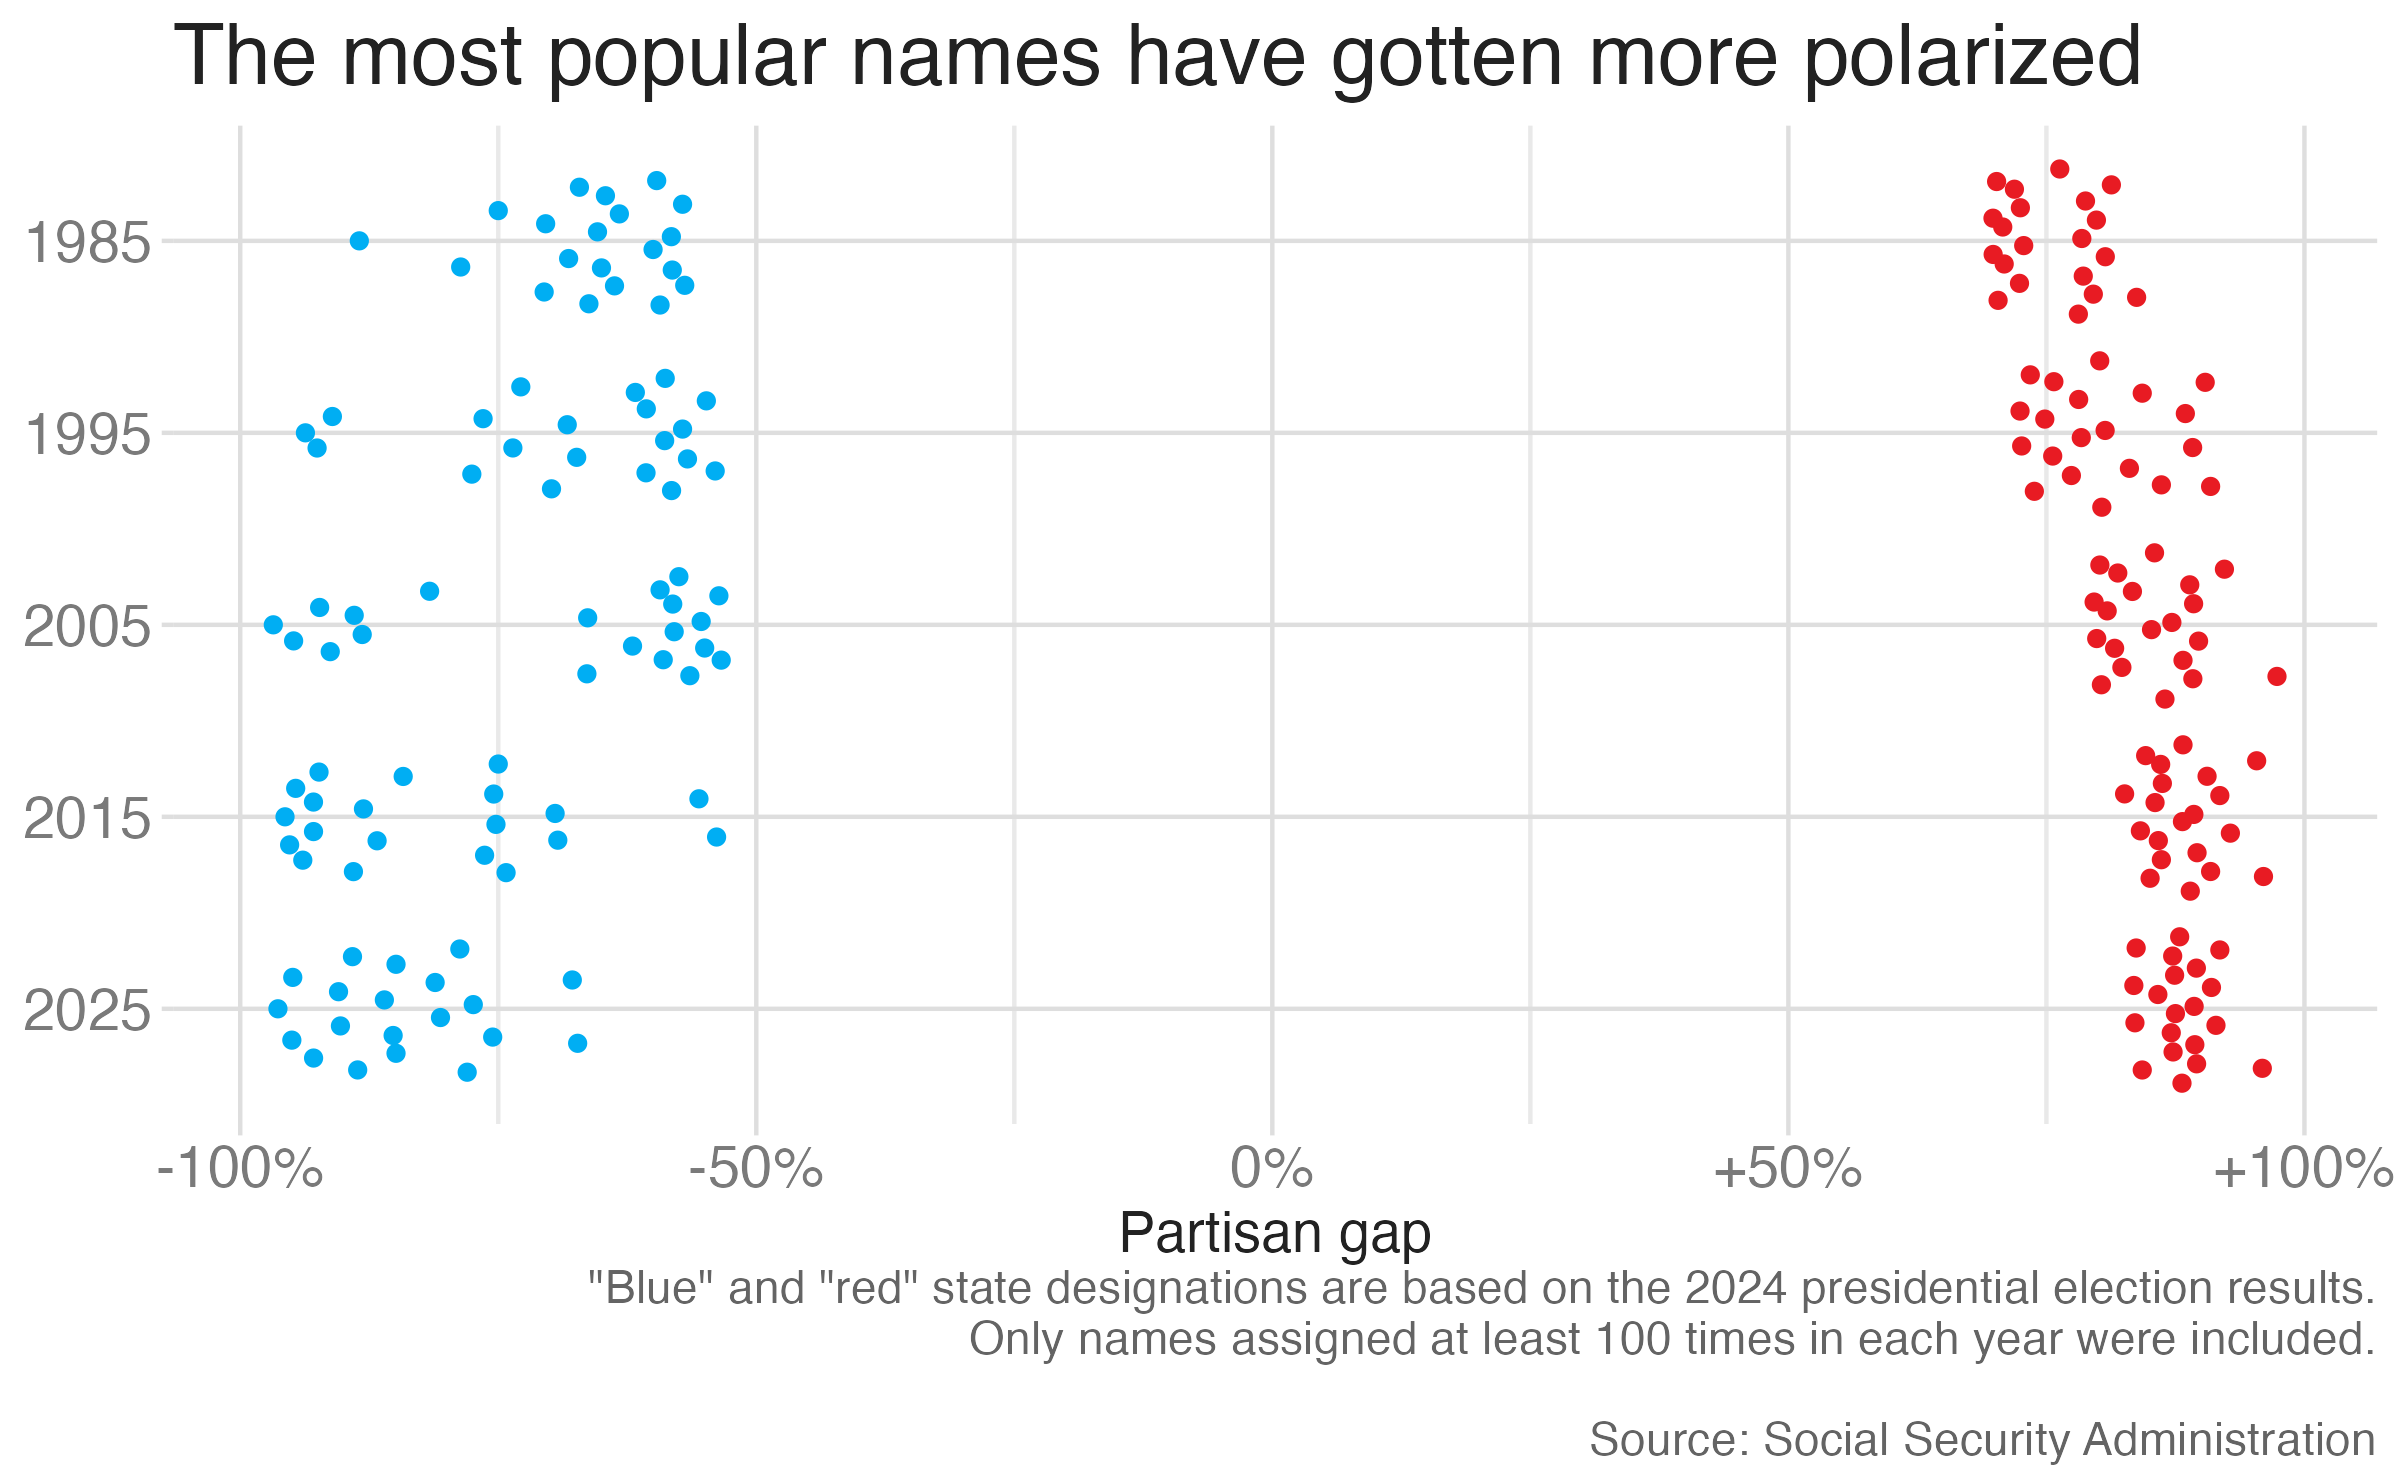
Creating a basic interactive chart
static_plot <- ggplot(
  data = partisan_names,
  mapping = aes(
    x = part_diff,
    y = fct_rev(year),
    color = outcome
  )
) +
  geom_quasirandom() +
  scale_x_continuous(labels = label_percent(style_positive = "plus")) +
  scale_color_manual(values = c(dem, rep), guide = "none") +
  labs(
    title = "The most popular names have gotten more polarized",
    x = "Partisan gap",
    y = NULL,
    caption = '"Blue" and "red" state designations are based on the 2024 presidential election results.\nOnly names assigned at least 100 times in each year were included.\n\nSource: Social Security Administration'
  )
static_plot
Make it interactive
interactive_plot <- ggplot(
  data = partisan_names,
  mapping = aes(
    x = part_diff,
    y = fct_rev(year),
    color = outcome
  )
) +
  geom_quasirandom_interactive(mapping = aes(tooltip = name, data_id = name)) +
  scale_x_continuous(labels = label_percent(style_positive = "plus")) +
  scale_color_manual(values = c(dem, rep), guide = "none") +
  labs(
    title = "The most popular names have gotten more polarized",
    x = "Partisan gap",
    y = NULL,
    caption = '"Blue" and "red" state designations are based on the 2024 presidential election results.\nOnly names assigned at least 100 times in each year were included.\n\nSource: Social Security Administration'
  )
girafe(ggobj = interactive_plot)
Make it interactive
Notes on {ggiraph}
- Uses {htmlwidgets} output, so it works best in HTML formats
- Interactivity is added explicitly with
*_interactive()geoms - Three primary aesthetics for interactivity:
tooltip: tooltips to be displayed when mouse is over elementsdata_id: unique identifier for hover and click behavioronclick: JavaScript function to be executed when elements are clicked
Including more information in the tooltip
Create a custom tooltip using the format:
Year: Baby name
+XX% R/D
Generate a new column using
mutate()with the required HTML character stringstr_glue()to combine character strings with data values- The
<br>is HTML syntax for a line break - Use the
label_percent()function to format numbers as percents
Create a custom tooltip
partisan_names <- partisan_names |>
  mutate(
    outcome = if_else(outcome == "Trump", "R", "D"),
    abs_part_diff = abs(part_diff),
    pct_label = label_percent(accuracy = 1, style_positive = "plus")(abs_part_diff),
    fancy_label = str_glue("{year}: {name}<br>{pct_label} {outcome}")
  )
partisan_names |>
  select(year, part_diff, outcome, pct_label, fancy_label)
# A tibble: 200 × 5
year part_diff outcome pct_label fancy_label
<fct> <dbl> <chr> <chr> <glue>
1 1985 0.837 R +84% 1985: Rodrick<br>+84% R
2 1985 0.813 R +81% 1985: Latoria<br>+81% R
3 1985 0.807 R +81% 1985: Kendrick<br>+81% R
4 1985 0.798 R +80% 1985: Coty<br>+80% R
5 1985 0.795 R +80% 1985: Santana<br>+80% R
6 1985 0.788 R +79% 1985: Demarcus<br>+79% R
7 1985 0.786 R +79% 1985: Marion<br>+79% R
8 1985 0.784 R +78% 1985: Scottie<br>+78% R
9 1985 0.781 R +78% 1985: Jarvis<br>+78% R
10 1985 0.763 R +76% 1985: Magan<br>+76% R
# ℹ 190 more rowsCreate a custom tooltip
static_plot_tooltip_fancy <- ggplot(
  data = partisan_names,
  mapping = aes(
    x = part_diff,
    y = fct_rev(year),
    color = outcome
  )
) +
  geom_quasirandom_interactive(
    mapping = aes(
      tooltip = fancy_label,
      data_id = name
    )
  ) +
  scale_x_continuous(labels = label_percent(style_positive = "plus")) +
  scale_color_manual(values = c(dem, rep), guide = "none") +
  labs(
    title = "The most popular names have gotten more polarized",
    x = "Partisan gap",
    y = NULL,
  ) +
  theme(legend.position = "none")

girafe(ggobj = static_plot_tooltip_fancy) |>
  girafe_options(
    opts_tooltip(
      css = "background-color: #ffffff; color: #111111; padding: 6px; border: 1px solid #999000;"
    )
  )
Create a custom tooltip
Using {ggiraph}
- Package documentation: {ggiraph} website
- ggiraph-book for more examples and detailed explanations of {ggiraph} features
- Most useful helpers:
girafe(),opts_tooltip(),opts_hover(),opts_selection()
Application exercise
ae-17
Instructions
- Go to the course GitHub org and find your
ae-17(repo name will be suffixed with your GitHub name). - Clone the repo in Positron, run
renv::restore()to install the required packages, open the Quarto document in the repo, and follow along and complete the exercises. - Render, commit, and push your edits by the AE deadline – end of the day
Other R packages for interactive charts
- {plotly} for interactive charts via Plotly.js
- {highcharter} via Highcharts.js
- {rgl} for 3D interactive graphics
- {dygraph} for time series charts
- {leaflet} via Leaflet.js for interactive maps
- {mapgl} via MapBox/MapLibre GL JS for interactive maps
Or take INFO 3300/5100 to learn to do this from scratch
Wrap-up
Recap
- Interactivity provides additional dimensions and methods for communicating using data
- {ggiraph} is a powerful way to create interactive plots in R
- Use interactive geoms and
girafe()to add interactivity to {ggplot2} plots
