Visualizing survey data
Lecture 16
March 19, 2026

Top-line survey reports


Stacked bar charts
Show the code
stack_bar_p <- ggplot(
  data = iran_war_long,
  mapping = aes(x = pct, y = pid3, fill = response)
) +
  geom_col() +
  scale_x_continuous(labels = label_percent(), position = "top") +
  scale_fill_discrete_diverging(
    palette = "Blue-Red",
    labels = label_wrap(width = 8),
    guide = guide_legend(
      reverse = TRUE,
      theme = theme(legend.key.width = unit(1, "cm"))
    )
  ) +
  labs(
    x = NULL,
    y = NULL,
    fill = NULL,
    title = "Do you support or oppose the war with Iran?",
    caption = "Source: YouGov (March 13-16, 2026)"
  ) +
  theme(
    legend.position = "bottom",
    panel.grid = element_blank(),
    axis.ticks.y = element_blank(),
    axis.ticks.length.x = unit(0.25, "cm")
  )
stack_bar_p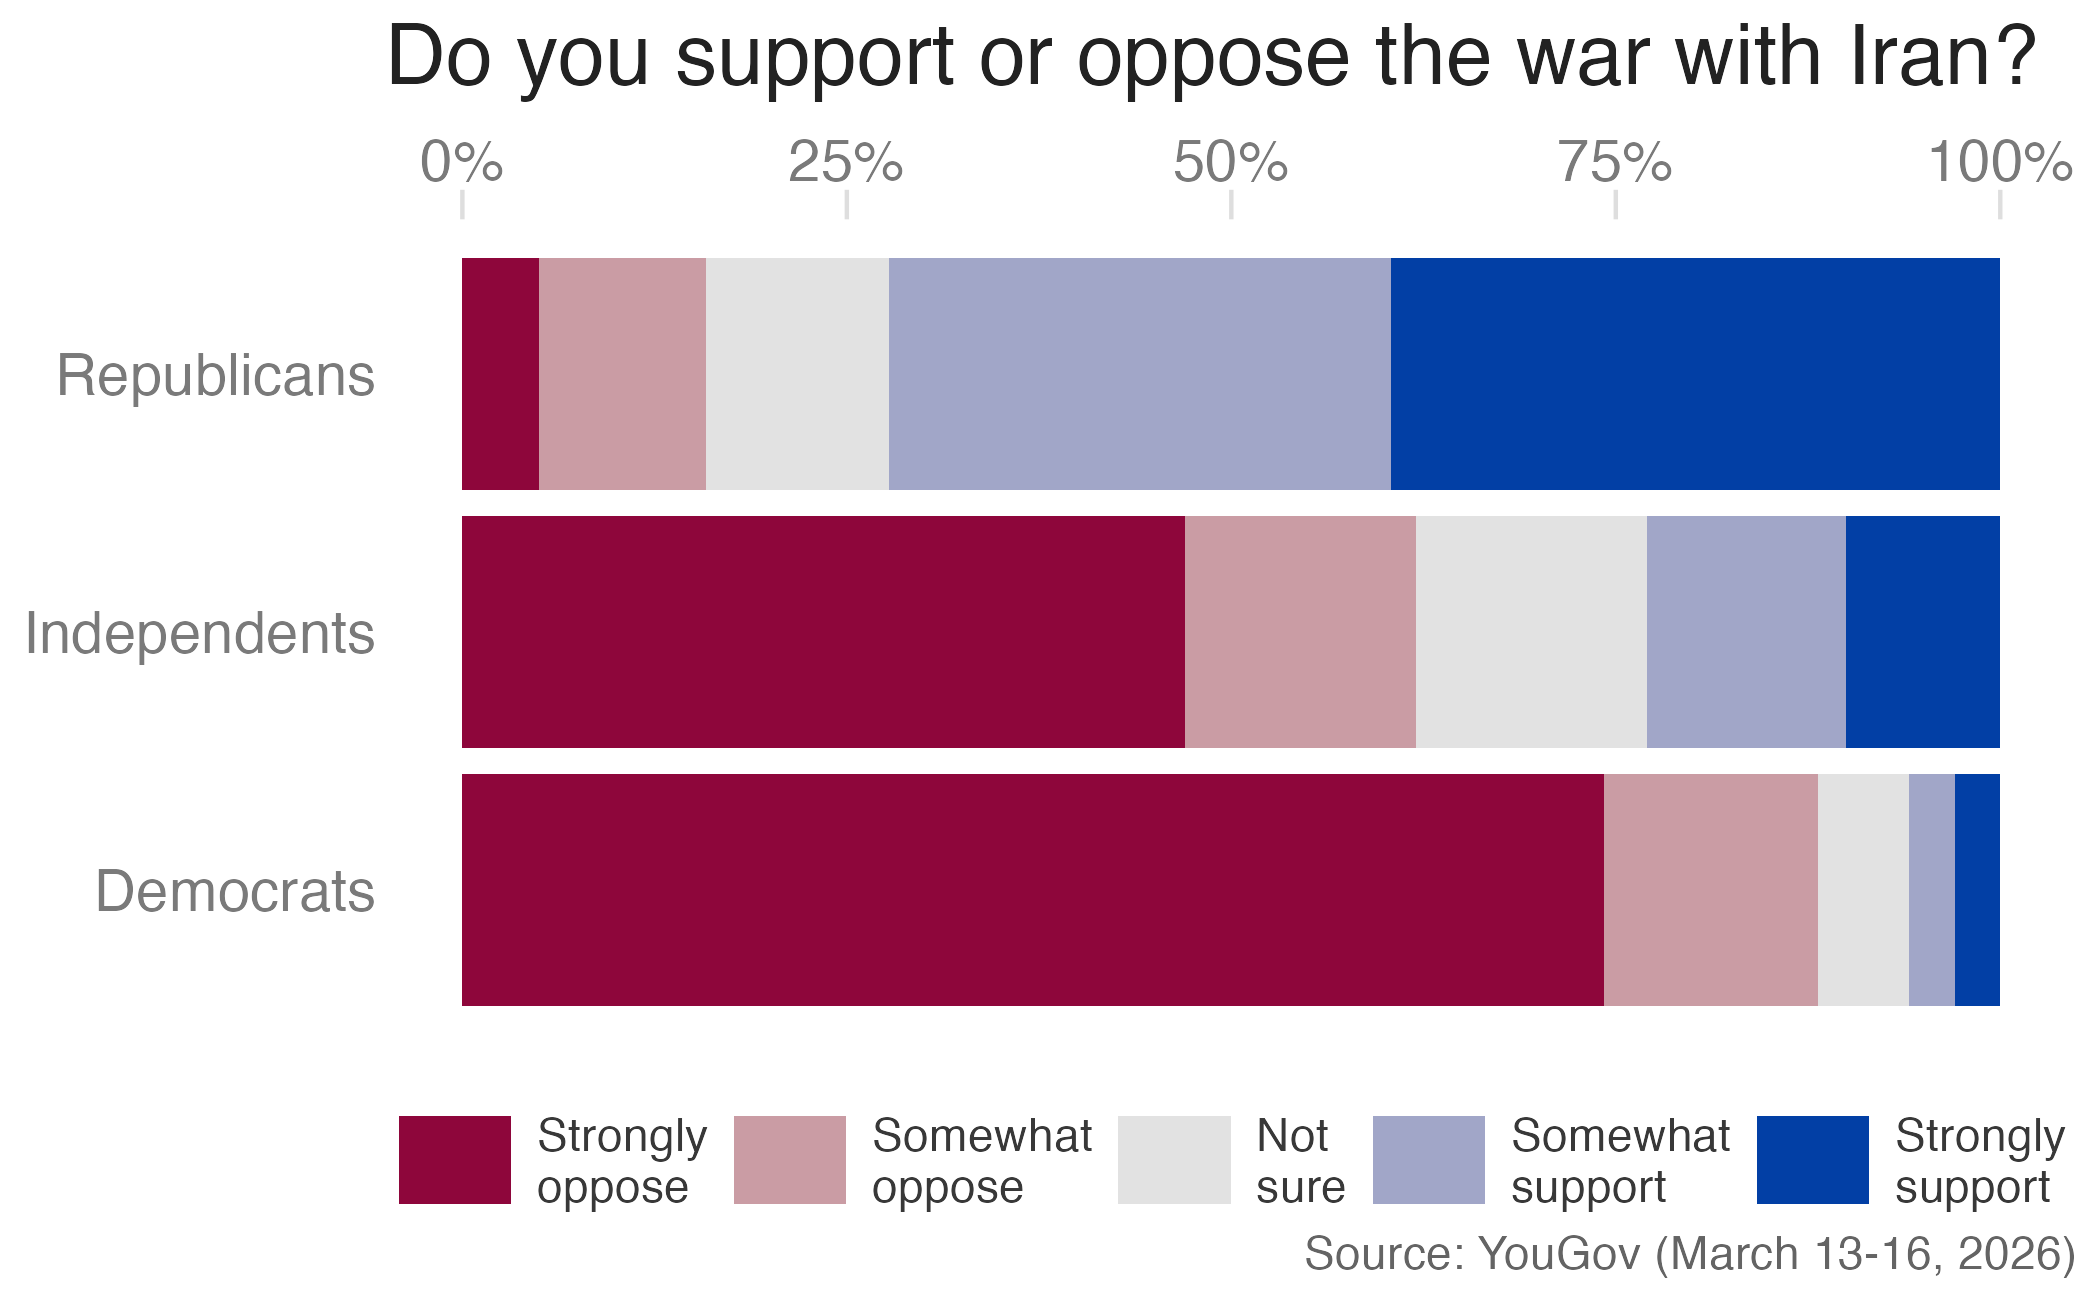
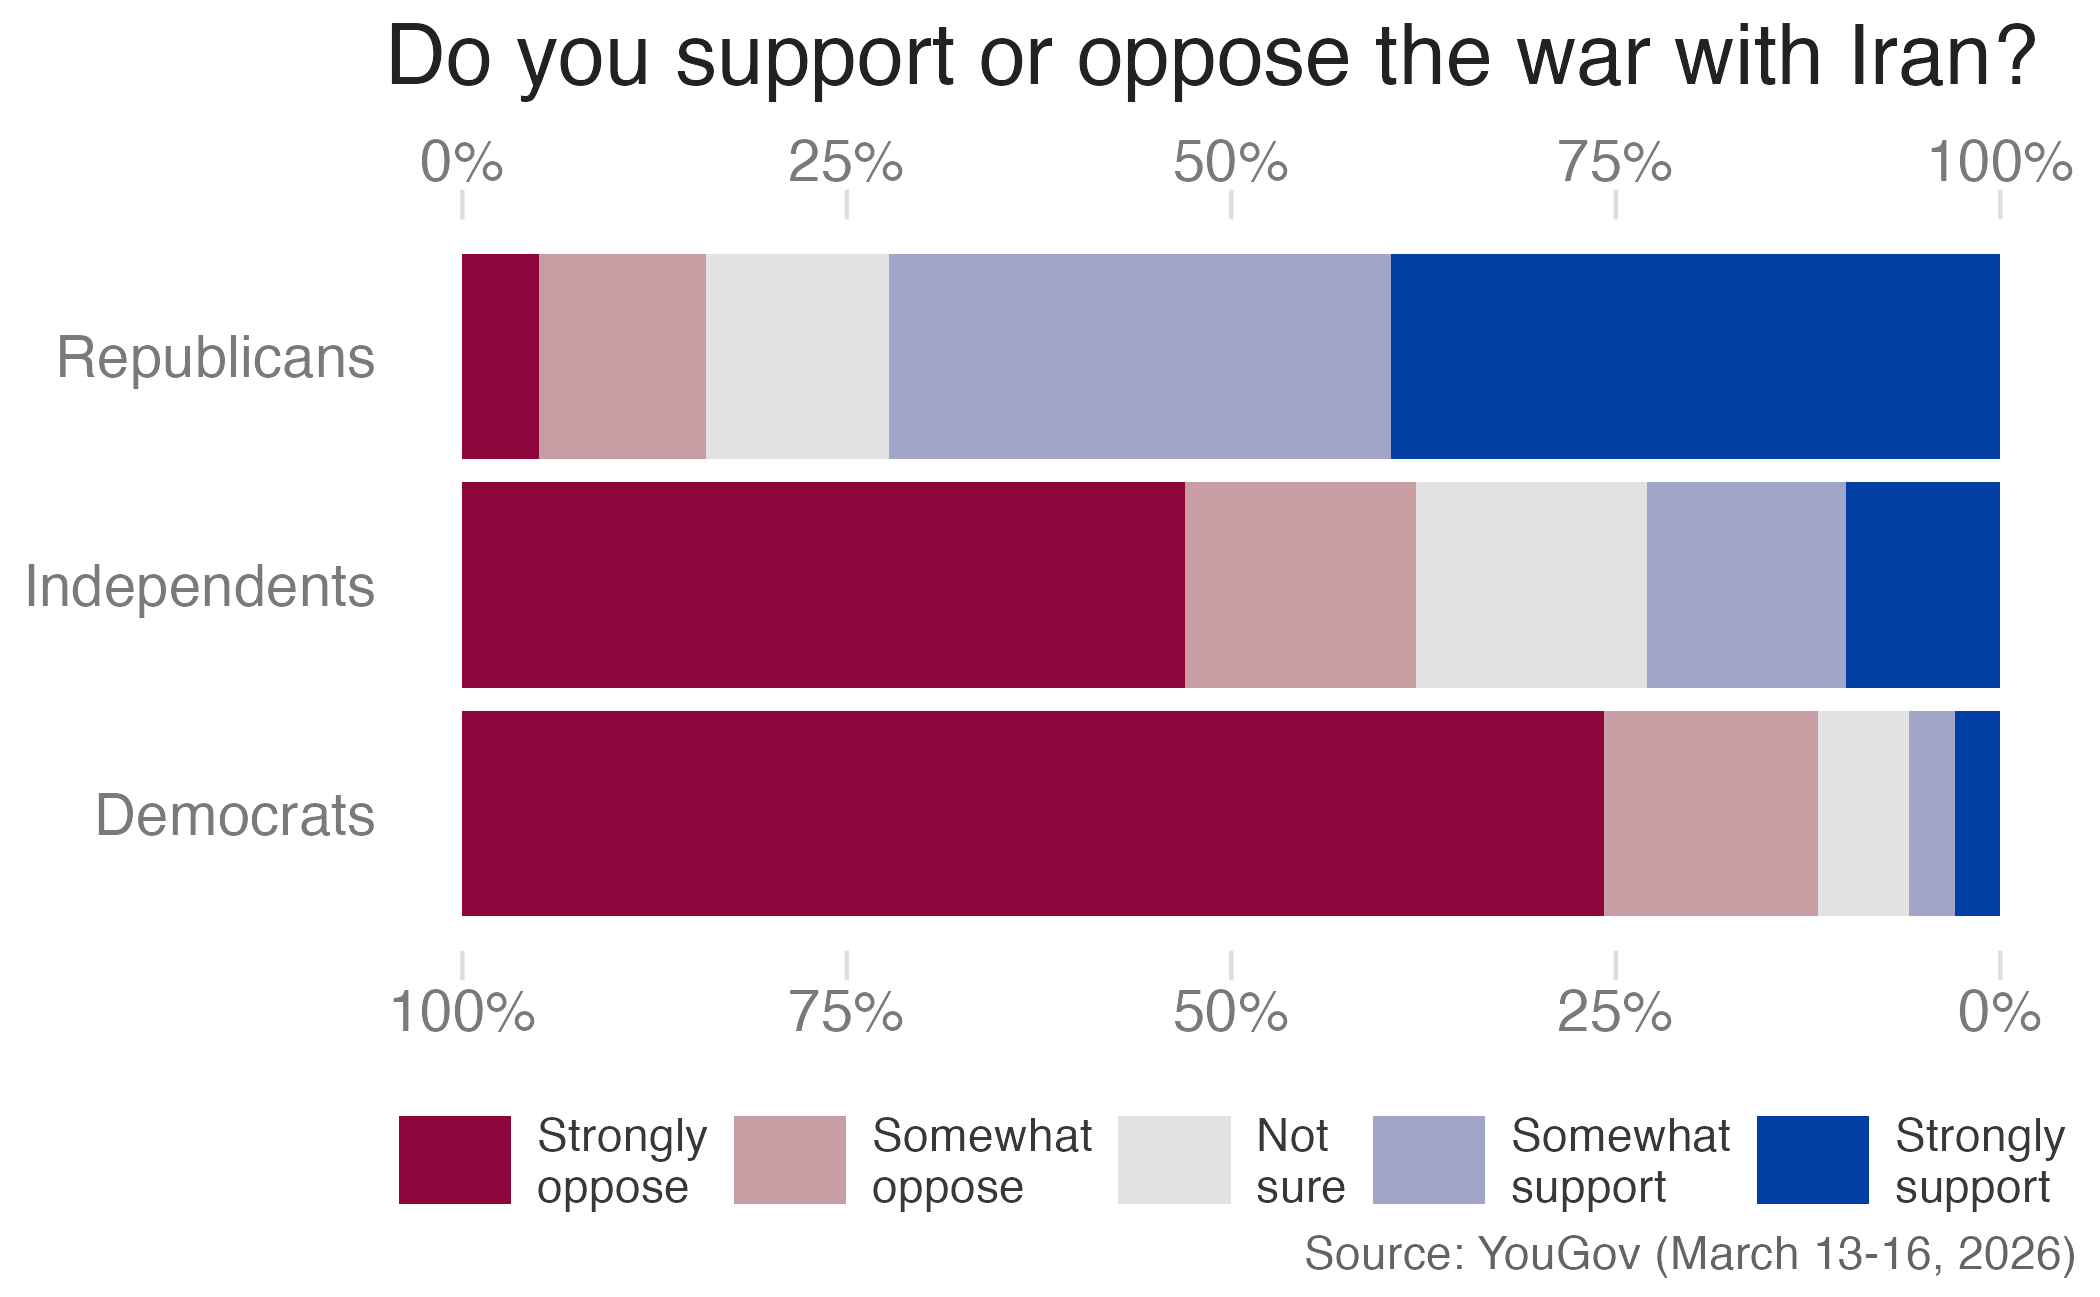
With a double axis
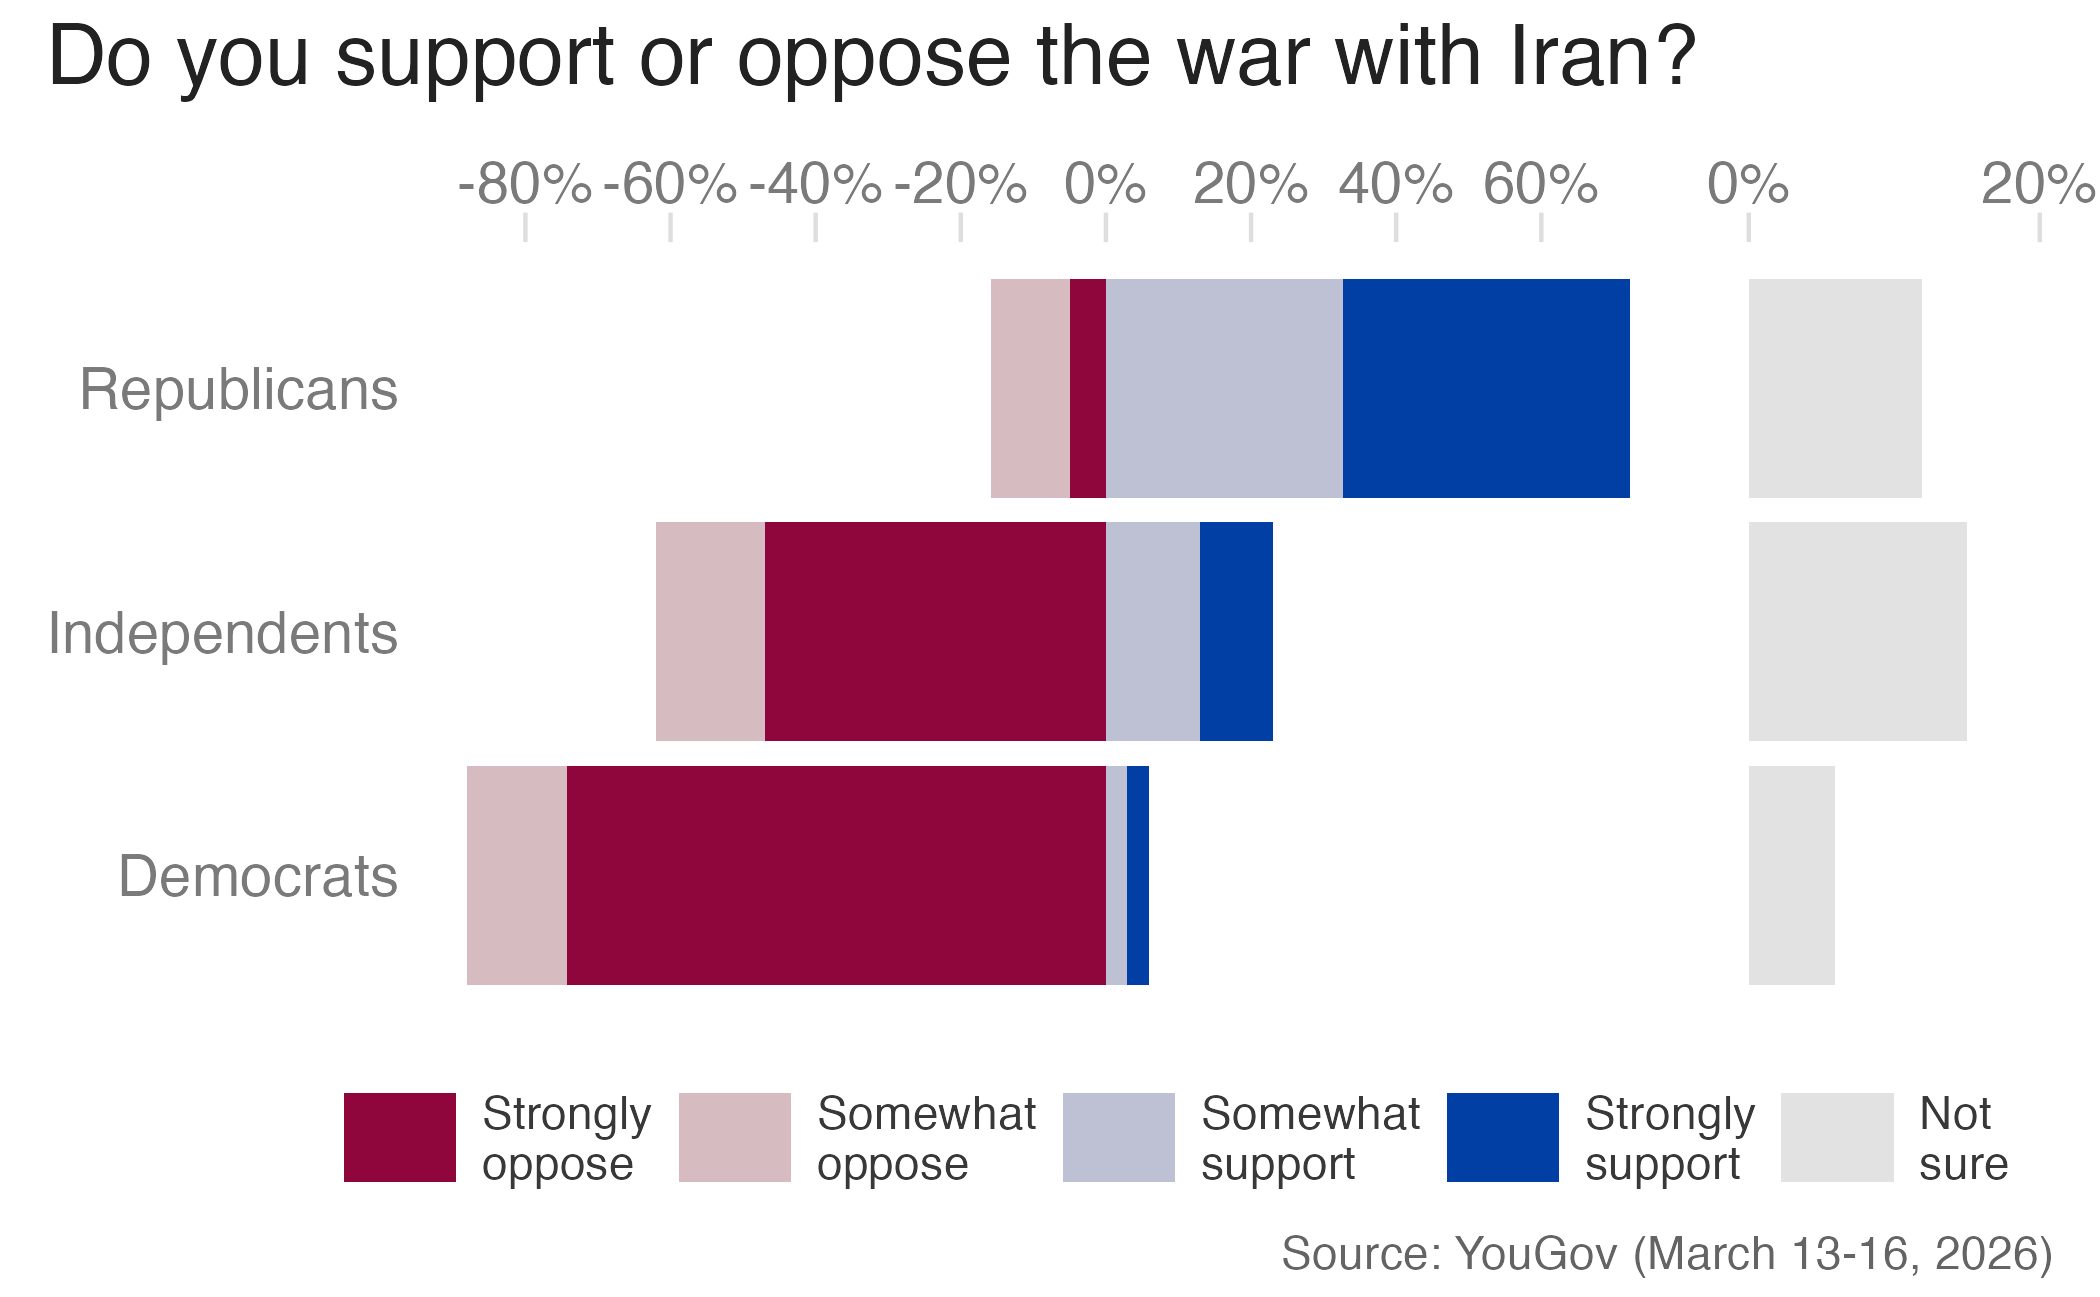
Diverging, with extra neutrals
Show the code
# main plot
div_bar_no_neutral_p <- iran_war_long |>
  # remove Not sure responses
  filter(response != "Not sure") |>
  # shift negative responses to the left of the origin
  mutate(
    pct = if_else(
      response %in% c("Strongly oppose", "Somewhat oppose"),
      -pct,
      pct
    ),
    # convert response to character vector
    # factors with duplicated levels can cause issues with plotting
    response = as.character(response)
  ) |>
  ggplot(mapping = aes(x = pct, y = pid3, fill = response)) +
  # reverse the stacking order since response is no longer a factor
  geom_col(position = position_stack(reverse = TRUE)) +
  scale_x_continuous(
    breaks = seq(from = -.8, to = .6, by = .2),
    labels = label_percent(),
    position = "top"
  ) +
  # manually generate the diverging color scale since response is no longer a factor
  scale_fill_manual(
    labels = label_wrap(width = 8),
    # fix the order to match the other plots
    breaks = c(
      "Strongly support",
      "Somewhat support",
      "Not sure",
      "Somewhat oppose",
      "Strongly oppose"
    ),
    # generate palette manually as a character vector
    values = diverging_hcl(palette = "Blue-Red", n = 5),
    guide = guide_legend(
      reverse = TRUE,
      theme = theme(legend.key.width = unit(1, "cm"))
    )
  ) +
  labs(
    x = NULL,
    y = NULL,
    fill = NULL
  ) +
  theme(
    legend.position = "bottom",
    panel.grid = element_blank(),
    axis.ticks.y = element_blank(),
    axis.ticks.length.x = unit(0.25, "cm")
  )

# separate plot for neutrals
div_bar_neutral_p <- iran_war_long |>
  filter(response == "Not sure") |>
  ggplot(mapping = aes(x = pct, y = pid3, fill = response)) +
  geom_col(position = position_stack(reverse = TRUE)) +
  scale_x_continuous(
    breaks = c(0, .2),
    limits = c(NA, .2),
    labels = label_percent(),
    position = "top"
  ) +
  scale_fill_discrete_diverging(
    palette = "Blue-Red",
    labels = label_wrap(width = 8),
    guide = guide_legend(
      reverse = TRUE,
      theme = theme(legend.key.width = unit(1, "cm"),
      legend.justification = "left")
    )
  ) +
  labs(
    x = NULL,
    y = NULL,
    fill = NULL
  ) +
  theme(
    legend.position = "bottom",
    panel.grid = element_blank(),
    axis.ticks.y = element_blank(),
    axis.ticks.length.x = unit(0.25, "cm")
  )

# combine together with patchwork
div_bar_no_neutral_p +
  div_bar_neutral_p +
  # add shared title and caption
  plot_annotation(
    title = "Do you support or oppose the war with Iran?",
    caption = "Source: YouGov (March 13-16, 2026)"
  ) +
  # combine shared axes
  plot_layout(
    widths = c(4, 1),
    axes = "collect"
  )
Diverging, integrated neutrals
Show the code
# split the neutral responses in half and plot them on either side of the origin
div_int_neutral_p <- iran_war_long |>
  # neutral will be split into two equal halves
  mutate(pct_plot = if_else(response == "Not sure", pct / 2, pct)) |>
  # duplicate neutral rows so one half can go left and one right
  uncount(
    weights = if_else(response == "Not sure", 2L, 1L),
    .id = "neutral_half"
  ) |>
  # invert oppose responses and one half of neutrals to negative values
  mutate(
    pct_plot = case_when(
      response %in% c("Strongly oppose", "Somewhat oppose") ~ -pct_plot,
      response == "Not sure" & neutral_half == 1L ~ -pct_plot,
      .default = pct_plot
    ),
    # convert response to character vector
    # factors with duplicated levels can cause issues with plotting
    response = as.character(response)
  ) |>
  ggplot(mapping = aes(x = pct_plot, y = pid3, fill = response)) +
  # reverse the stacking order since response is no longer a factor
  geom_col(position = position_stack(reverse = TRUE)) +
  geom_vline(xintercept = 0, linewidth = 0.4, color = "gray40") +
  scale_x_continuous(
    breaks = seq(from = -.8, to = .6, by = .2),
    labels = label_percent(),
    position = "top"
  ) +
  # manually generate the diverging color scale since response is no longer a factor
  scale_fill_manual(
    labels = label_wrap(width = 8),
    # fix the order to match the other plots
    breaks = c(
      "Strongly support",
      "Somewhat support",
      "Not sure",
      "Somewhat oppose",
      "Strongly oppose"
    ),
    # generate palette manually as a character vector
    values = diverging_hcl(palette = "Blue-Red", n = 5),
    guide = guide_legend(
      reverse = TRUE,
      theme = theme(legend.key.width = unit(1, "cm"))
    )
  ) +
  labs(
    x = NULL,
    y = NULL,
    fill = NULL,
    title = "Do you support or oppose the war with Iran?",
    caption = "Source: YouGov (March 13-16, 2026)"
  ) +
  theme(
    legend.position = "bottom",
    panel.grid = element_blank(),
    axis.ticks.y = element_blank(),
    axis.ticks.length.x = unit(0.25, "cm")
  )
div_int_neutral_p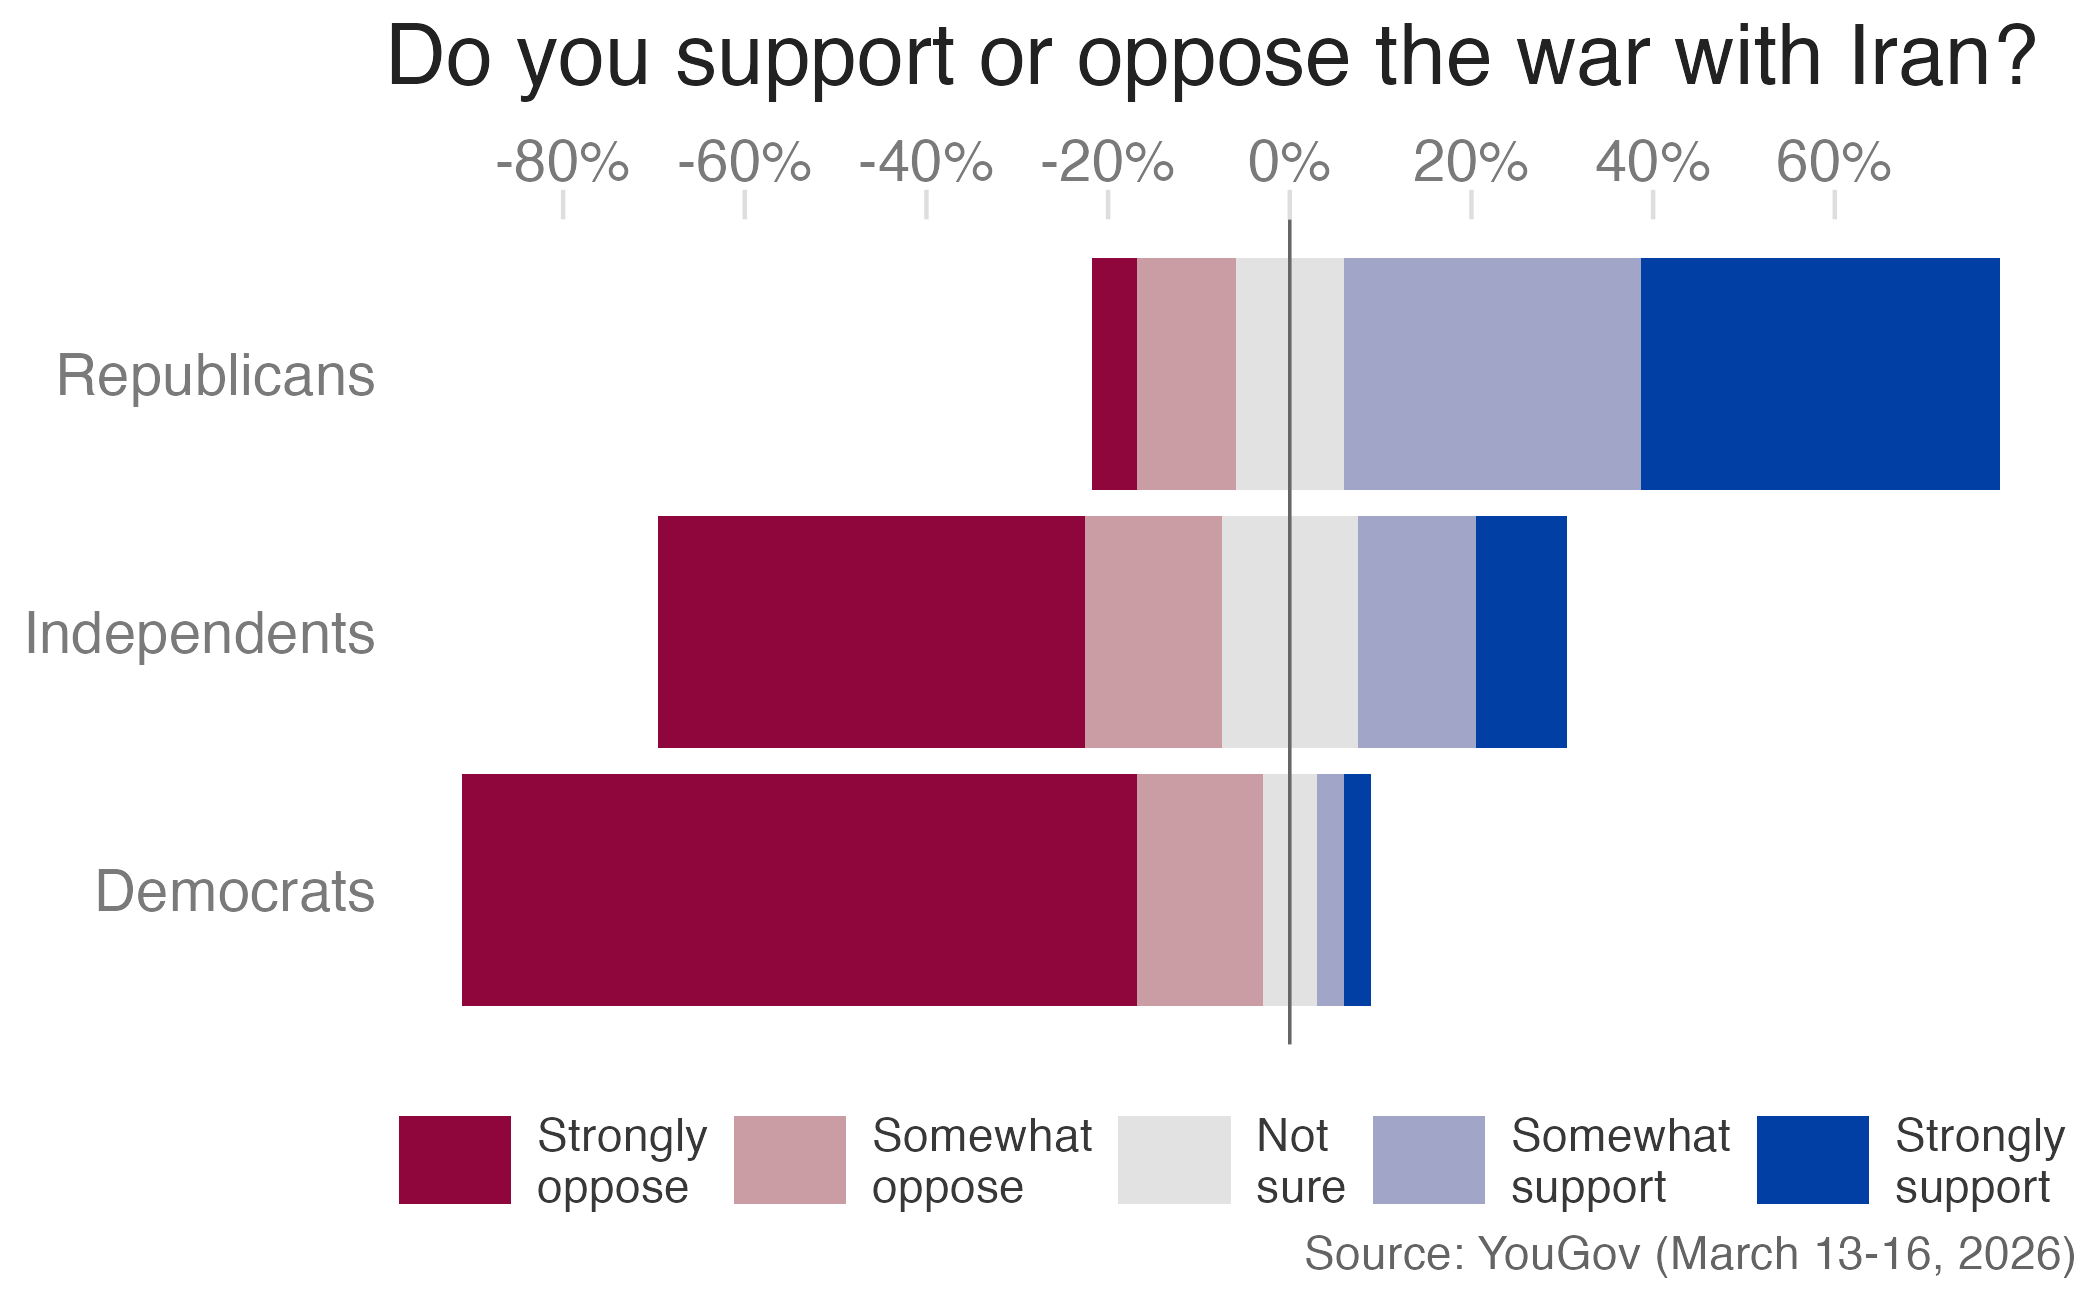
Split bars
Show the code
split_bars_p <- ggplot(
  data = iran_war_long,
  mapping = aes(x = pct, y = pid3, fill = response)
) +
  geom_col() +
  scale_x_continuous(
    breaks = seq(from = 0, to = 1, by = 0.2),
    labels = label_percent(),
    position = "top"
  ) +
  scale_fill_discrete_diverging(
    palette = "Blue-Red",
    guide = "none"
  ) +
  facet_wrap(
    facets = vars(response |> fct_rev()),
    nrow = 1,
    space = "free_x",
    scales = "free_x",
    labeller = label_wrap_gen(width = 15)
  ) +
  labs(
    x = NULL,
    y = NULL,
    fill = NULL,
    title = "Do you support or oppose the war with Iran?",
    caption = "Source: YouGov (March 13-16, 2026)"
  ) +
  theme(
    panel.grid = element_blank(),
    axis.ticks.y = element_blank(),
    axis.ticks.length.x = unit(0.25, "cm"),
    # shrink the text size for the facet labels to fit
    strip.text = element_text(size = rel(0.7),
    margin = margin(t = 1, r = 0, b = 1, l = 0, unit = "mm"))
  )
split_bars_p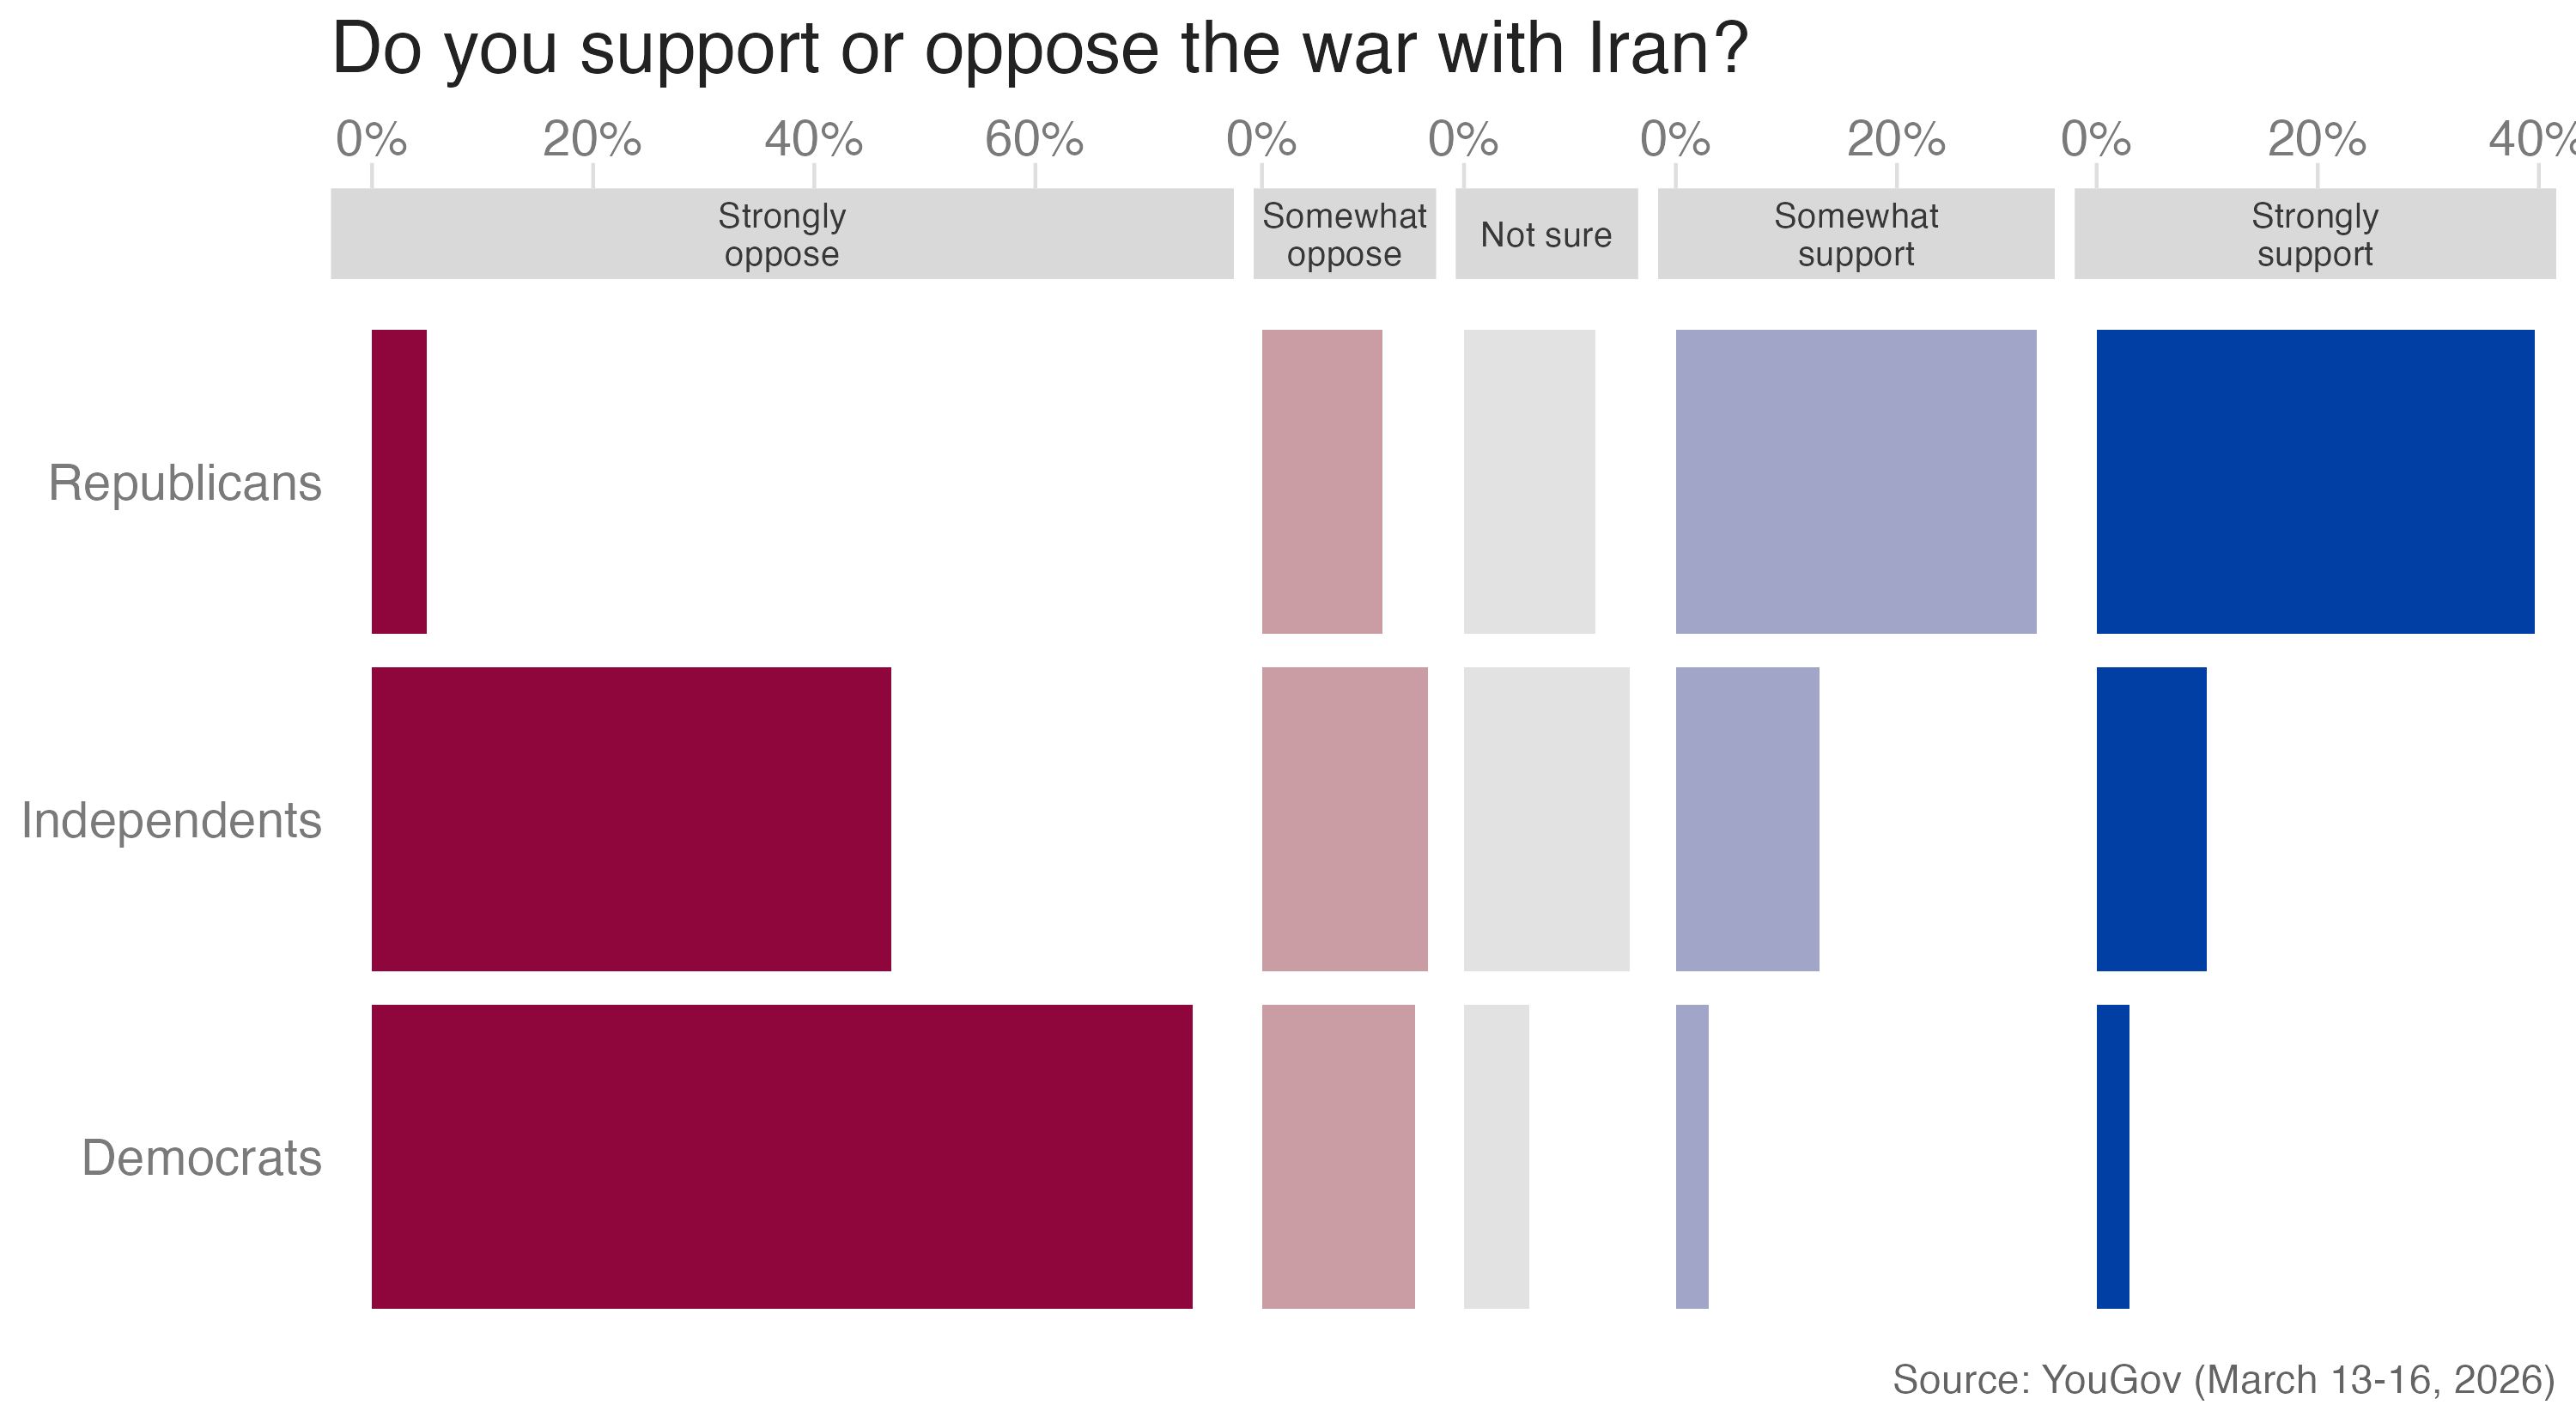
ae-15
Compare the advantages of different bar chart designs for reporting Likert scale data