Graphical design: Scientific neutrality and Tufte
Lecture 14
Dr. Benjamin Soltoff
Cornell University
INFO 3312/5312 - Spring 2026
March 13, 2026
Announcements
Announcements
- Project 01
- Project 02
Edward Tufte
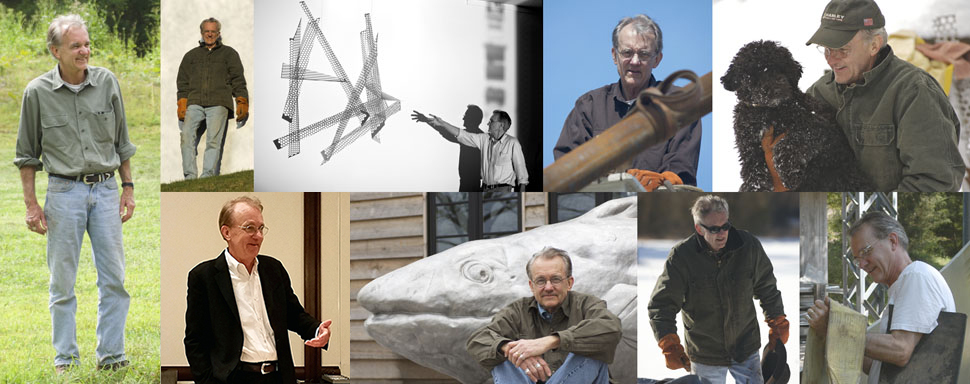
Image credit: Edward Tufte
Edward Tufte
- Pioneer in the field of data visualization
- PhD in political science
- Professor emeritus of political science, statistics, and computer science at Yale
- Collaborator with John Tukey
- Self published 5 books on information design and data visualization
Principles of graphical excellence
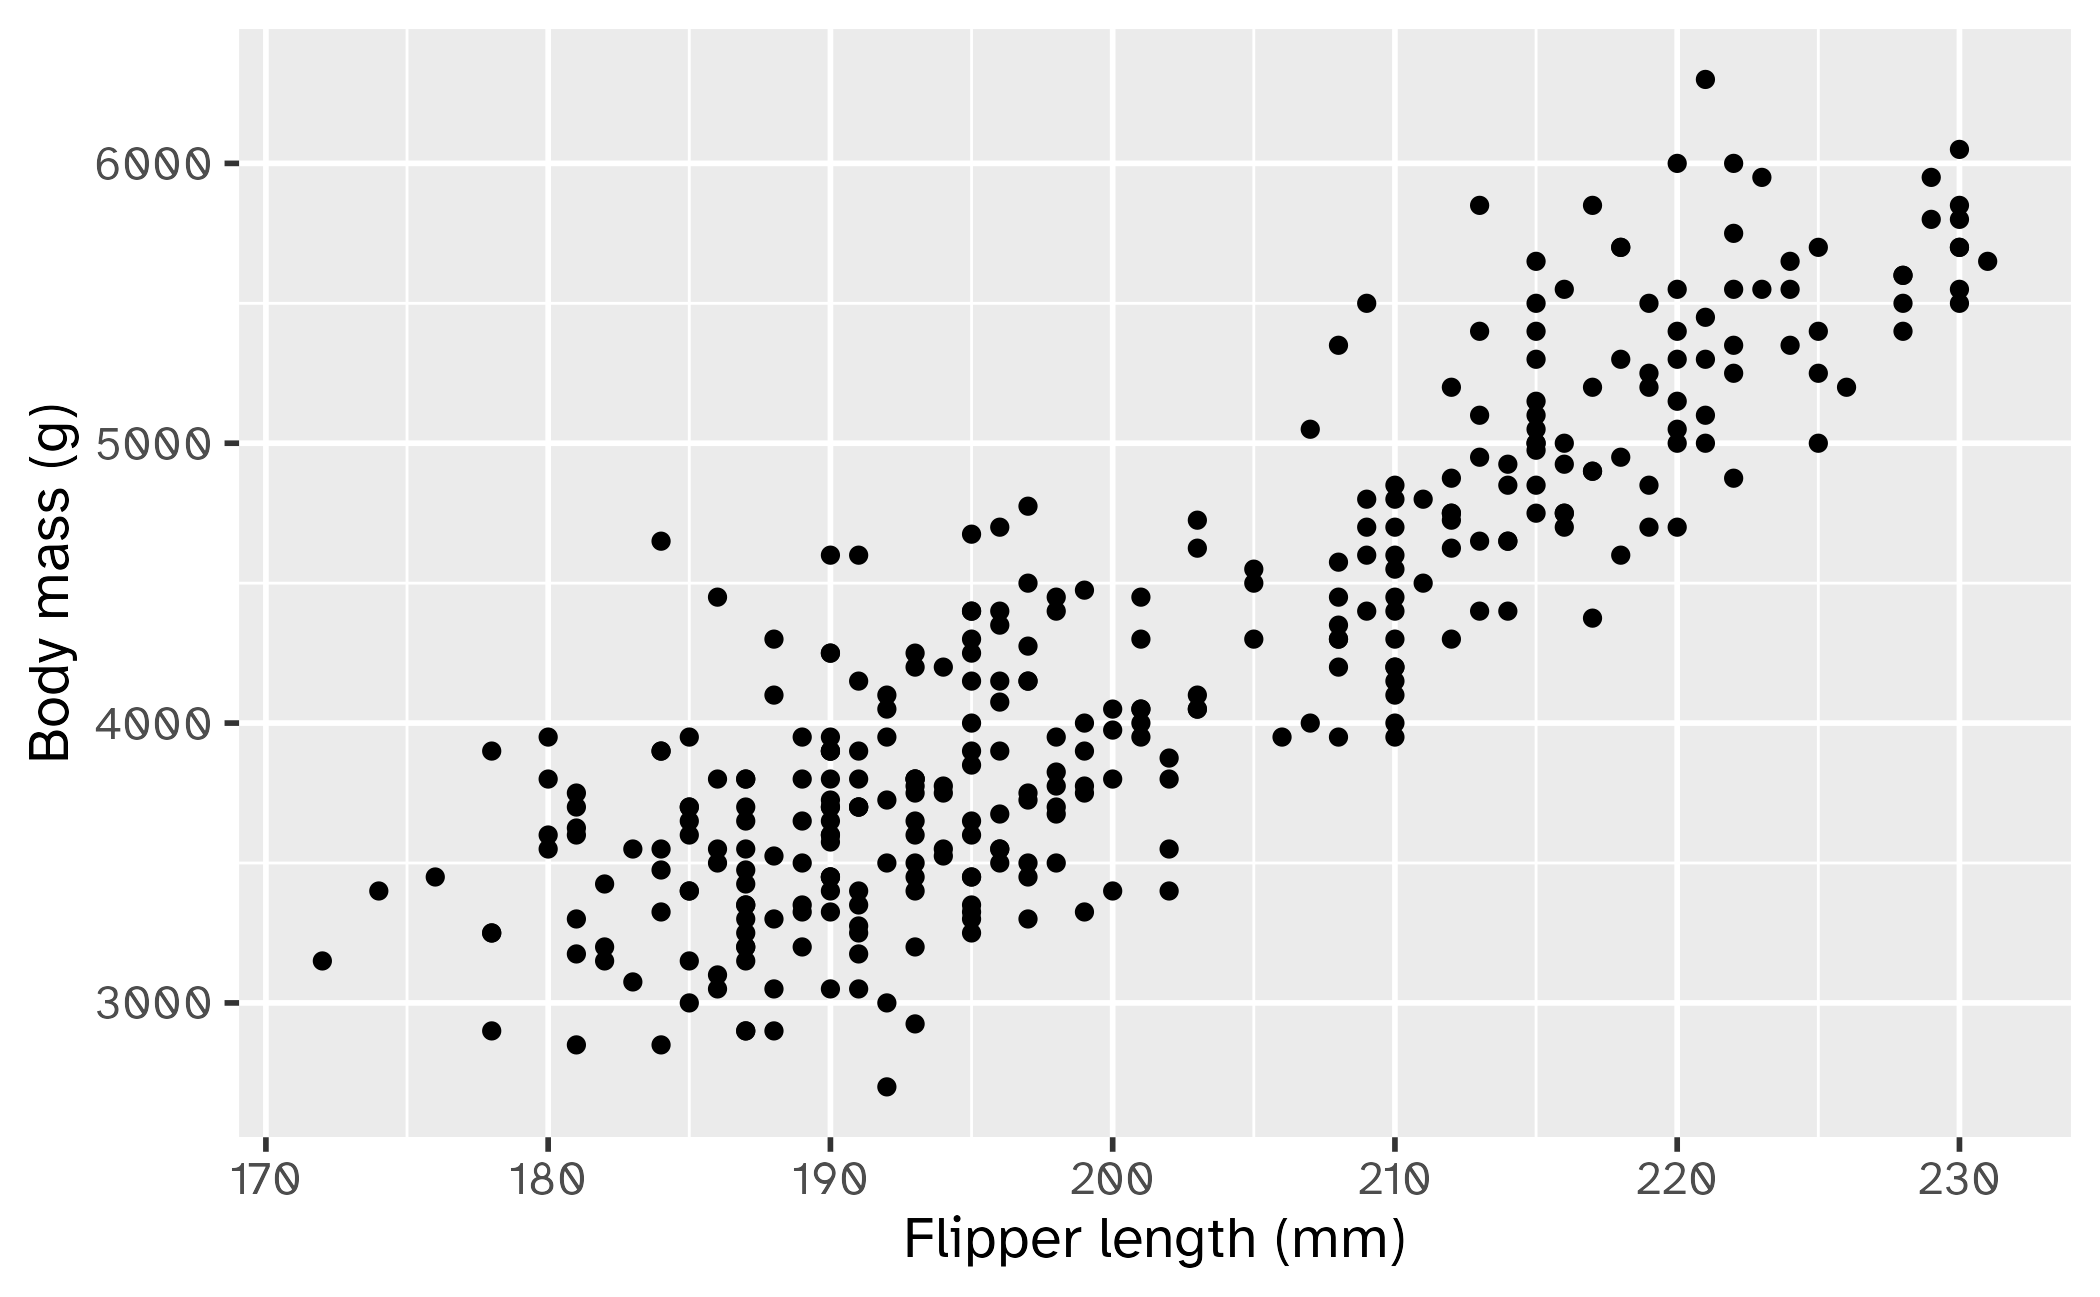
Above all else show the data.
- Show the data
- Induce the viewer to think about the substance rather than about methodology, graphic design, the technology of graphic production, or something else
- Avoid distorting what the data have to say
- Present many numbers in a small space
- Make large data sets coherent
- Encourage the eye to compare different pieces of data
- Reveal the data at several levels of detail, from a broad overview to the fine structure
- Serve a reasonably clear purpose: description, exploration, tabulation, or decoration
- Be closely integrated with the statistical and verbal descriptions of a data set
Source: The Visual Display of Quantitative Information, ch 1
Data-Ink
Goal is to maximize the data-ink ratio
\[\text{Data-ink ratio} = \frac{\text{data-ink}}{\text{total ink used to print the graphic}}\]
Proportion of a graphic’s ink devoted to the non-redundant display of data-information
What parts of a graph are data-ink?
Identifying data-ink
Ink on the chart
- Data points
- Axis ticks
- Axis tick labels
- Axis labels
- Background
- Grid lines
Reduce non-data ink
What about a bar graph?
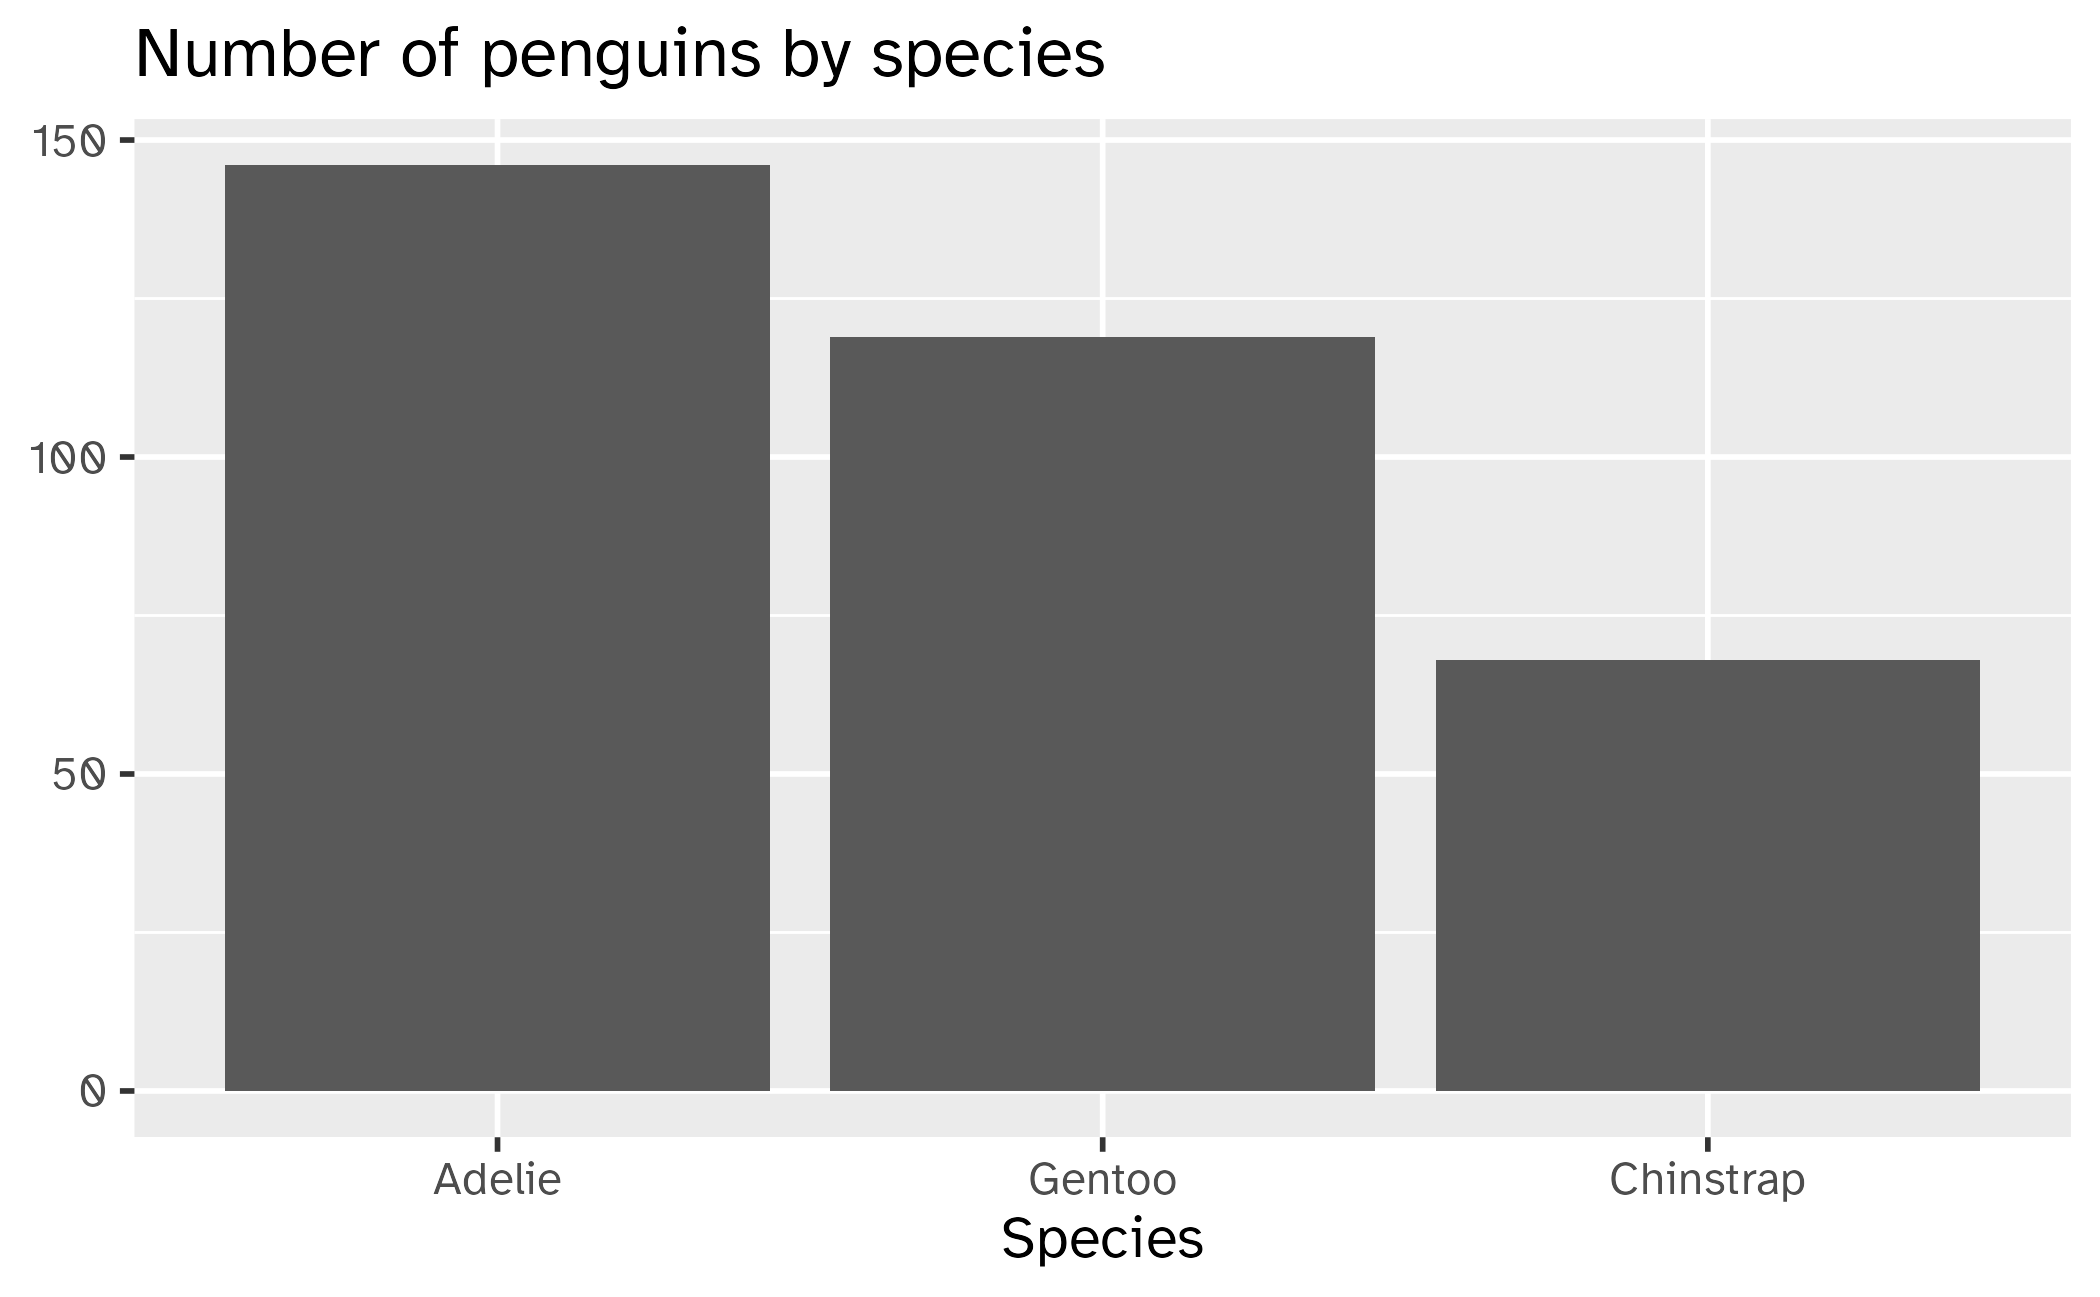
Reduce non-data ink
Application exercise
ae-13
Instructions
Redesign a boxplot to maximize the share of data-ink and reduce unnecessary duplication
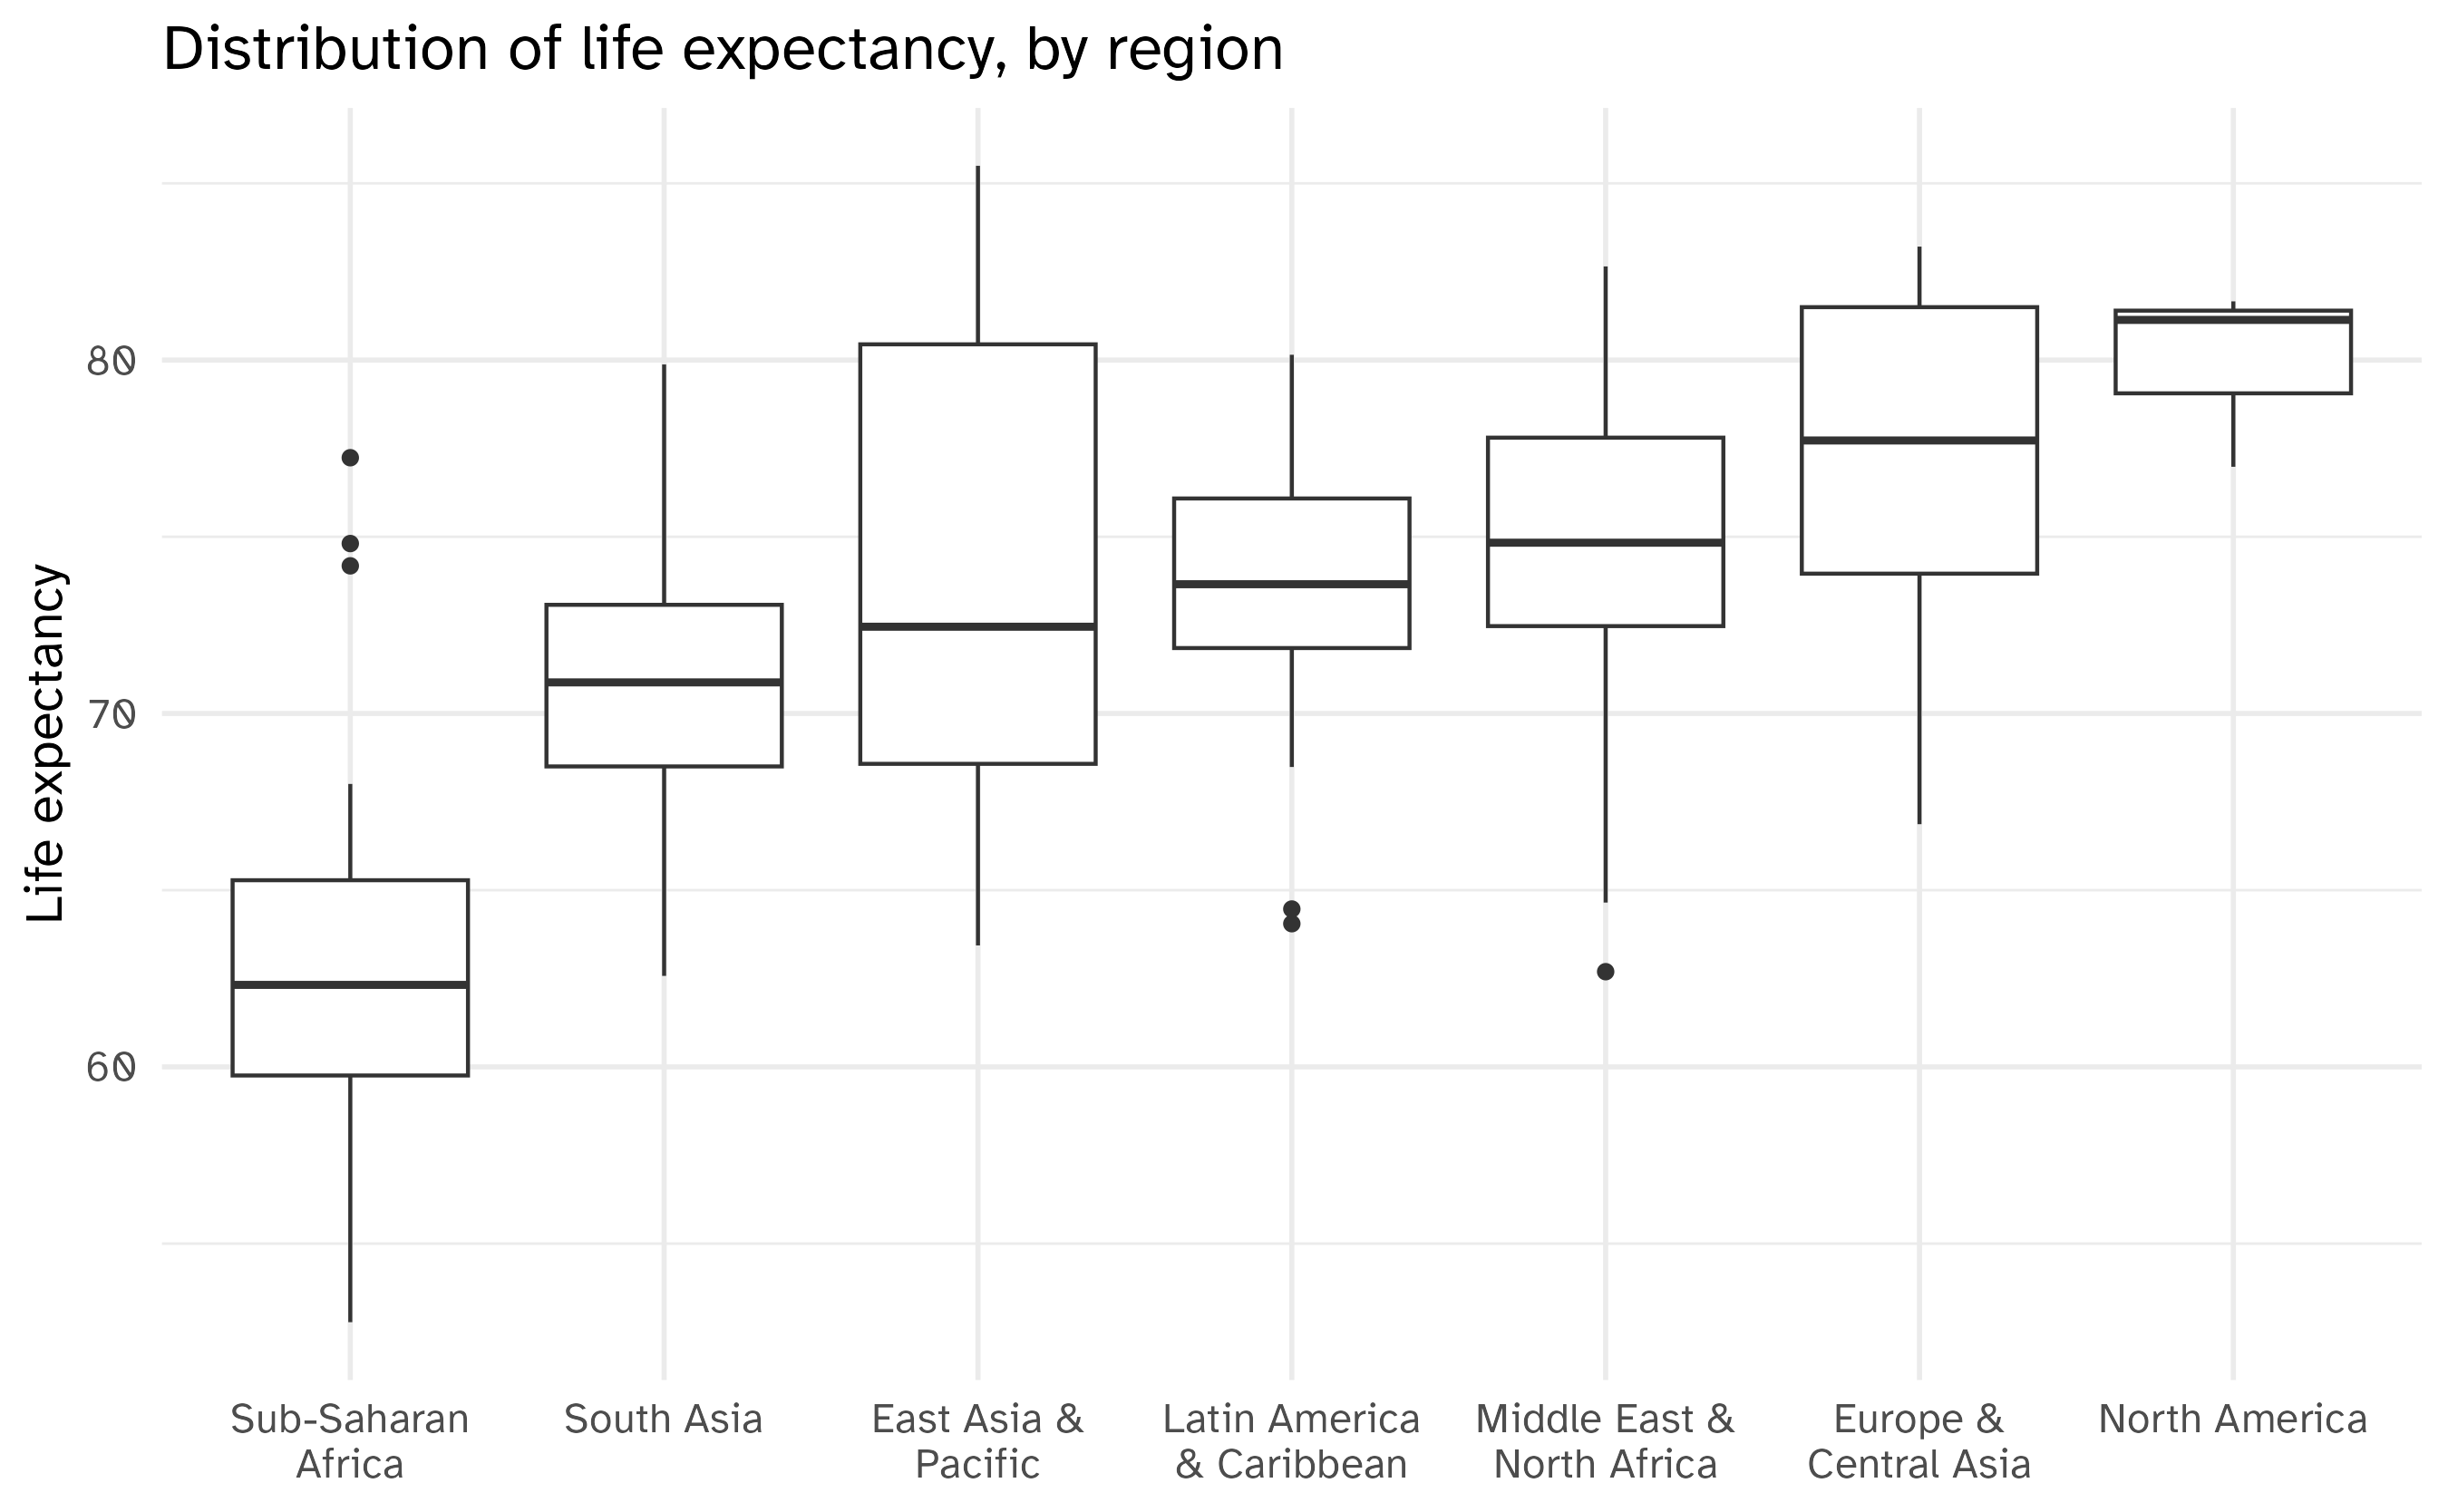
Maximized data-ink
#| warning: false
#| min-lines: 6
#| max-lines: 8
#| fig-width: 9
wdi |>
  mutate(region = fct_reorder(region, life_exp)) |>
  ggplot(mapping = aes(y = life_exp, x = region)) +
  geom_boxplot() +
  scale_x_discrete(labels = label_wrap_gen(width = 15)) +
  labs(
    x = NULL,
    y = "Life expectancy",
    title = "Distribution of life expectancy, by region"
  )
Nigel Holmes and “chartjunk”
Chartjunk
Graphical decorations that do not improve the viewer’s understanding of the data
- Grid lines
- Big Pointless Objects
- Artistic flair
Nigel Holmes
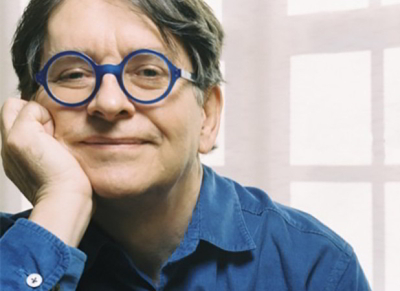
- Graphic designer
- Former graphics director for Time magazine
- Distinctive “visual flair” in his work
- Frequently criticized by Tufte for his elaborate use of “chartjunk”
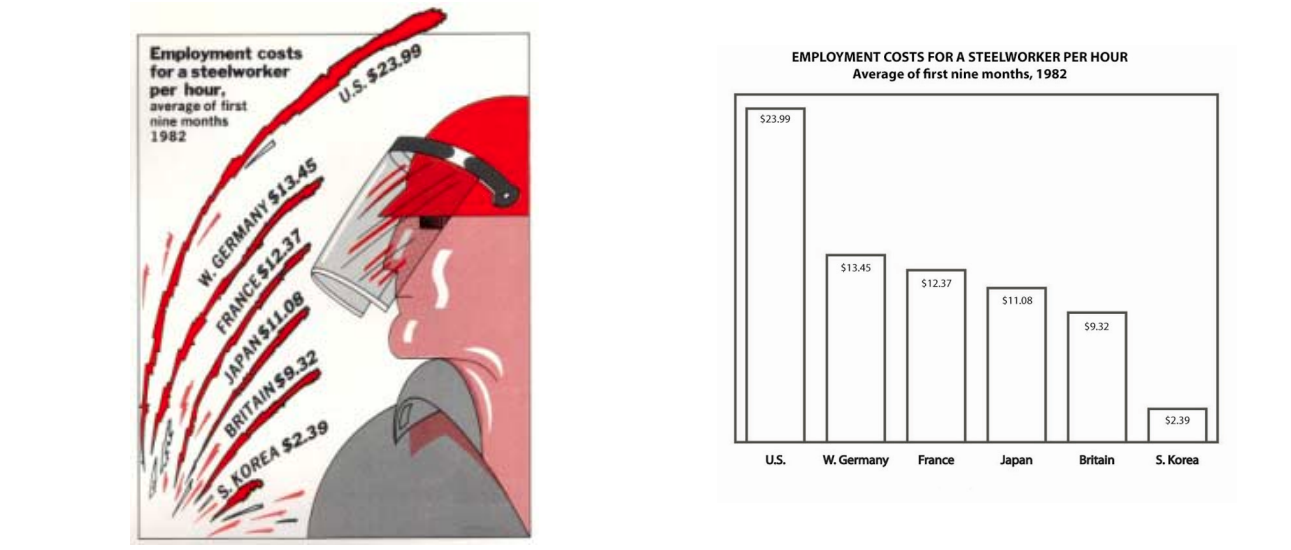
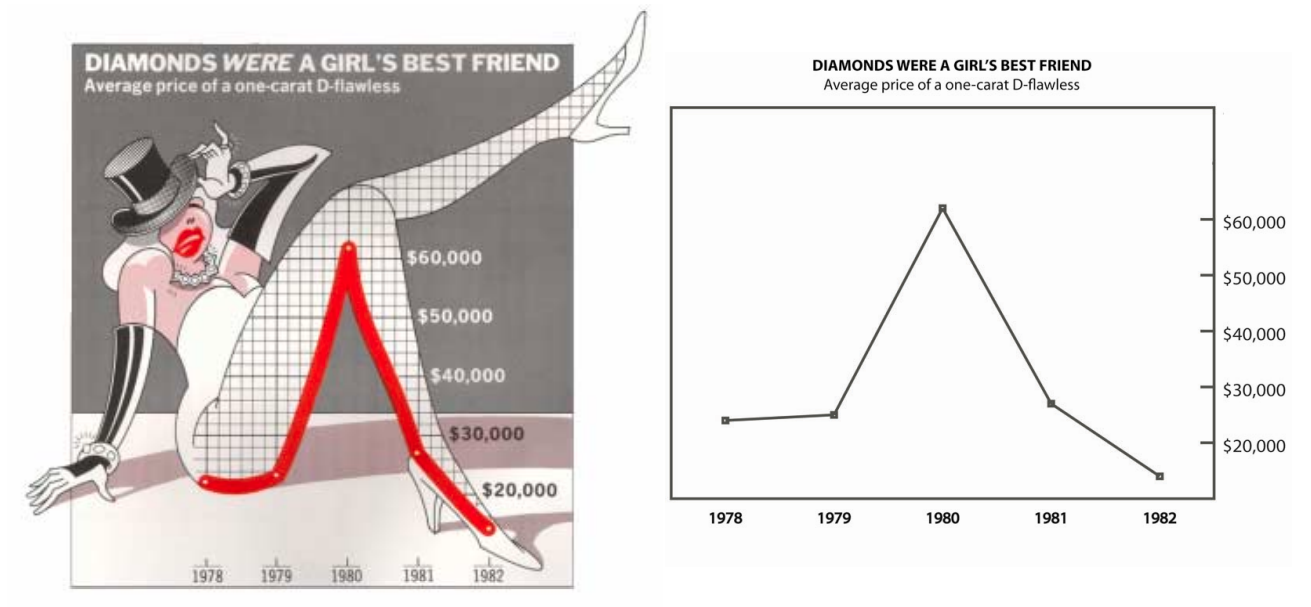
Examples of Holmes’ work
Useful junk?
Run an experiment!
Experimental protocol
- Compared chartjunk versions of graphs to standard/minimalist versions of graphs
- Tested individuals on chart description and recall
- 20 subjects split into short and long-term recall groups
Measures
- Response scores - did the individual correctly read/interpret the chart?
- Preferences - which type of chart did the individual prefer? Standard or embellished?
- Gaze data - where did the subject look during the experiment? At data regions or embellishment regions?
Results
- Chartjunk did not improve or hinder comprehension
- Chartjunk did not improve or hinder immediate recall
- Chartjunk slightly improved long-term recall
- Participants preferred the Holmes charts
- More attractive
- More enjoyable
- Easiest and fastest to remember
Rethinking Tufte’s definition of visual excellence
- Most of Tufte’s claims lack any evidence to support them
- Pursuit of an objective truth - is truth absolute?
- Chartjunk can be eye-catching and memorable (maybe even beautiful?)
Wrap up
Recap
- Edward Tufte’s view on graphical excellence - “Above all else show the data”
- Maximizing the data-ink ratio leads to potentially clear, effective charts for academics
- “Chartjunk” can be eye-catching and memorable
- The usefulness of chartjunk is debateable
