How Charts Lie
Lecture 14
March 16, 2023
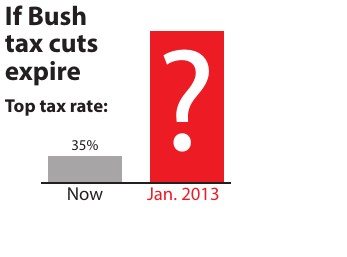
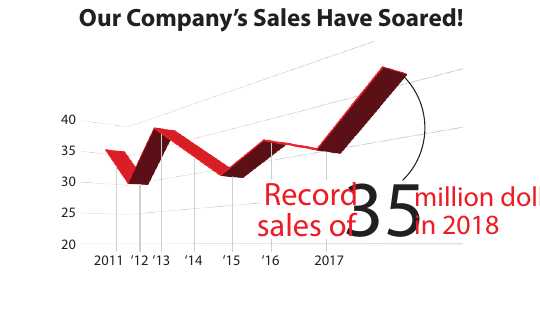
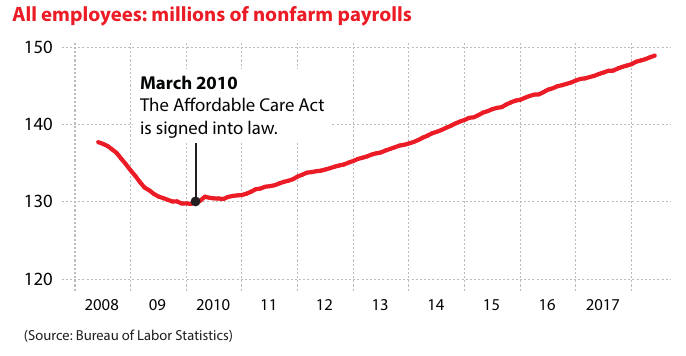
The stereotypical chart
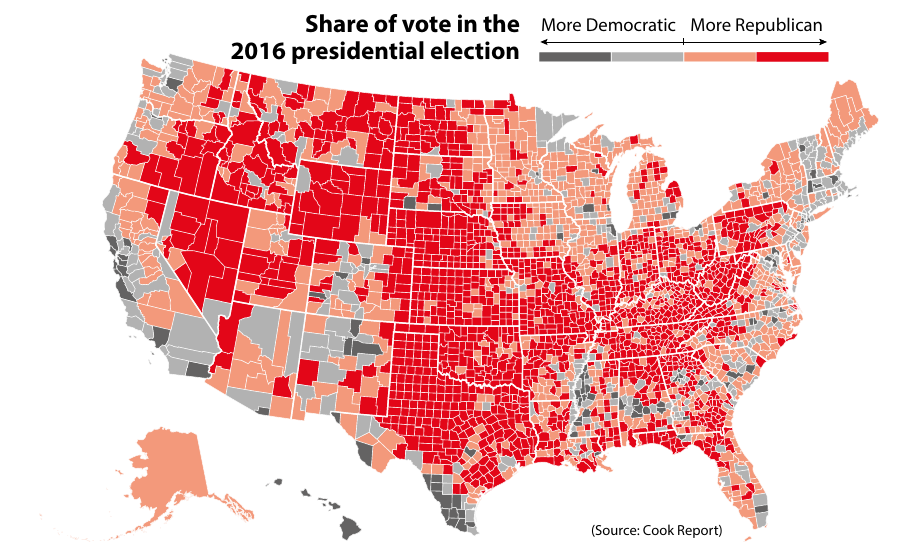
- What does this chart tell us?
- What is misleading about the chart?
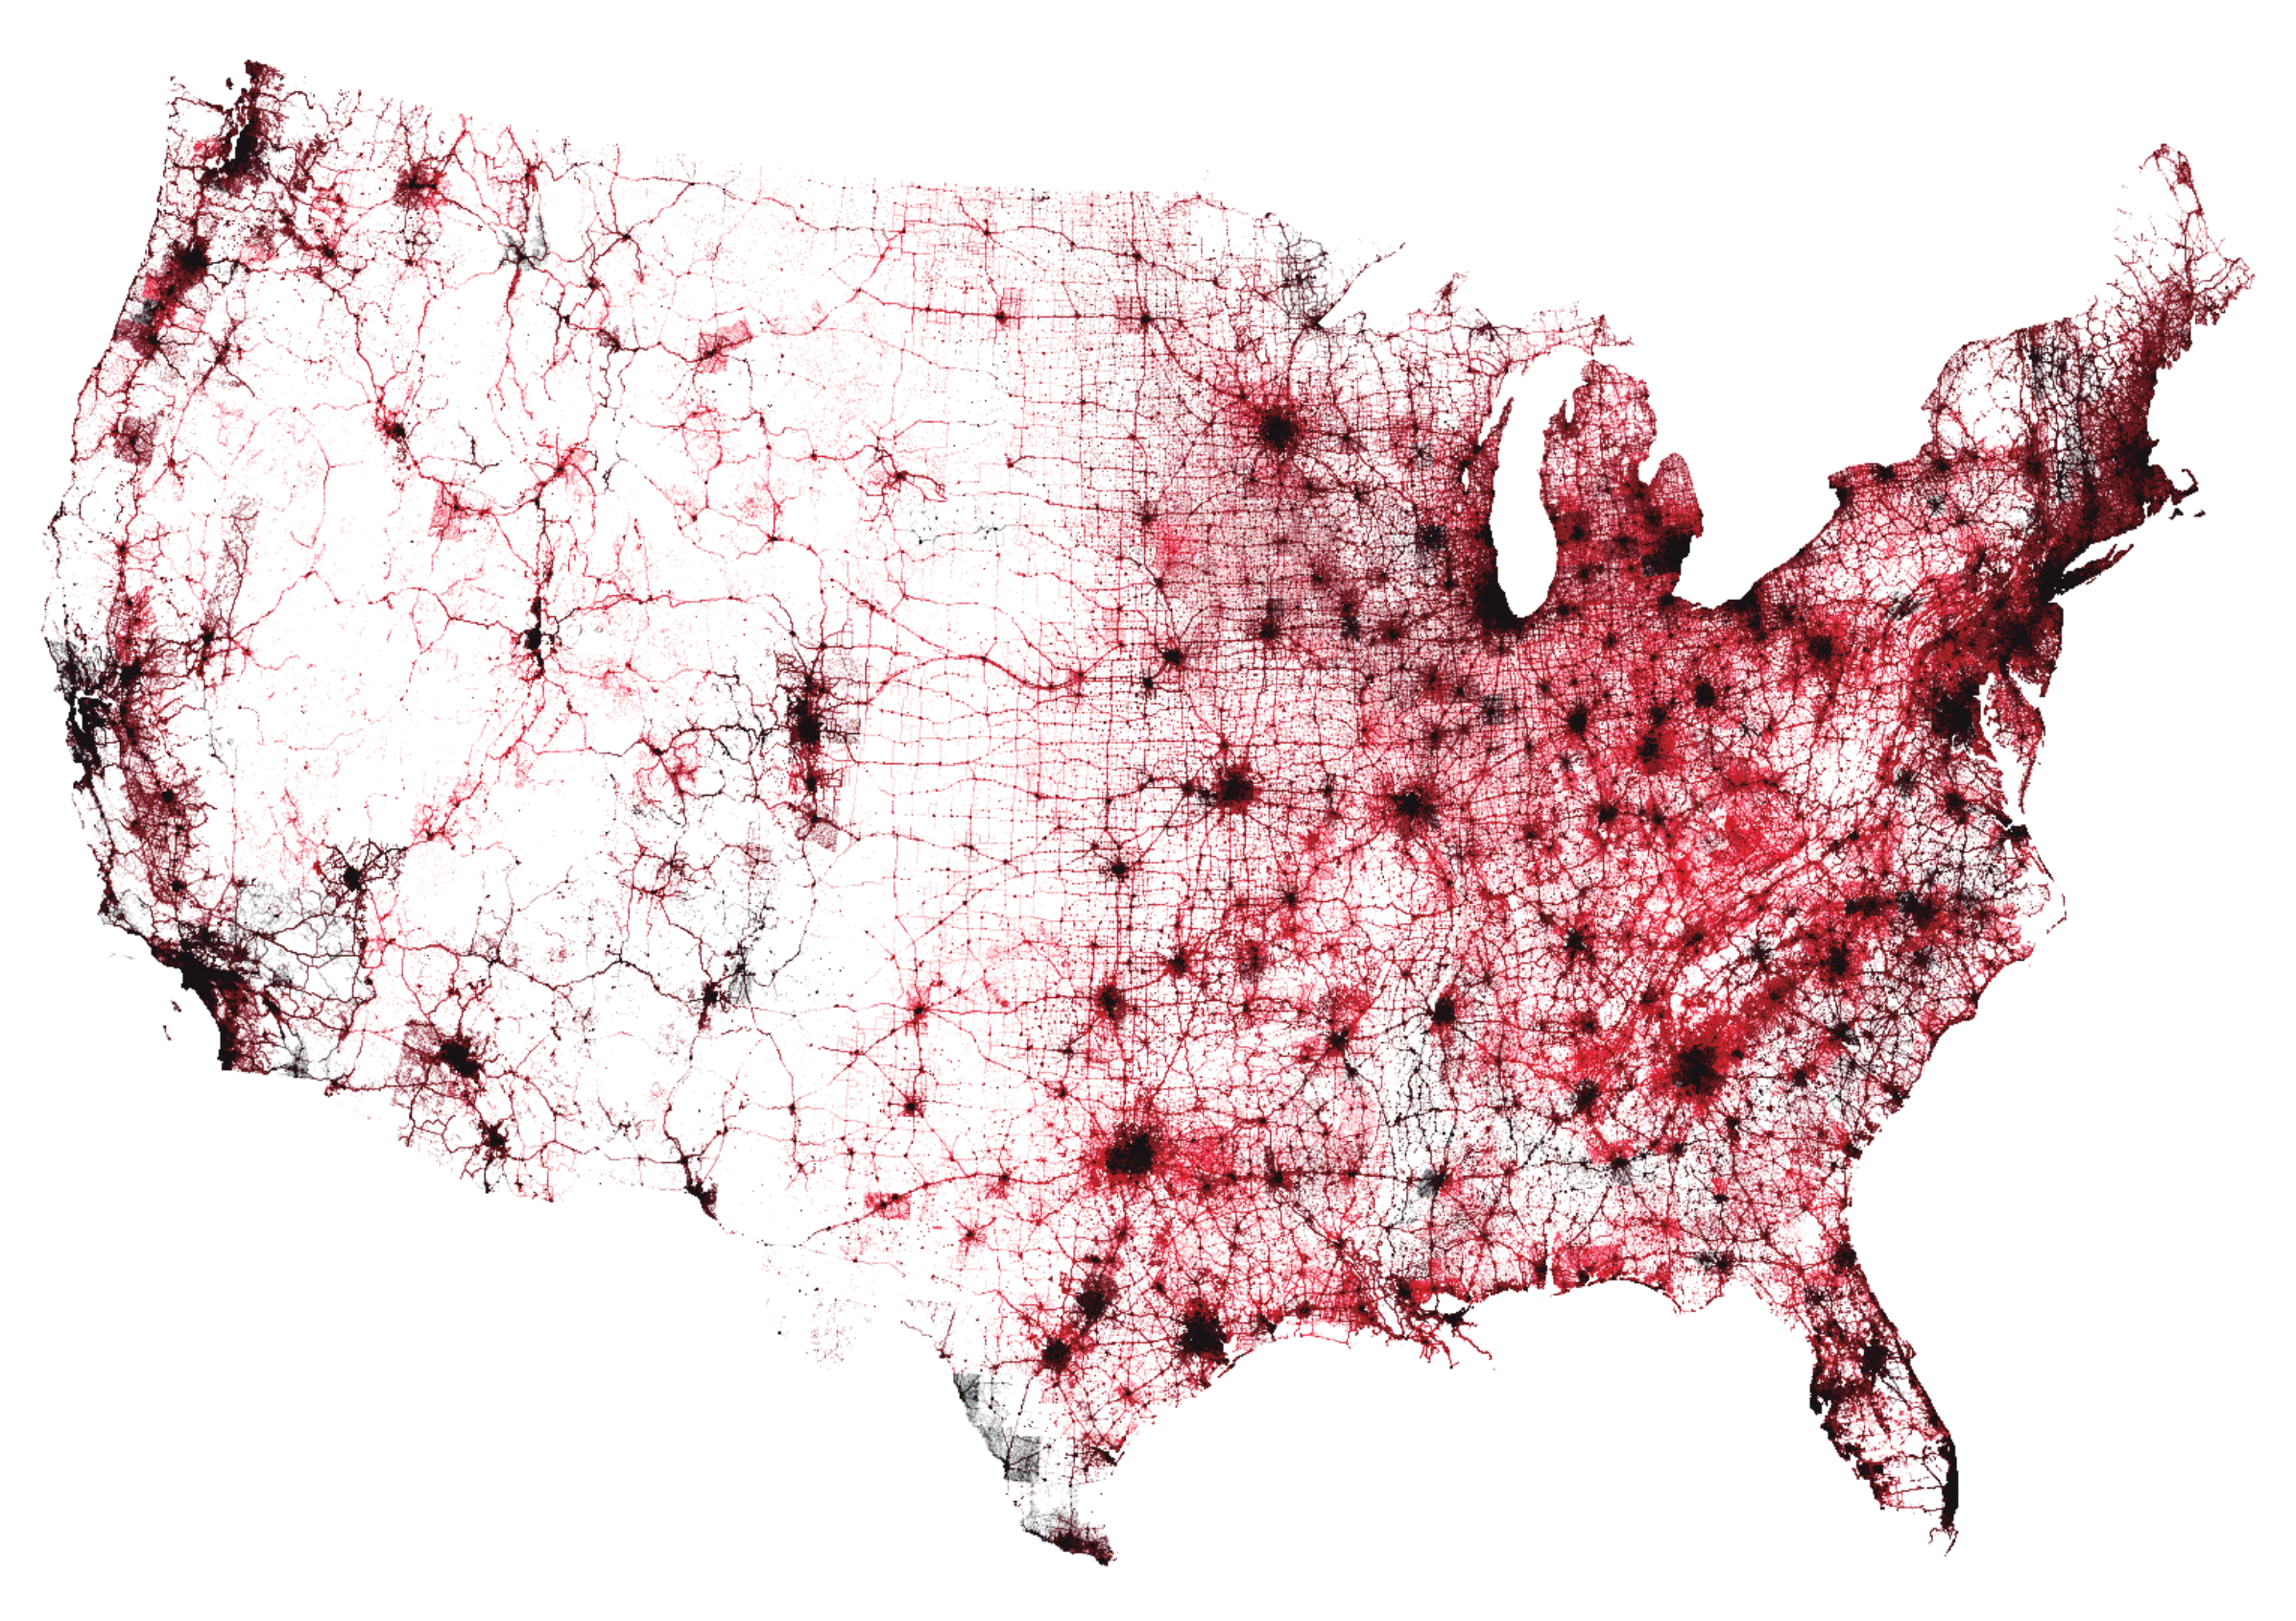
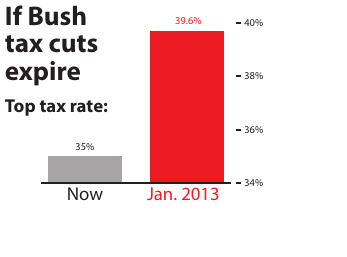
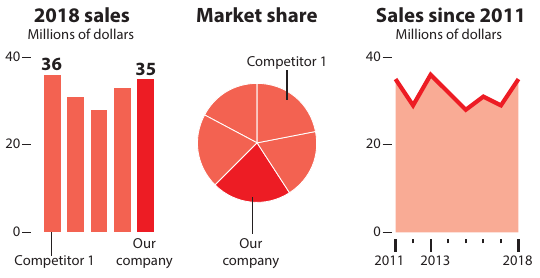
A more honest approach


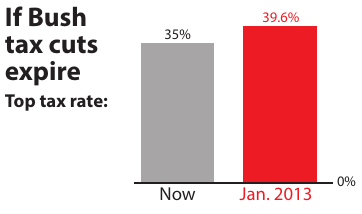
An even more honest approach?
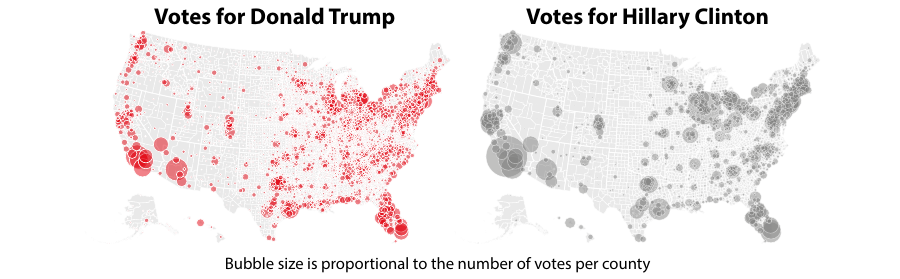
Bubble map
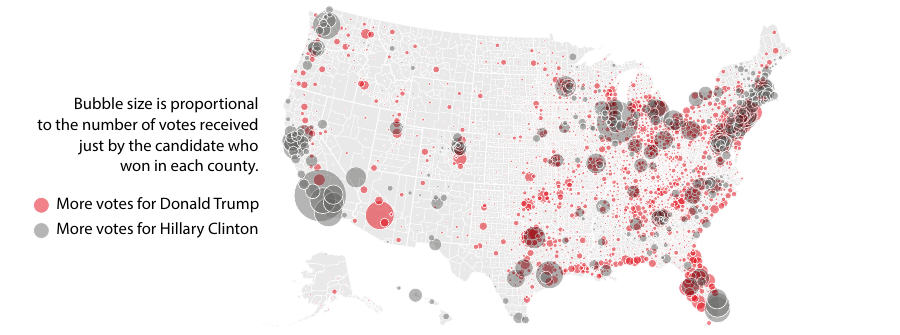
Which is more correct?
Neither
Not an adequate representation of the number of votes each candidate received
Only includes votes for the winning candidate
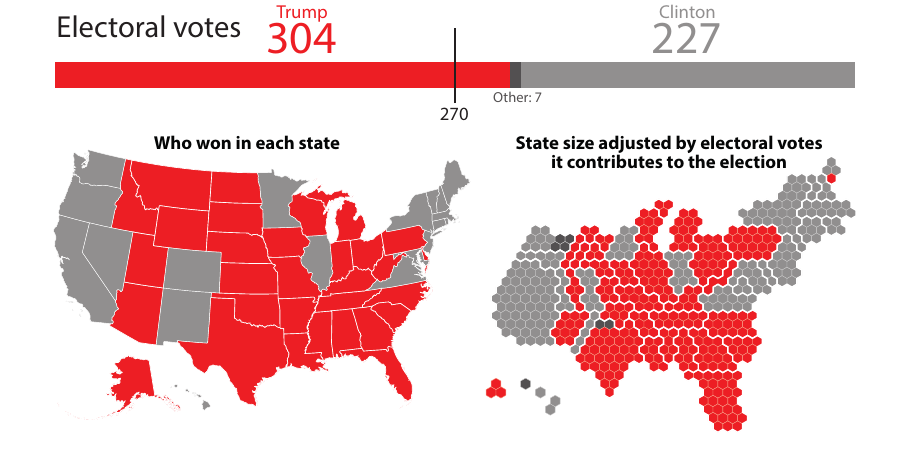
Better?
Electoral votes
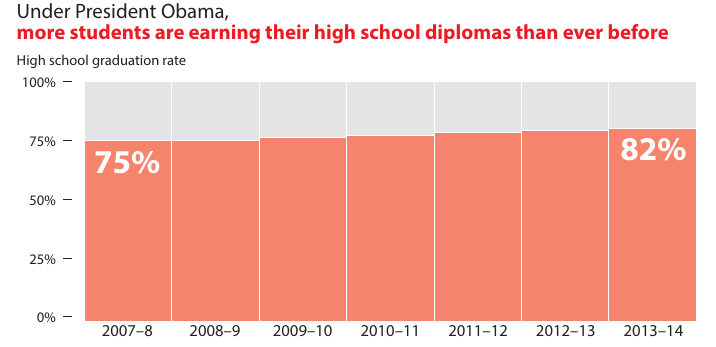
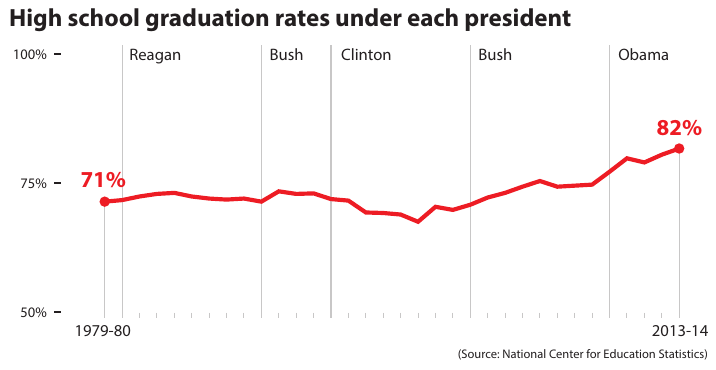
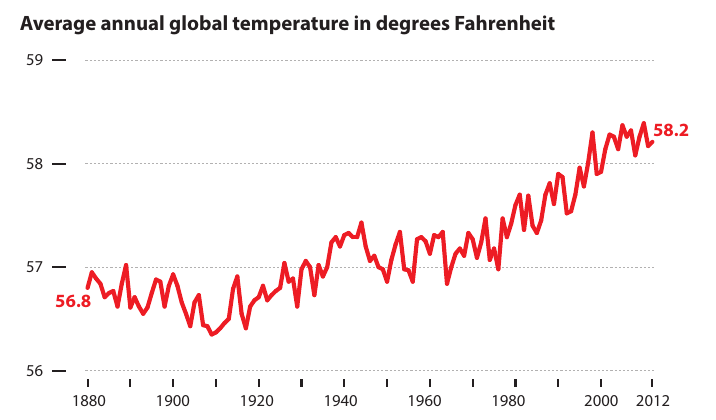
Truncated axes
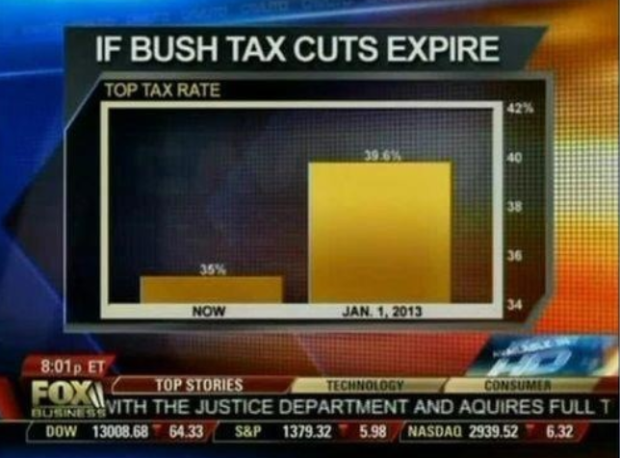
Truncated axes
Democrats do it too
Truncated \(y\)-axis
Truncated \(x\)-axis
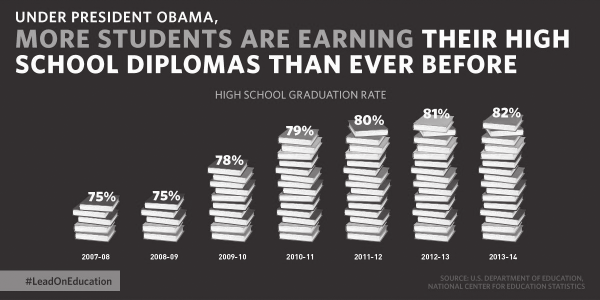
3D charts
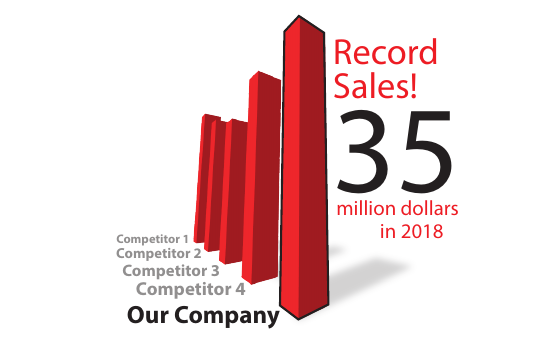
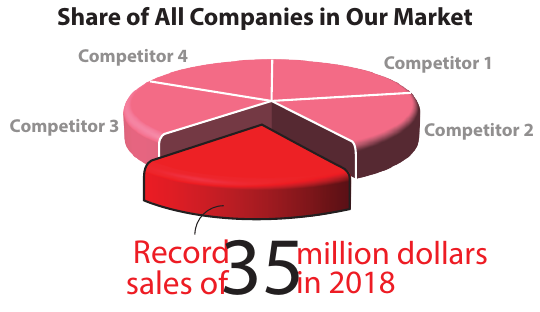
2D versions
Planned Parenthood
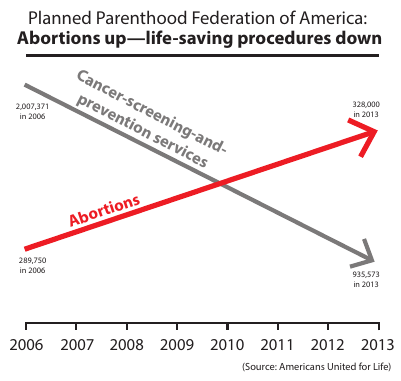
Planned Parenthood
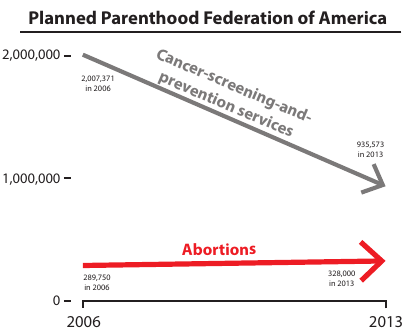
Planned Parenthood
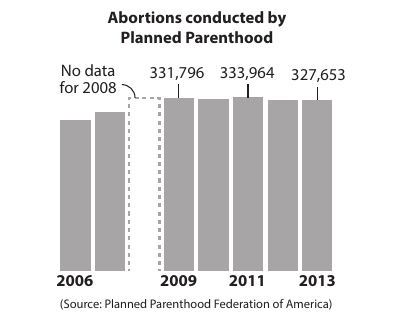
Planned Parenthood
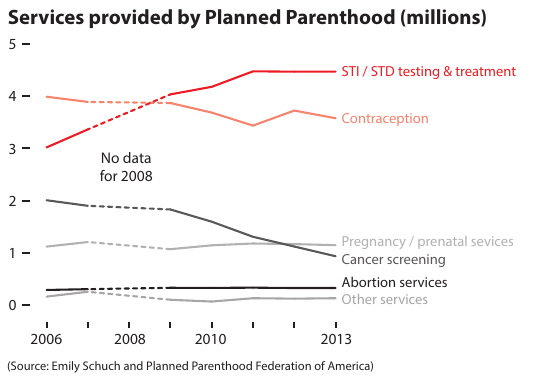
National guidelines for the frequency of cervical cancer screenings were officially changed in 2012, but the American College of Obstetricians and Gynecologists started advising a reduction of frequency in 2009. Previously, women received a pap smear to screen for cervical cancer once a year, but it is now recommended that pap smears should be performed every three years.
Baseline of zero
Baseline of zero
Meaningless (or not) zero baseline
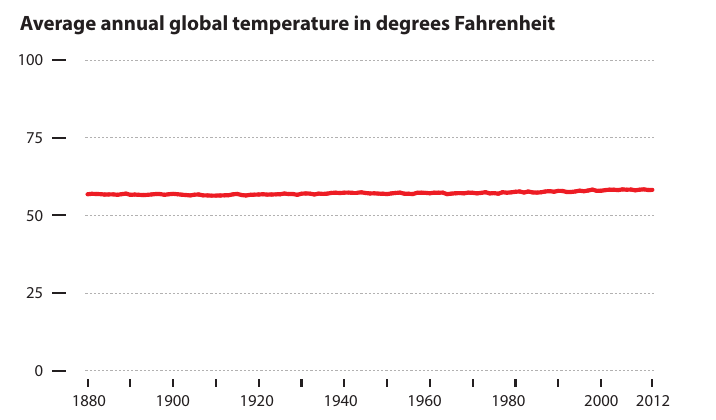
Meaningless (or not) zero baseline
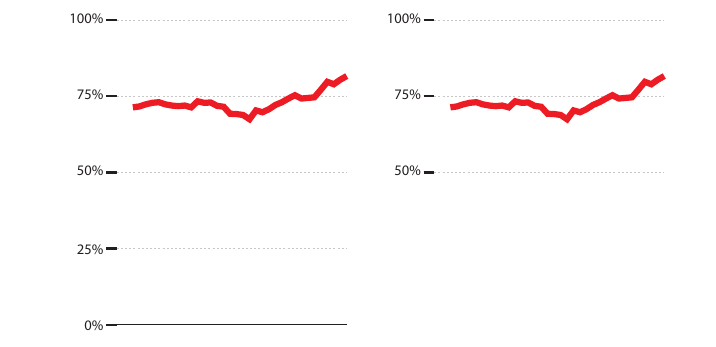
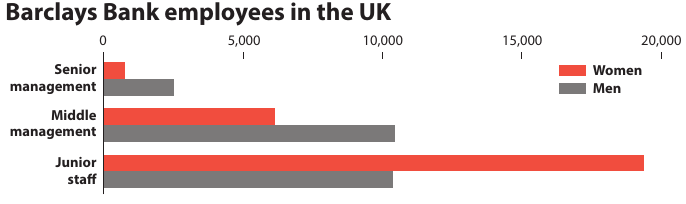
Gender wage gap


Gender pay gap
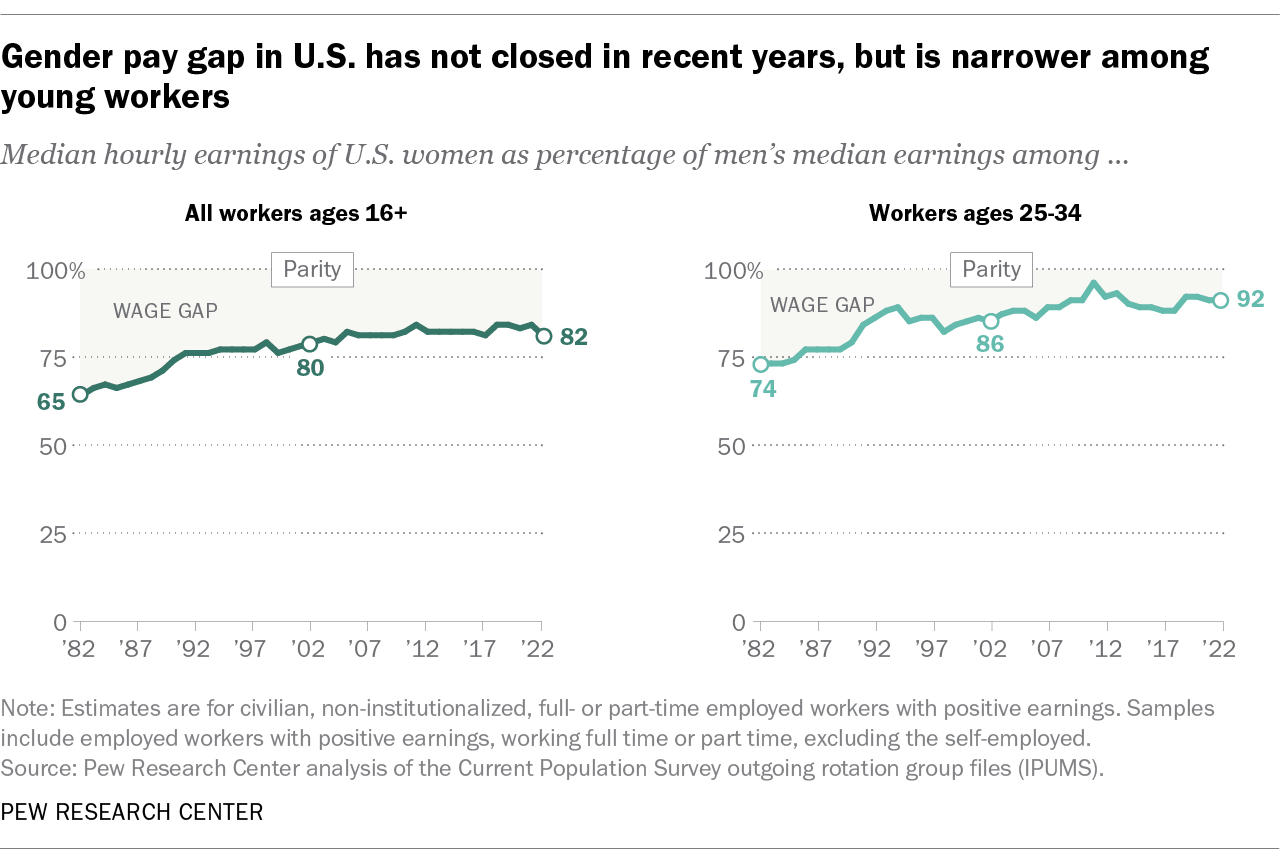
Gender pay gap
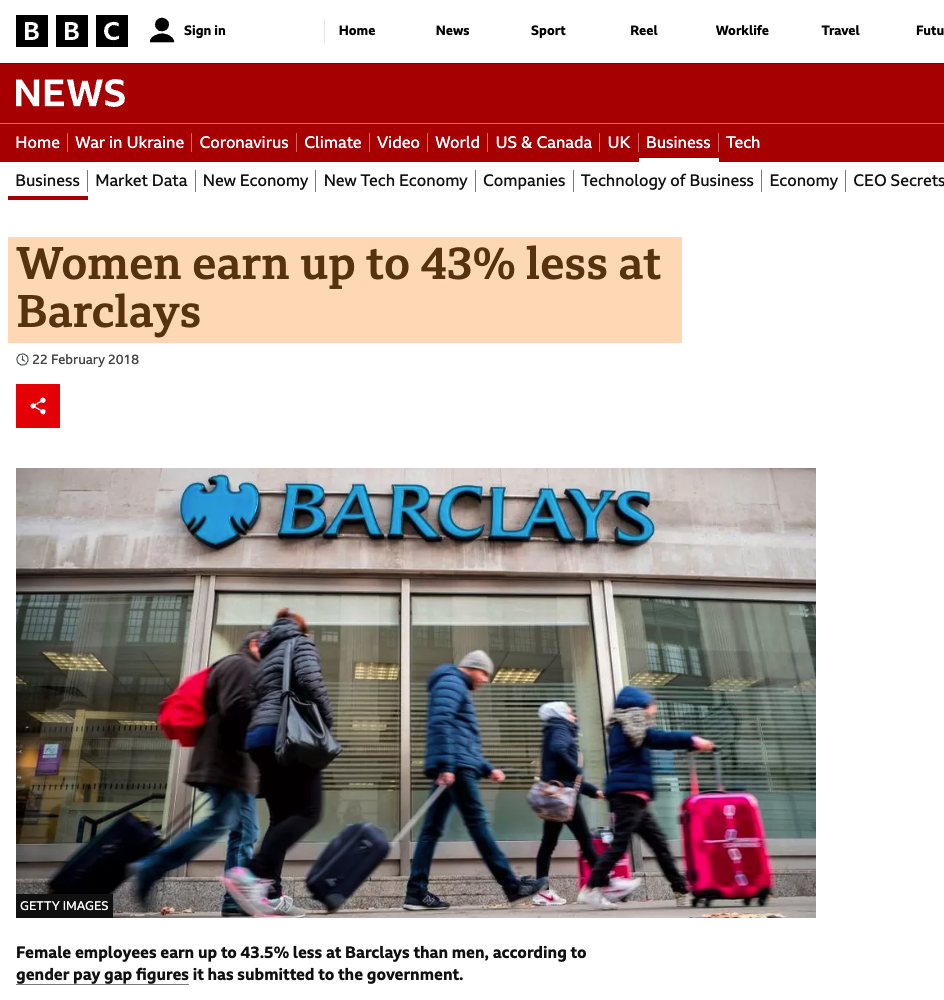
What causes the pay gap?
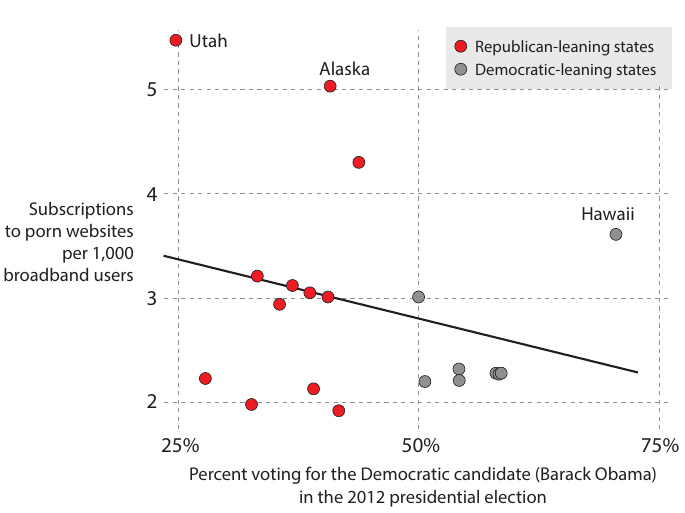
Porn in red states

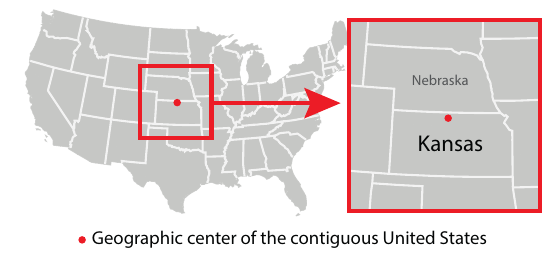
Where’s Kansas?
Who pays for porn?

Immigrants and crimes
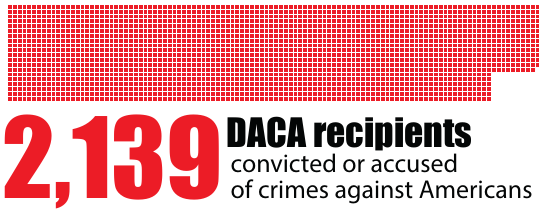
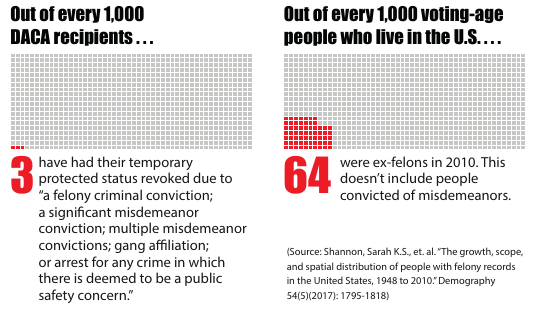
Is this high or low?
As Attorney General Jeff Sessions announced the end of the Obama-created Deferred Action for Childhood Arrivals (DACA), from which more than 800,000 un-vetted young illegal aliens have been given protected status and work permits, the number of them who are convicted criminals, gang members, or suspects in crimes remains staggering.
What is a reasonable comparable? Entire U.S. population
Immigrants and crimes
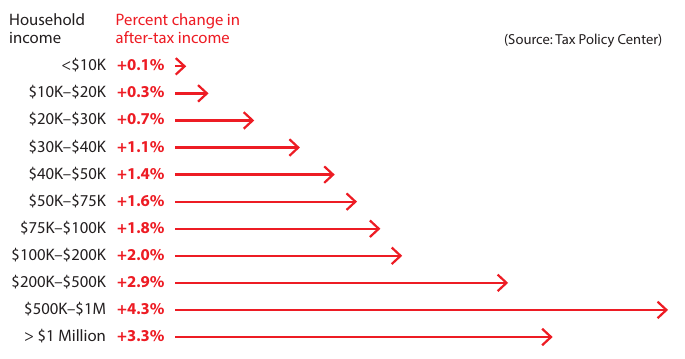
Tax cuts (again)
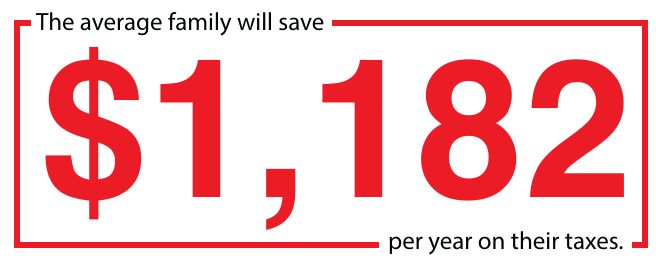
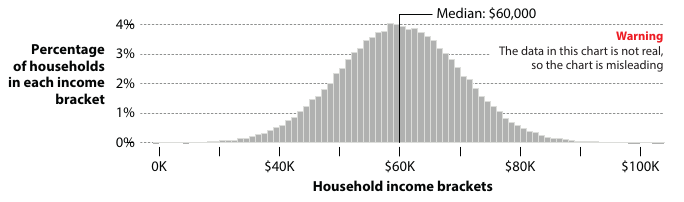
- What’s an average family?
- How many families are similar to the average?
Normally distributed household incomes
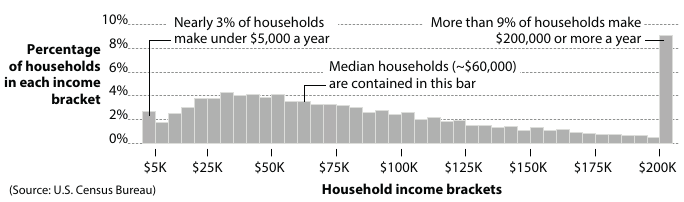
Actual distribution of household incomes
Distribution of tax benefits
Box office revenue
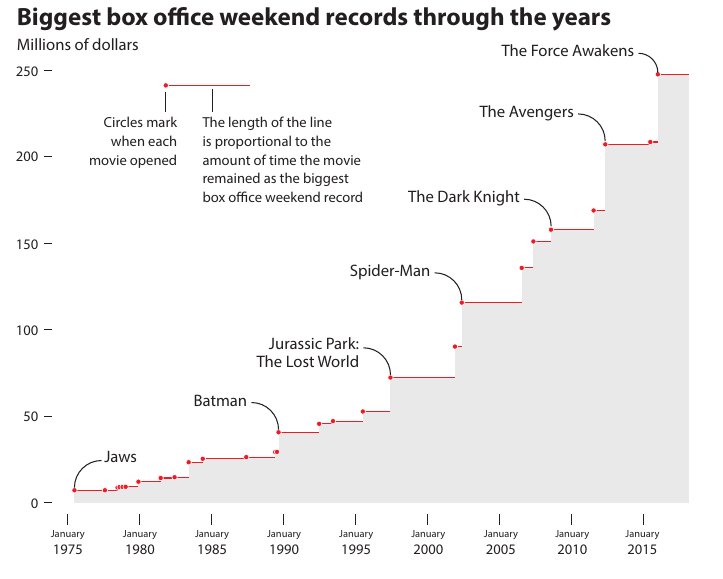
Box office revenue
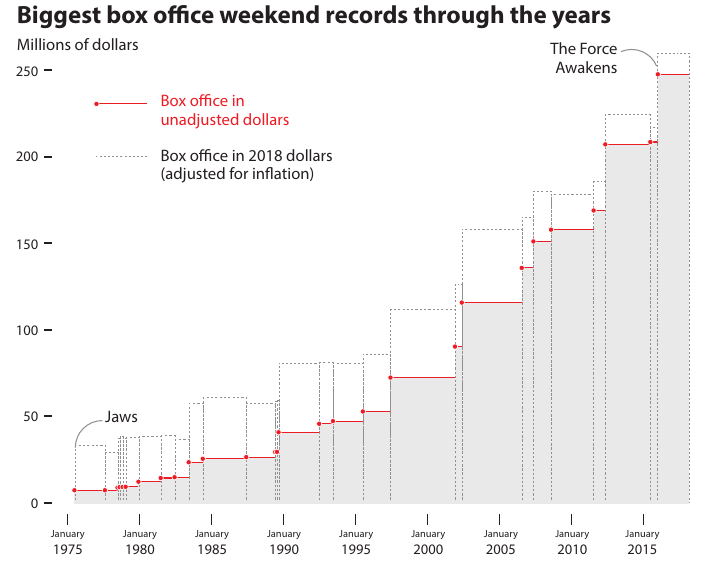
Unadjusted variables

Adjusted values
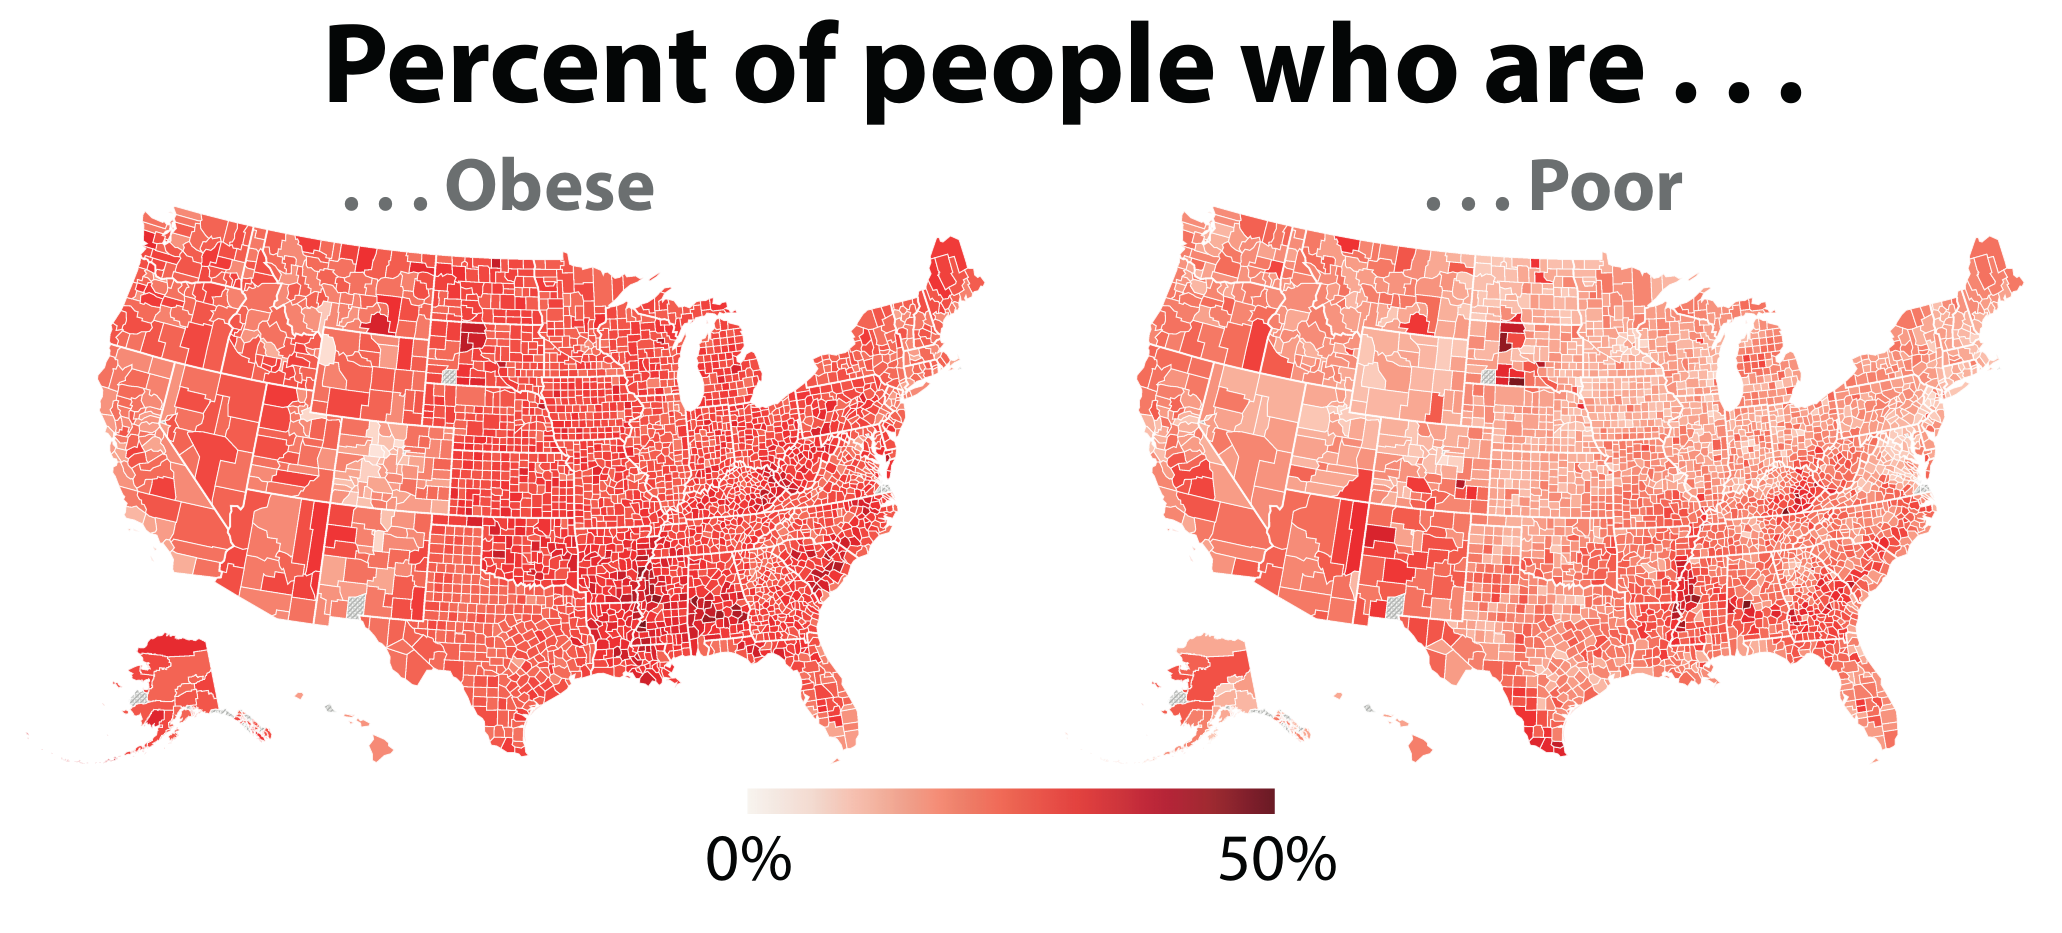
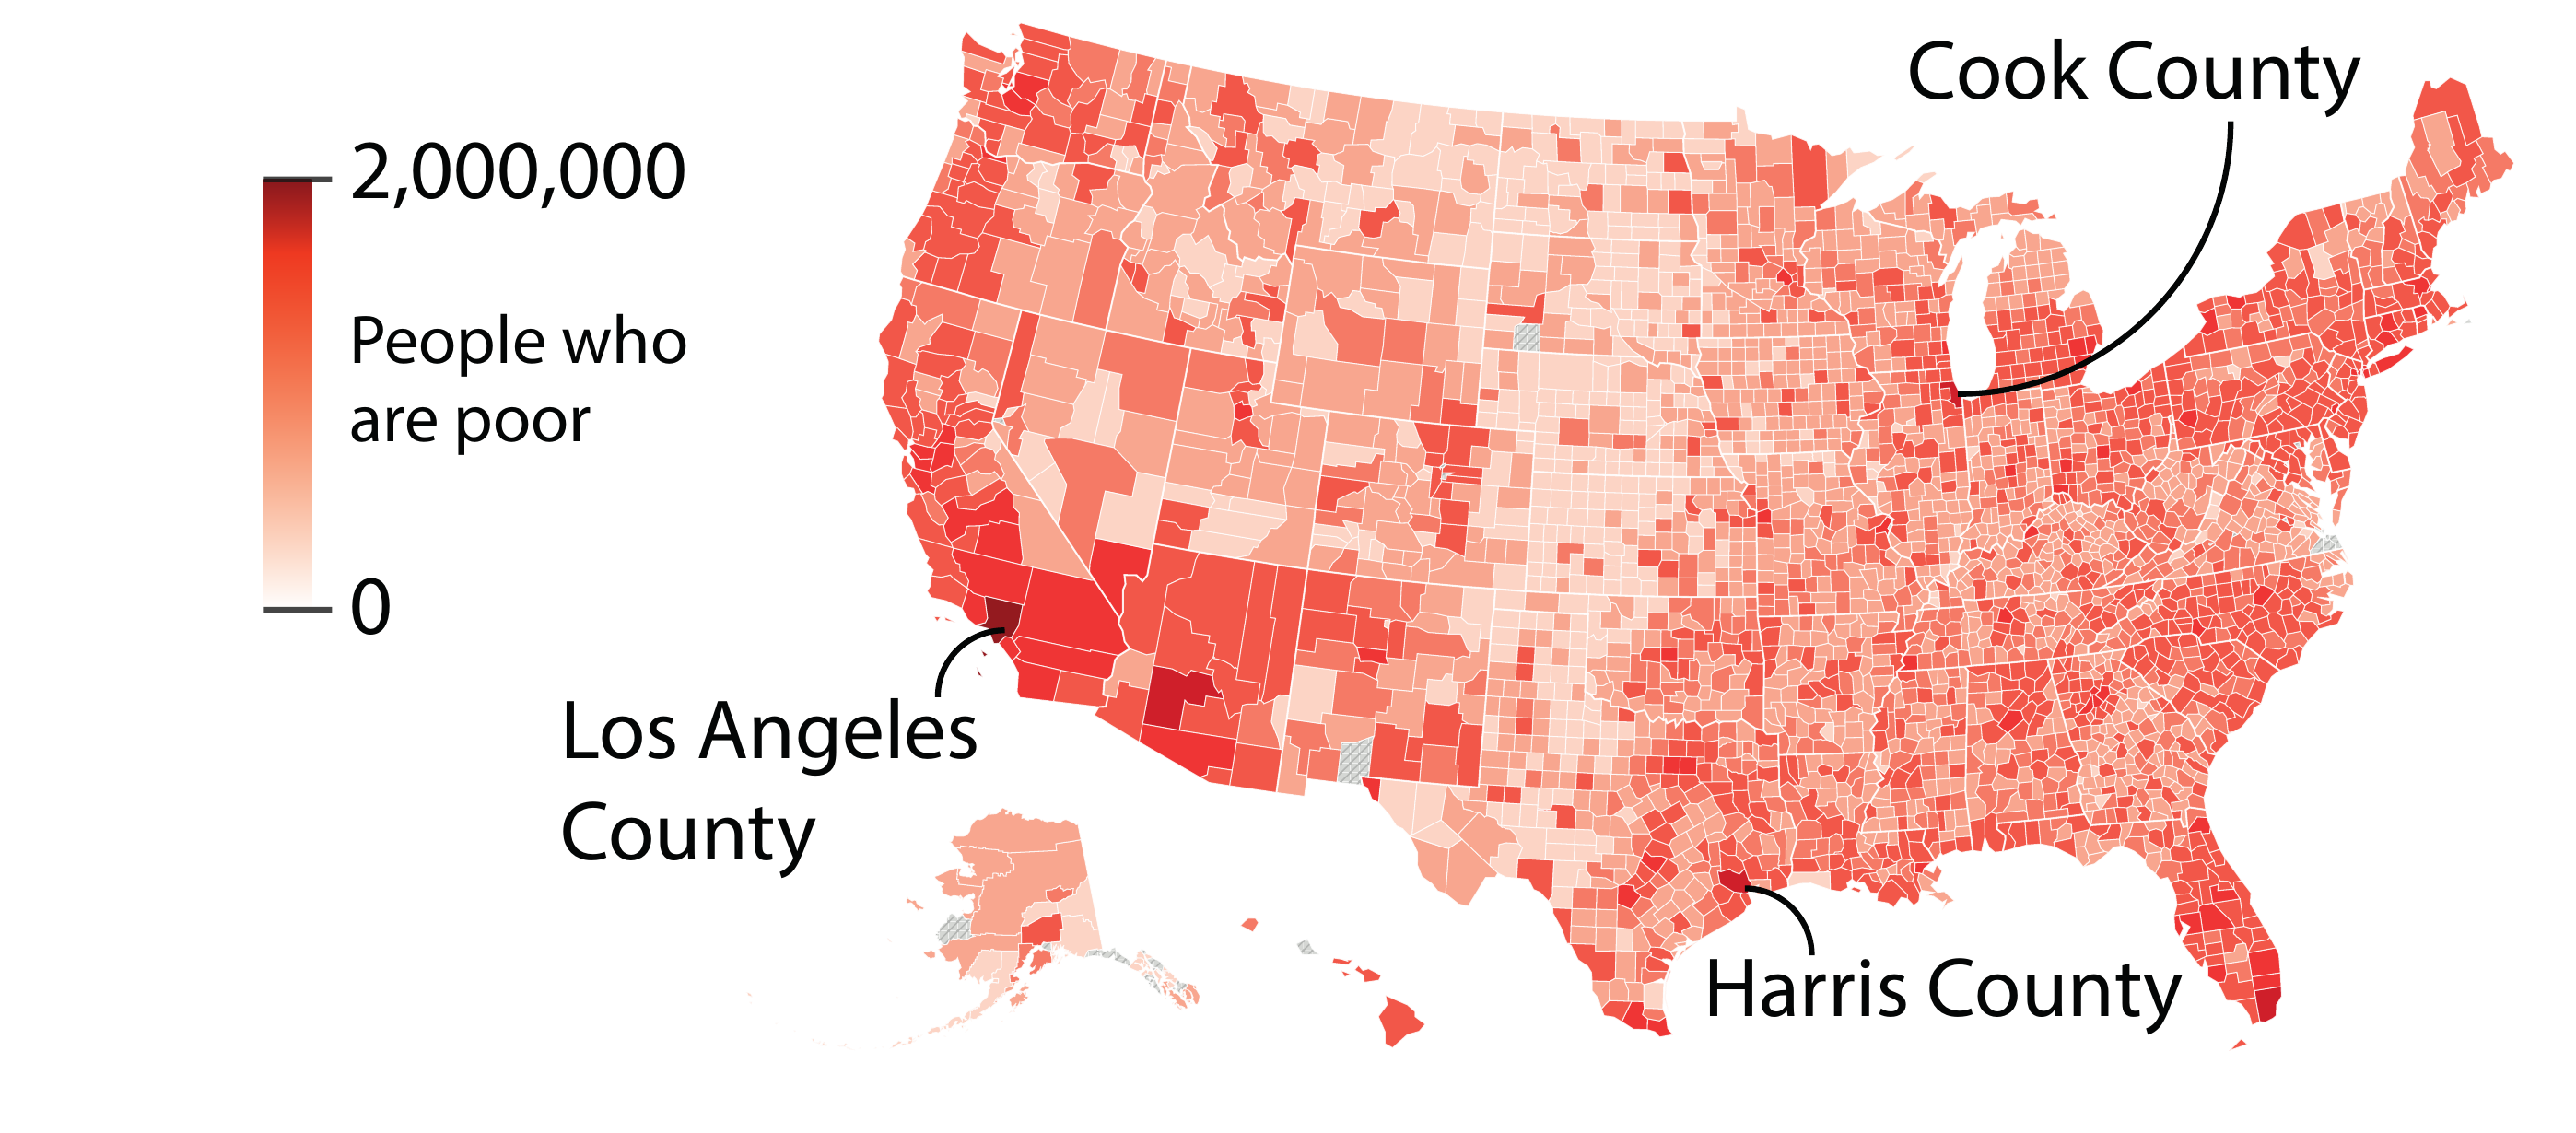
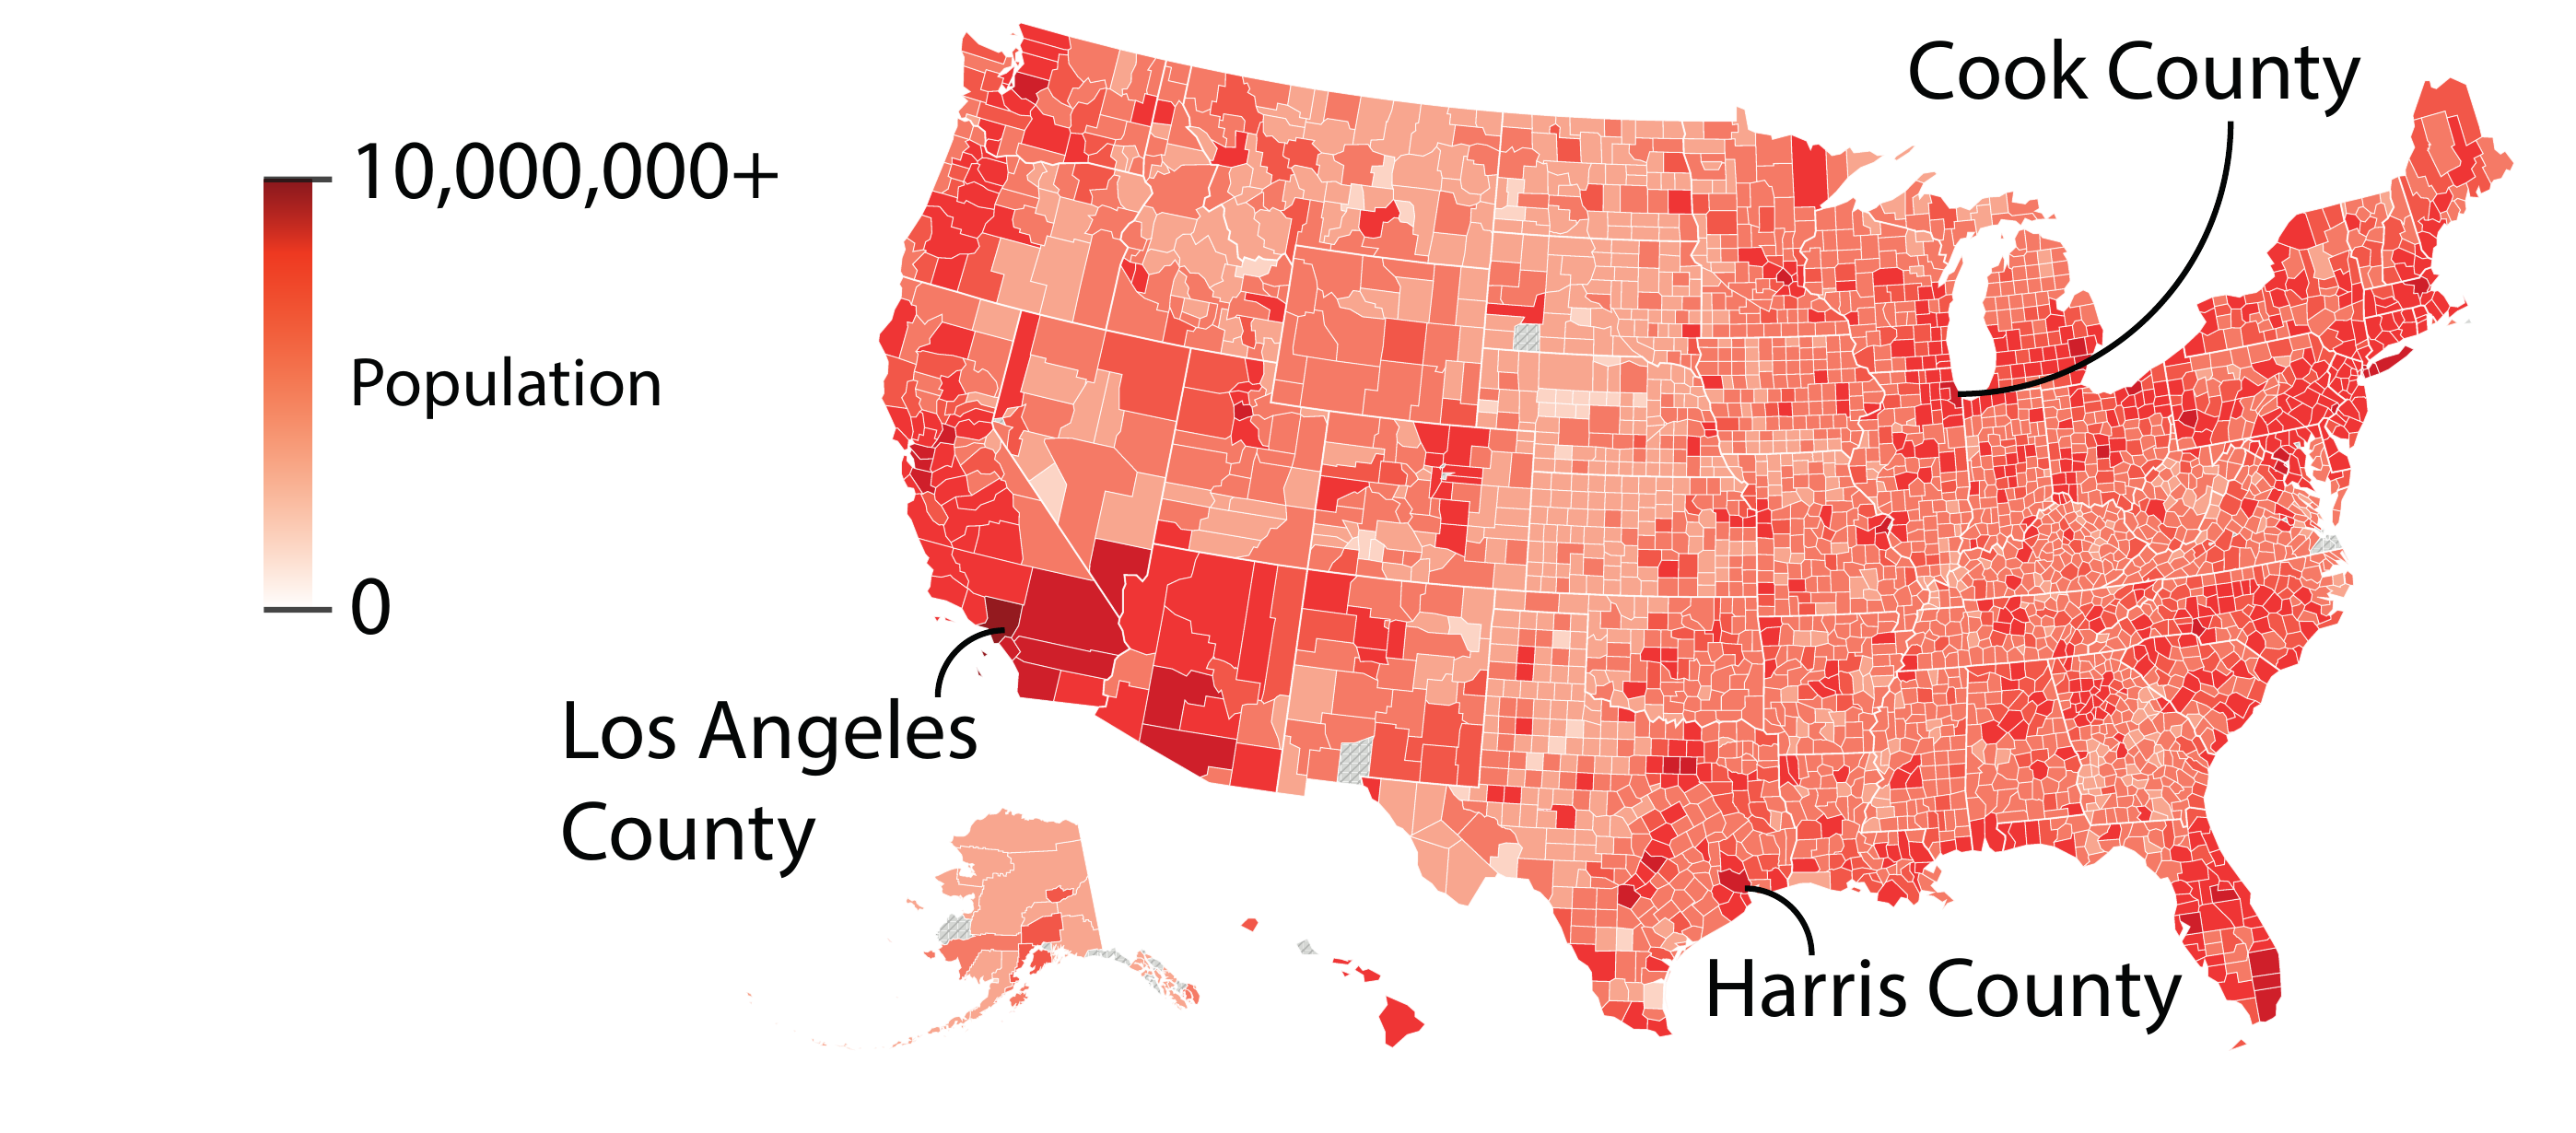
Don’t assume geographic data needs a map

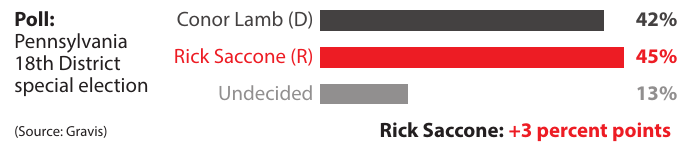
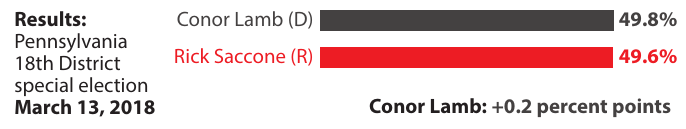
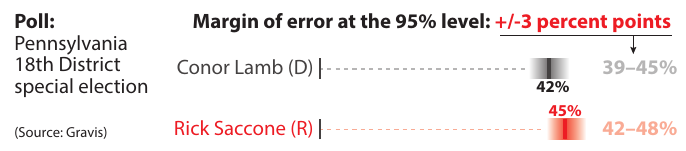
Election polling
Visualizing uncertainty
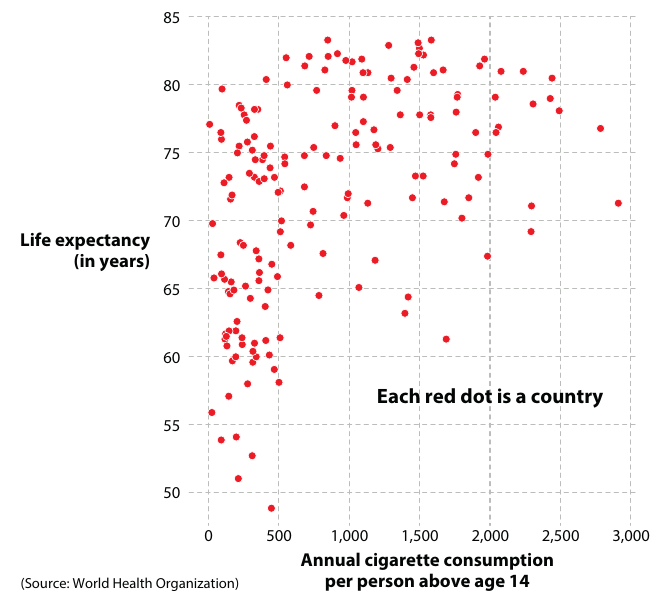
Spurious correlations

Spurious correlations

Spurious correlations

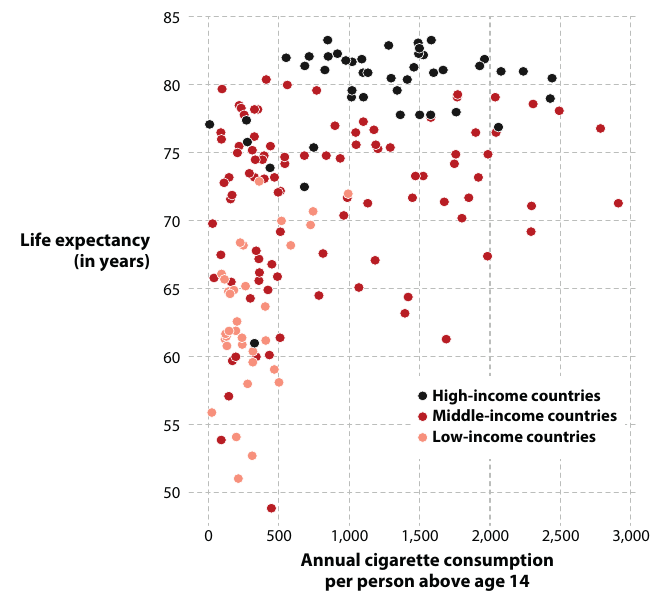
Amalgamation paradox
Amalgamation paradox
Amalgamation paradox
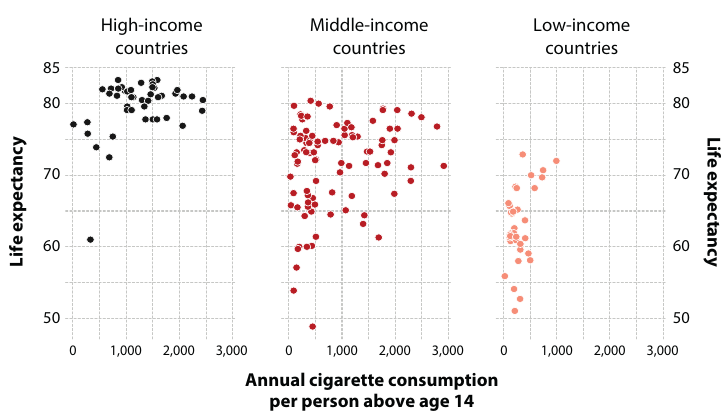
Amalgamation paradox
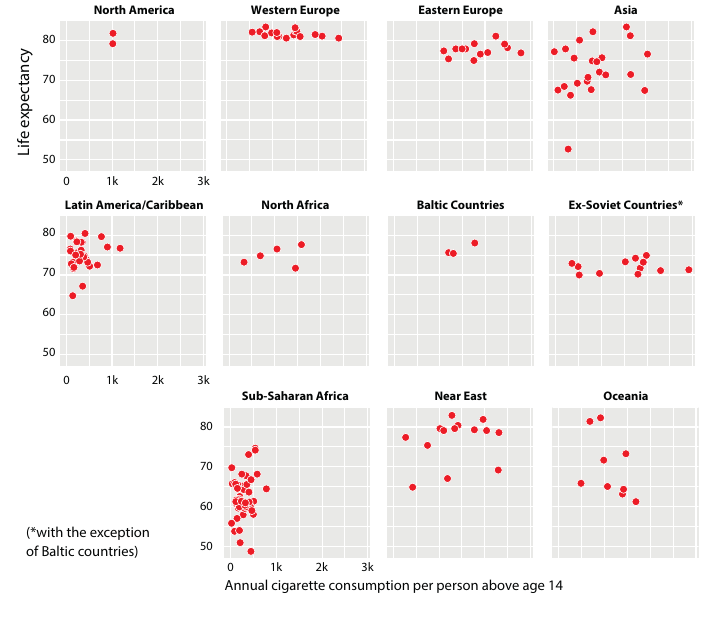
Ecological fallacy
Ecological fallacy
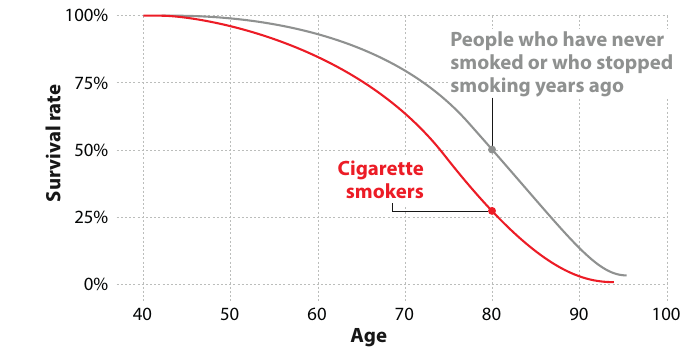
Omitting known unknowns
Omitting known unknowns
