Project 01 work session

Lecture 12

Dr. Benjamin Soltoff

Cornell University
INFO 3312/5312 - Spring 2026

March 3, 2026

Announcements

Announcements

  • Project 01 due by start of class on Thursday
  • Presentations begin in class, continue in evening 6-7:30 pm in Gates 114
  • Prioritizing conflicts for prelims, lab sections, athletics, and TA meetings

Learning objectives

  • Review project 01 workflow and expectations
  • Learn how to arrange plots on a slide
  • Work on project 01 with your team

Finishing your project

Workflow

Reproducibility + organization

The easiest way to ensure reproducibility

Have a team member clone the repository to a new location, install required packages as specified in the lockfiles (i.e. renv::restore()), and try to render all Quarto files and run any R scripts. If everything runs without error, your project is (likely) reproducible!

  • Update renv.lock using renv::snapshot()
  • Use relative file paths (e.g. data/my-data.csv instead of ~/Documents/my-data.csv)
  • Use here::here() to construct file paths

Plot layout

Sample plots

library(gapminder)

gapminder_07 <- filter(.data = gapminder, year == 2007)

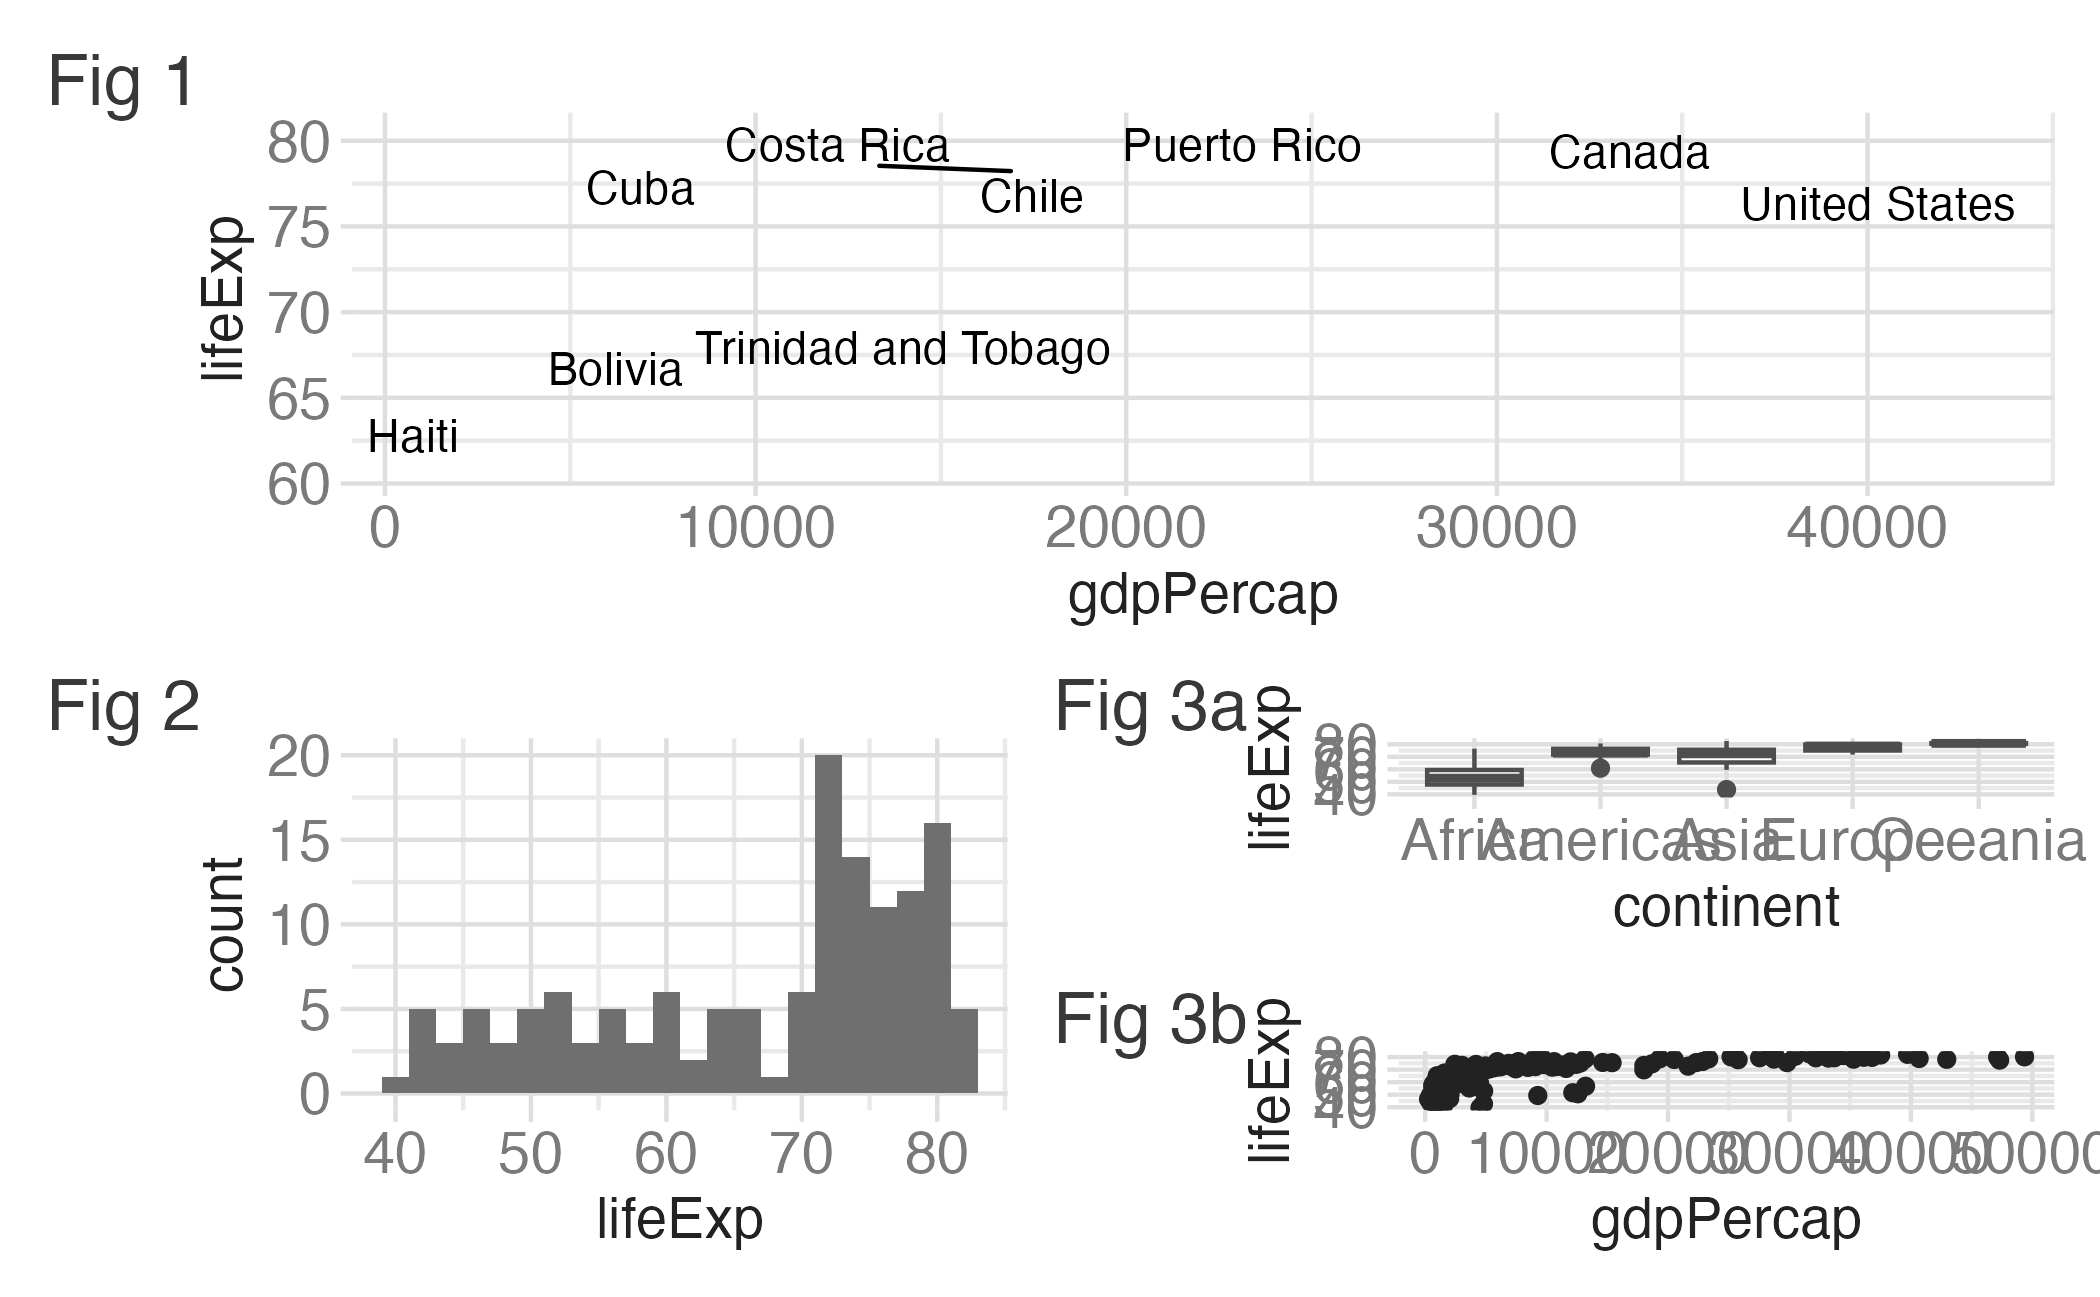
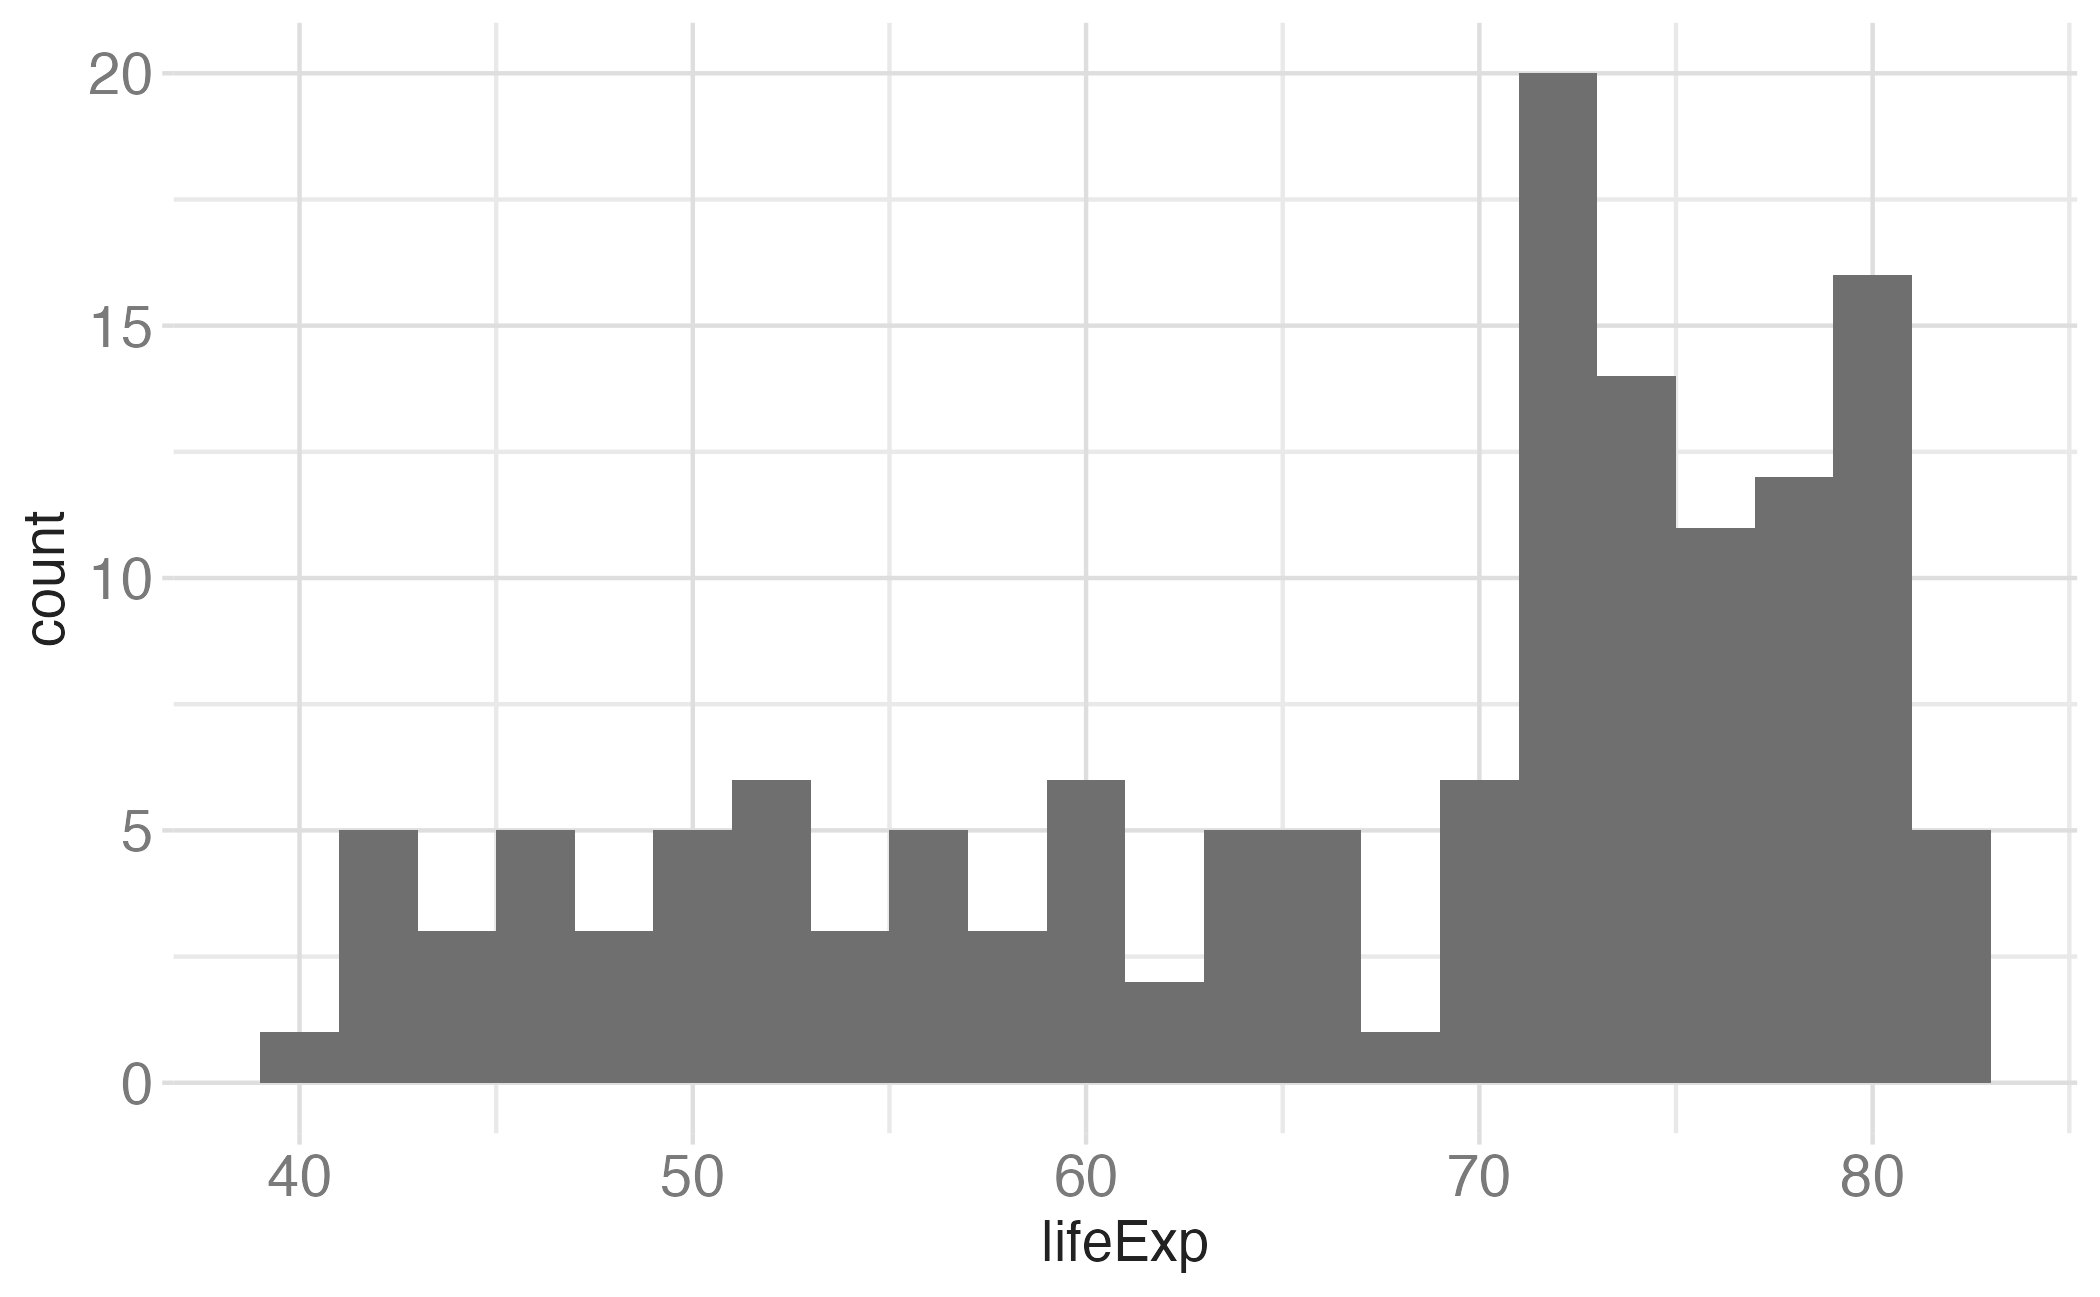
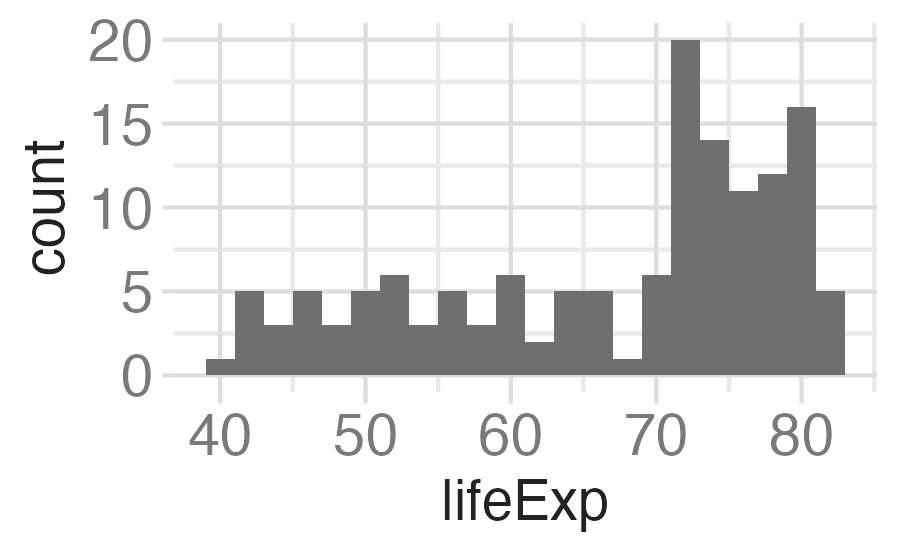
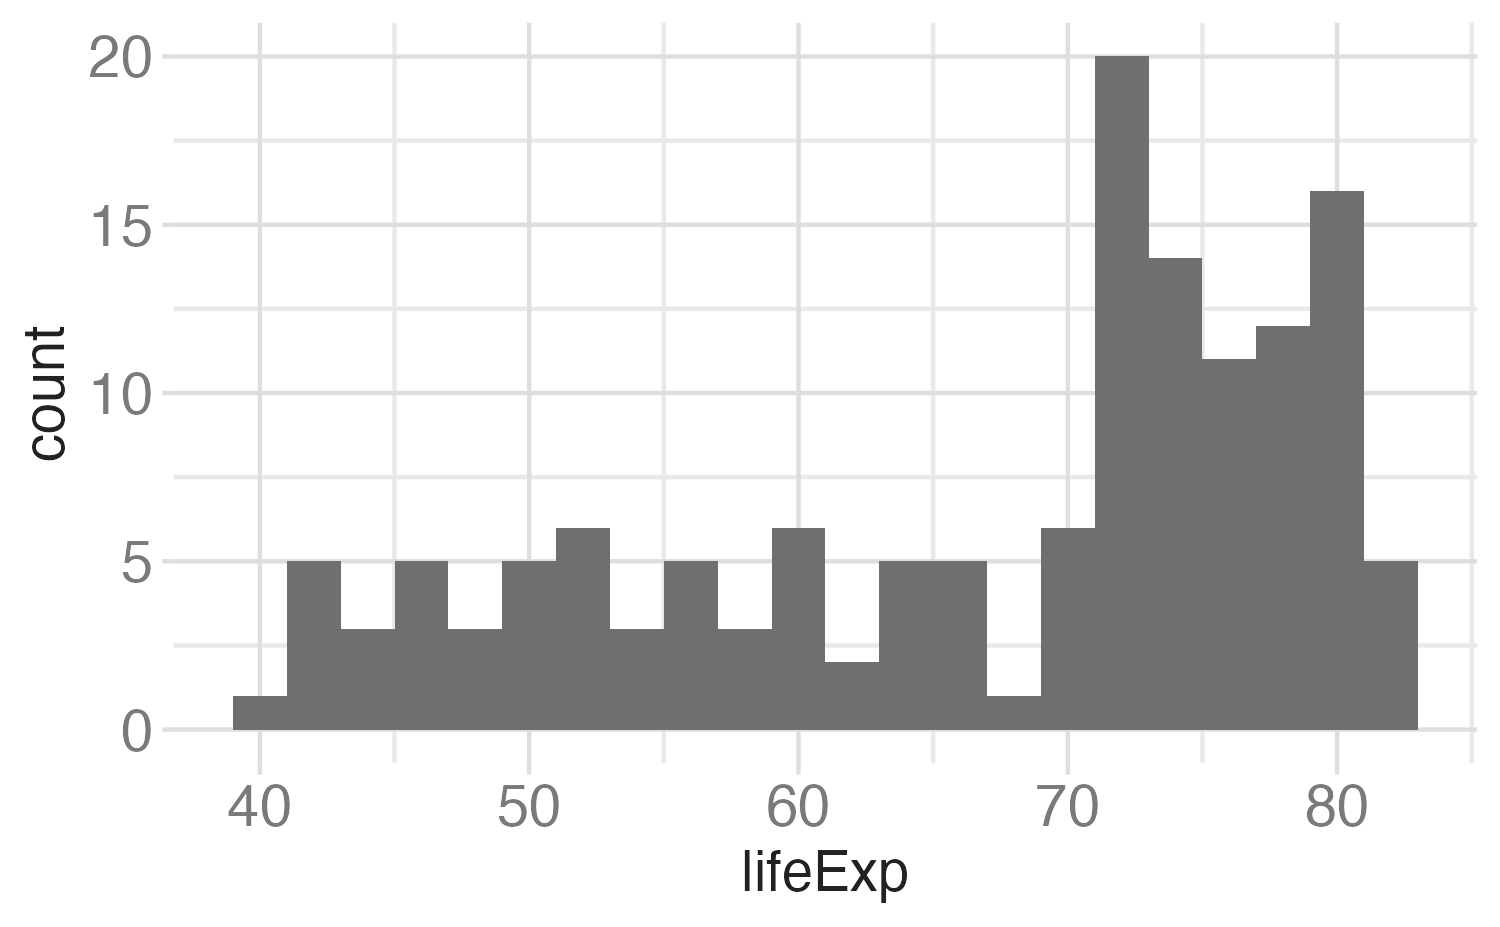
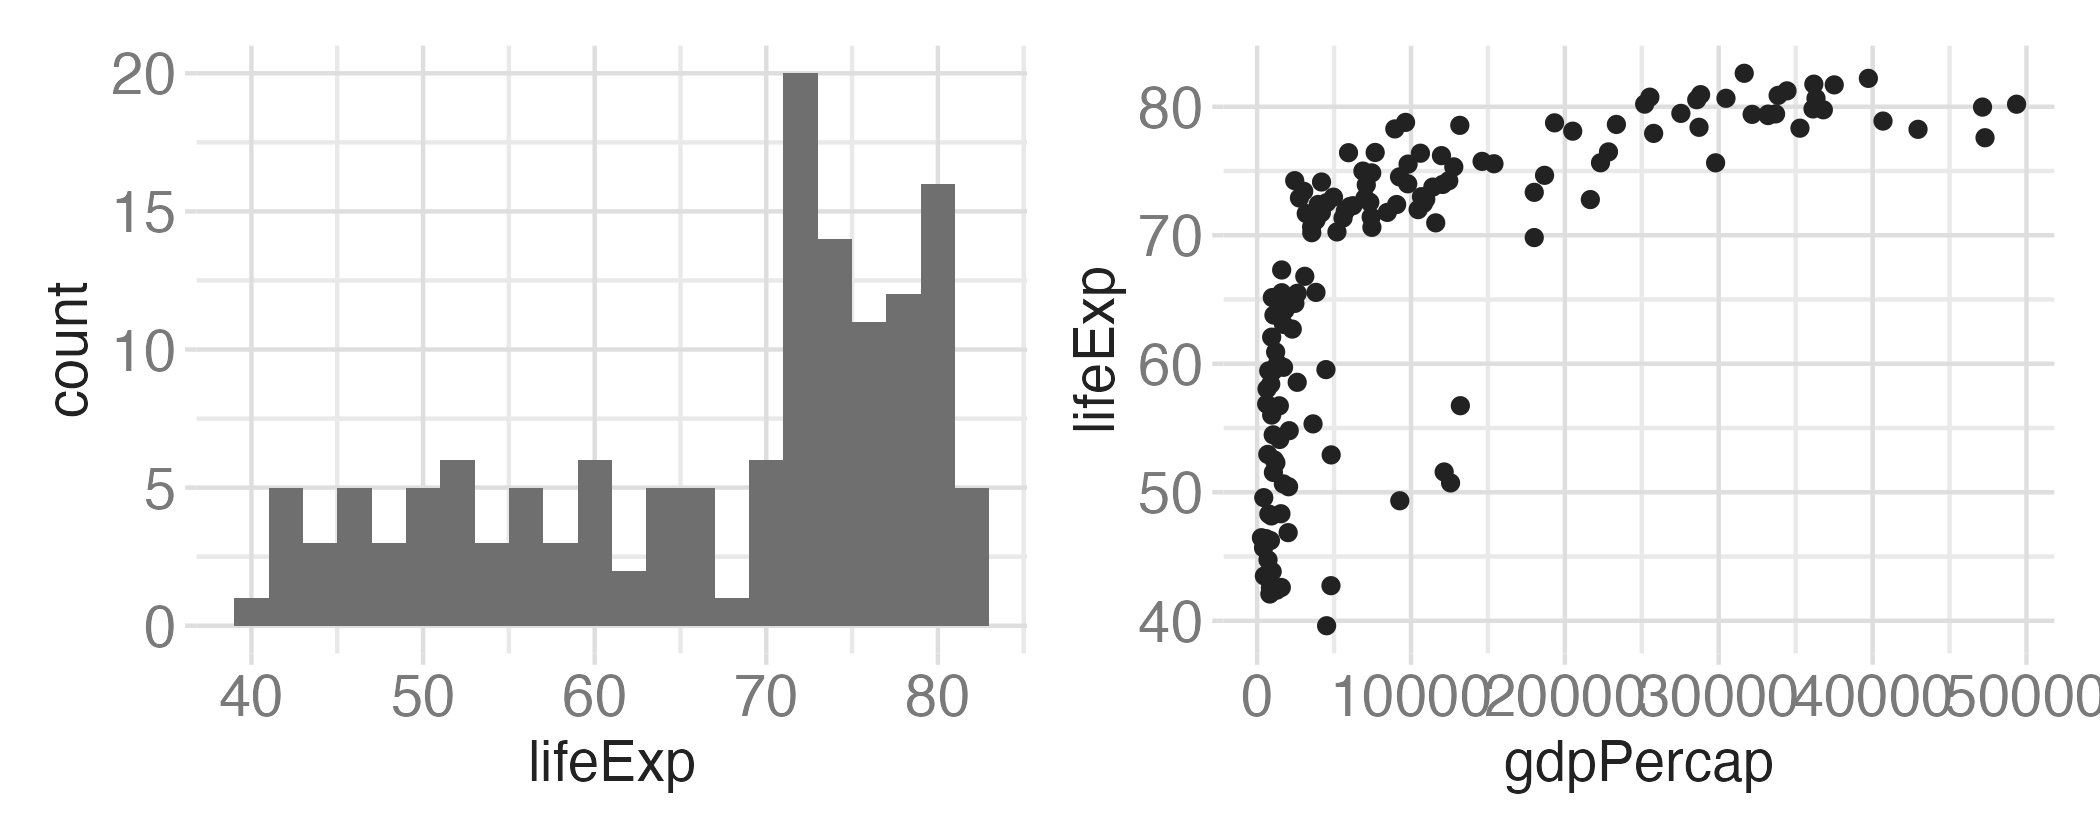
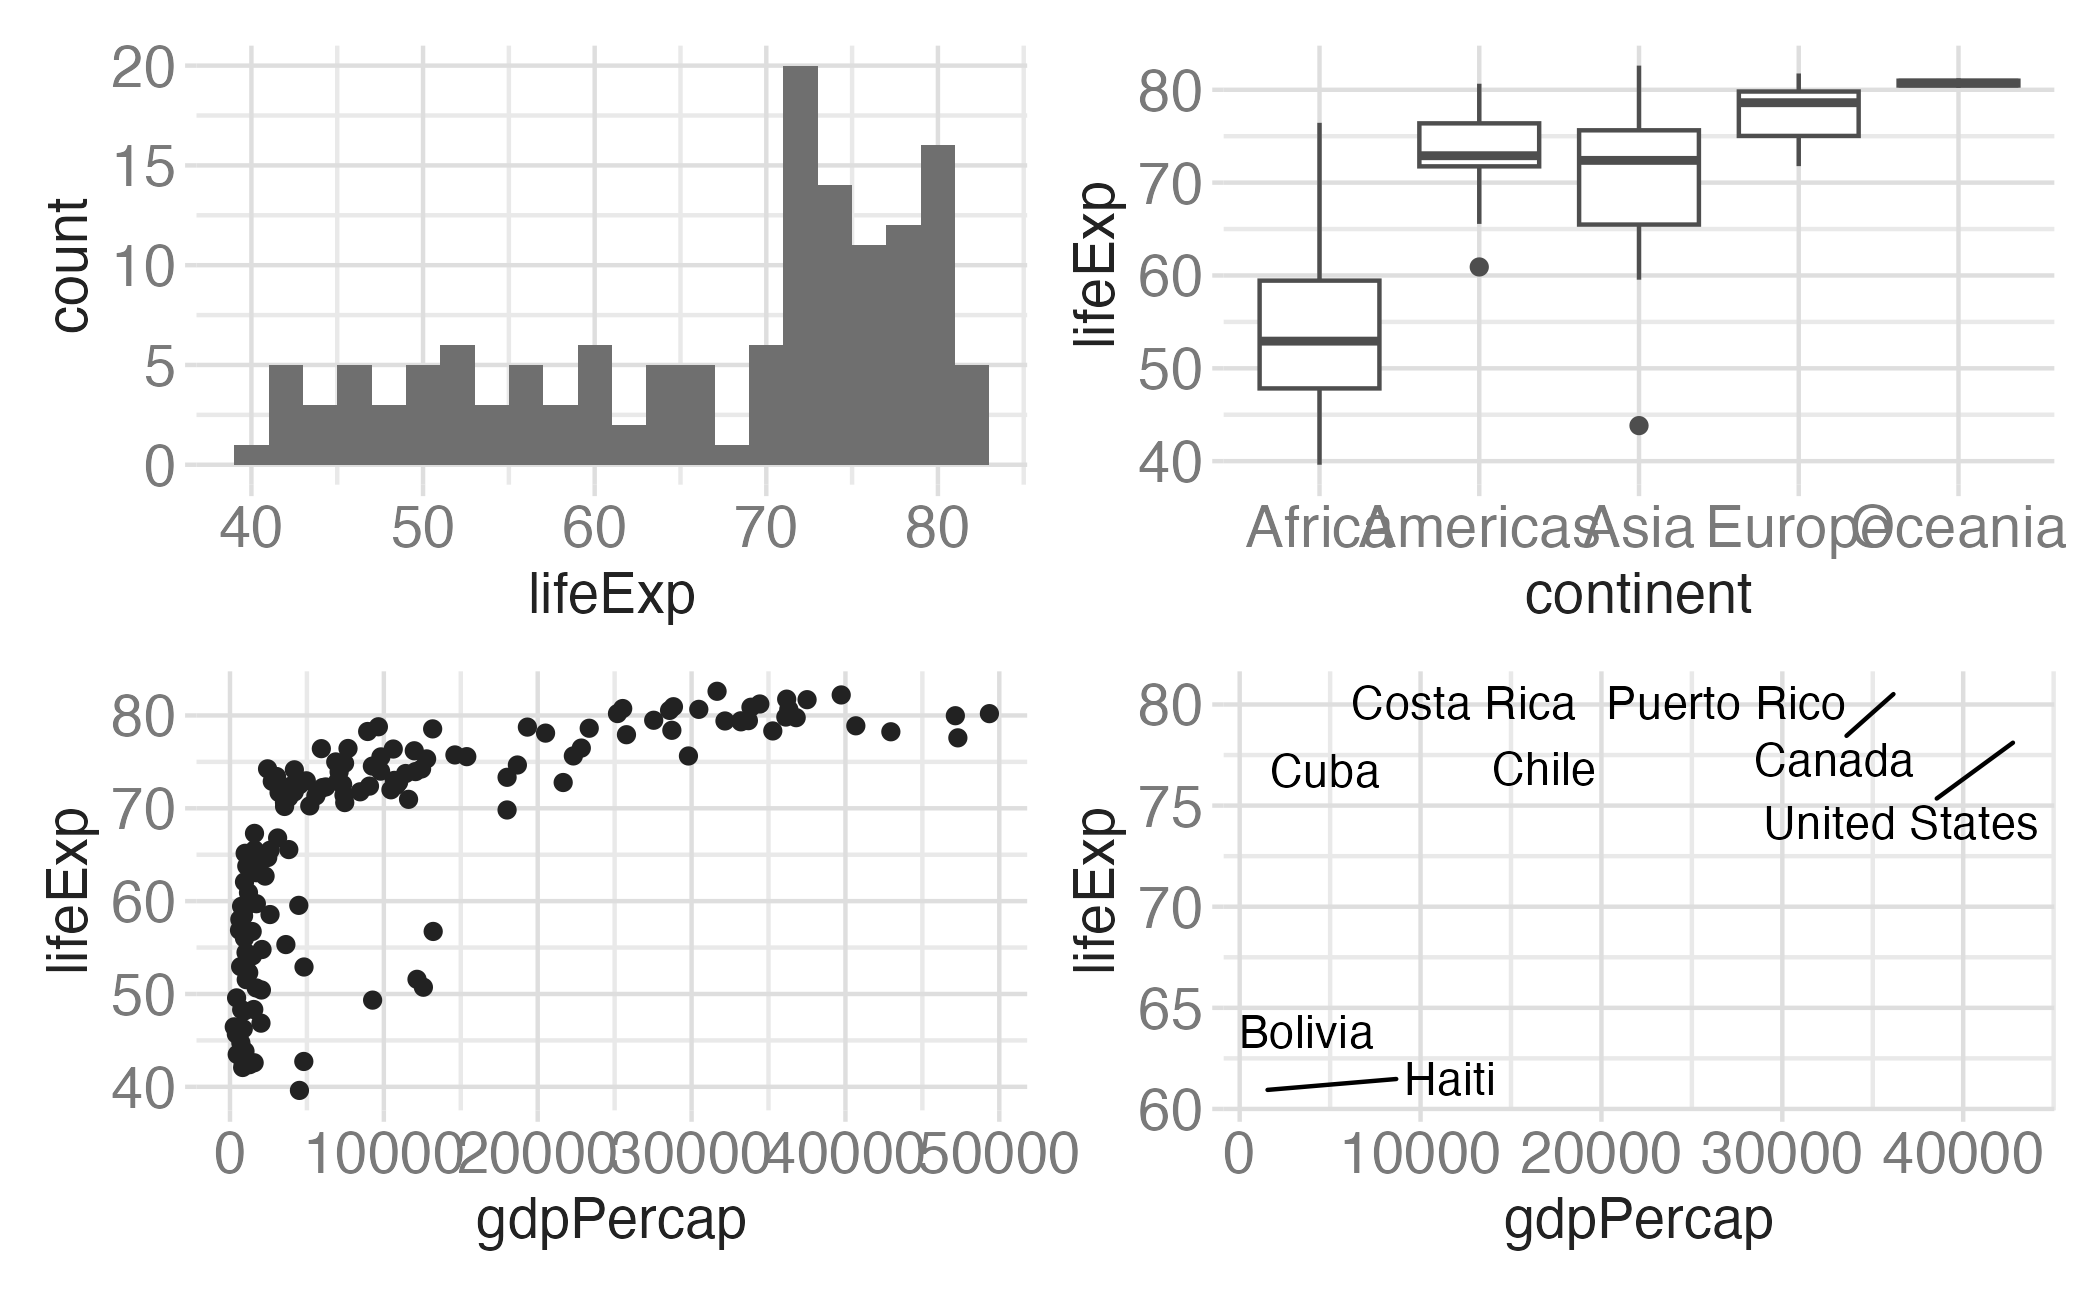
p_hist <- ggplot(data = gapminder_07, mapping = aes(x = lifeExp)) +
  geom_histogram(binwidth = 2)
p_box <- ggplot(data = gapminder_07, mapping = aes(x = continent, y = lifeExp)) +
  geom_boxplot()
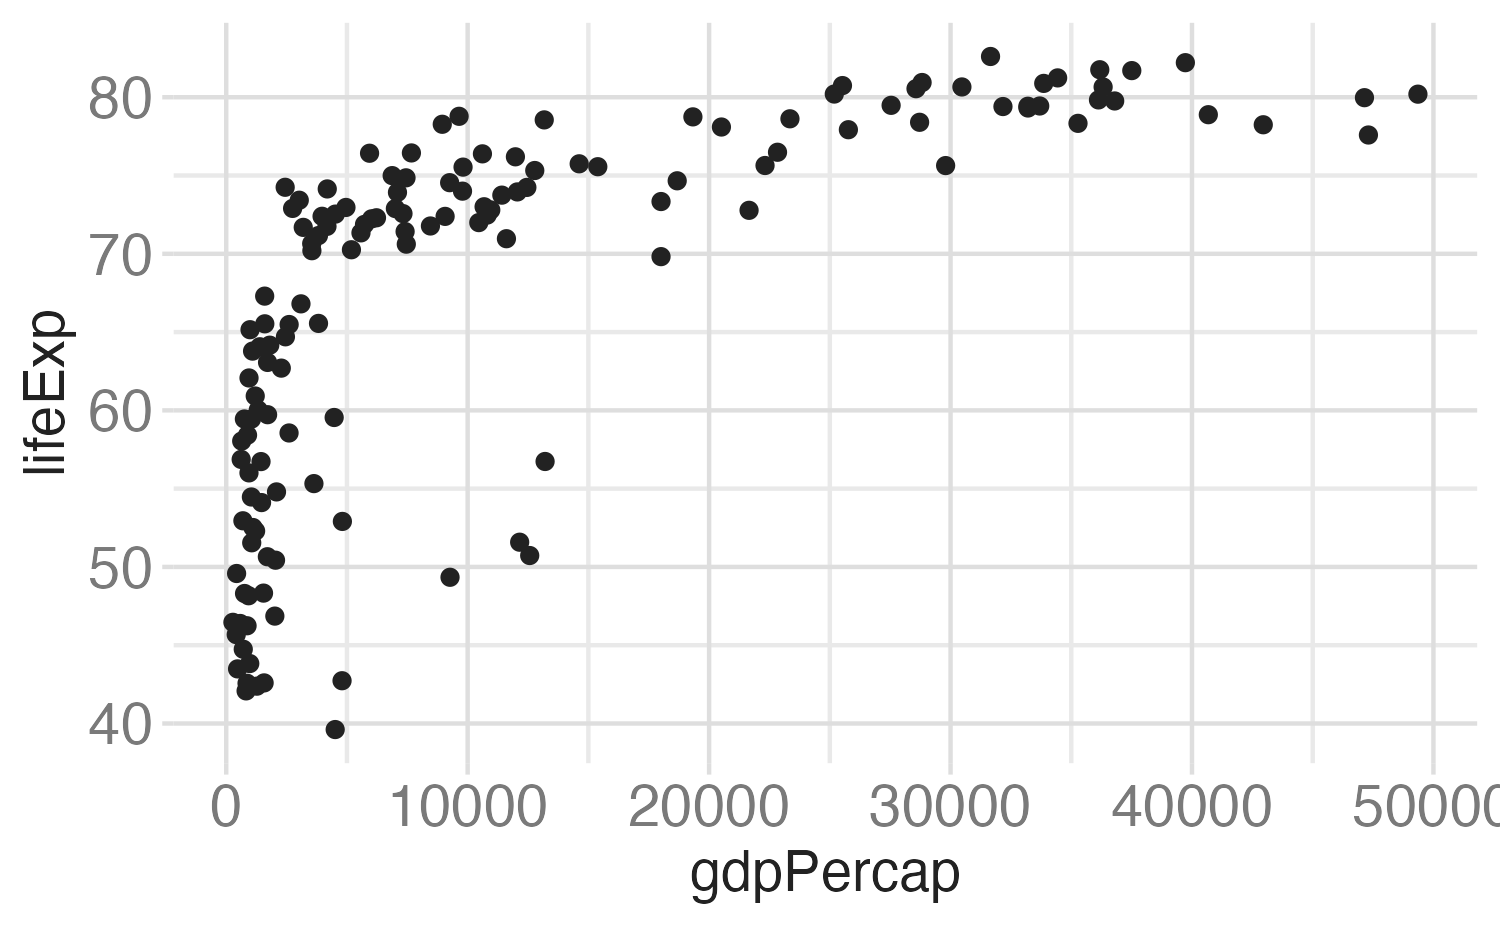
p_scatter <- ggplot(data = gapminder_07, mapping = aes(x = gdpPercap, y = lifeExp)) +
  geom_point()
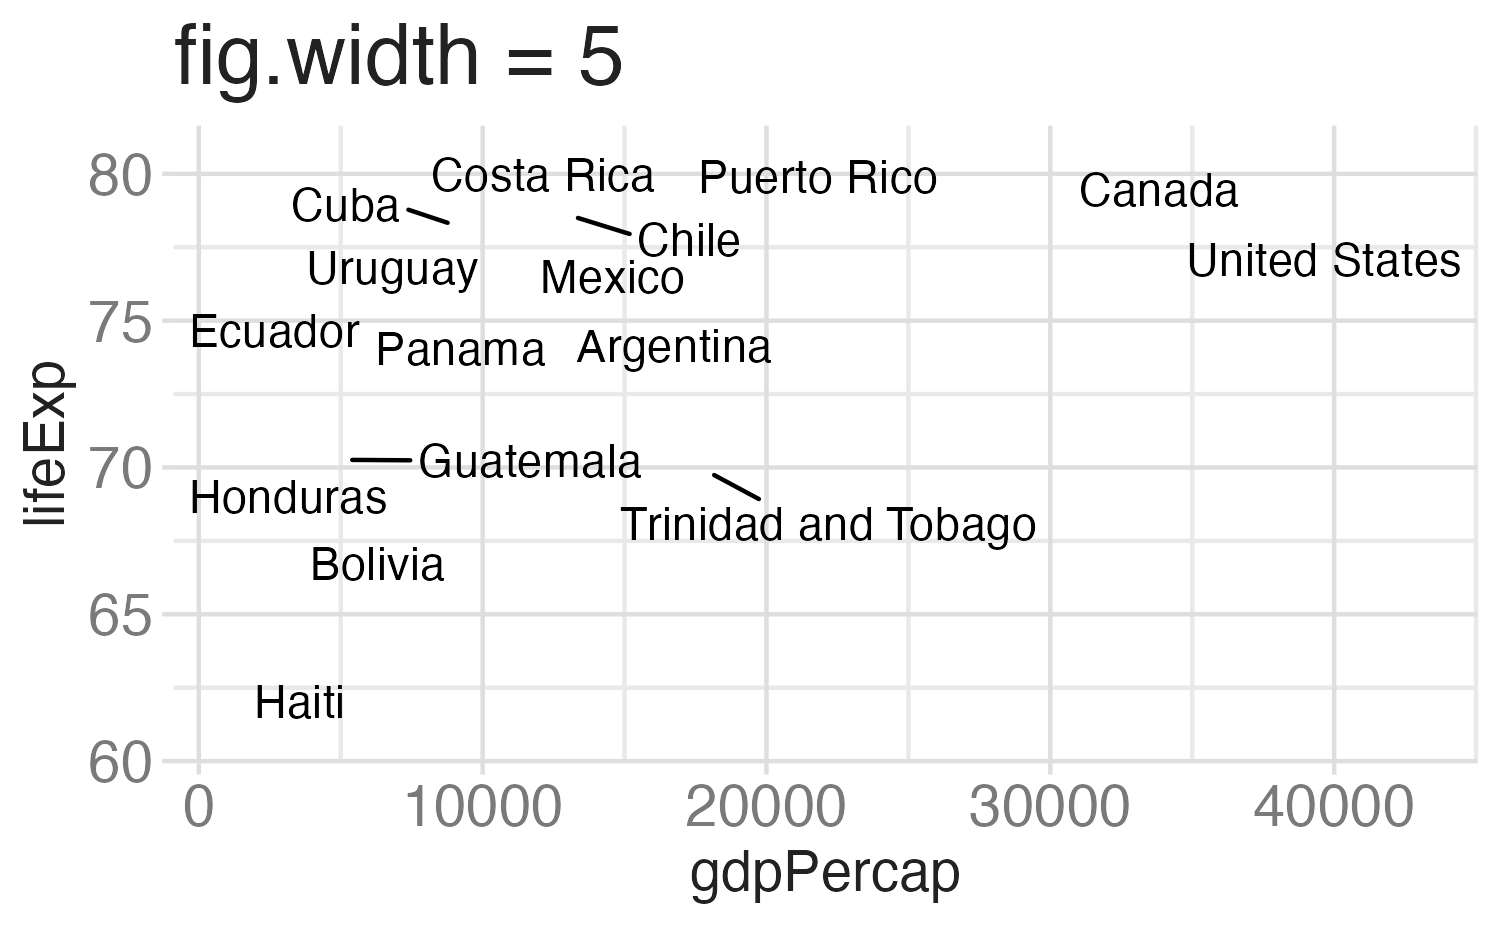
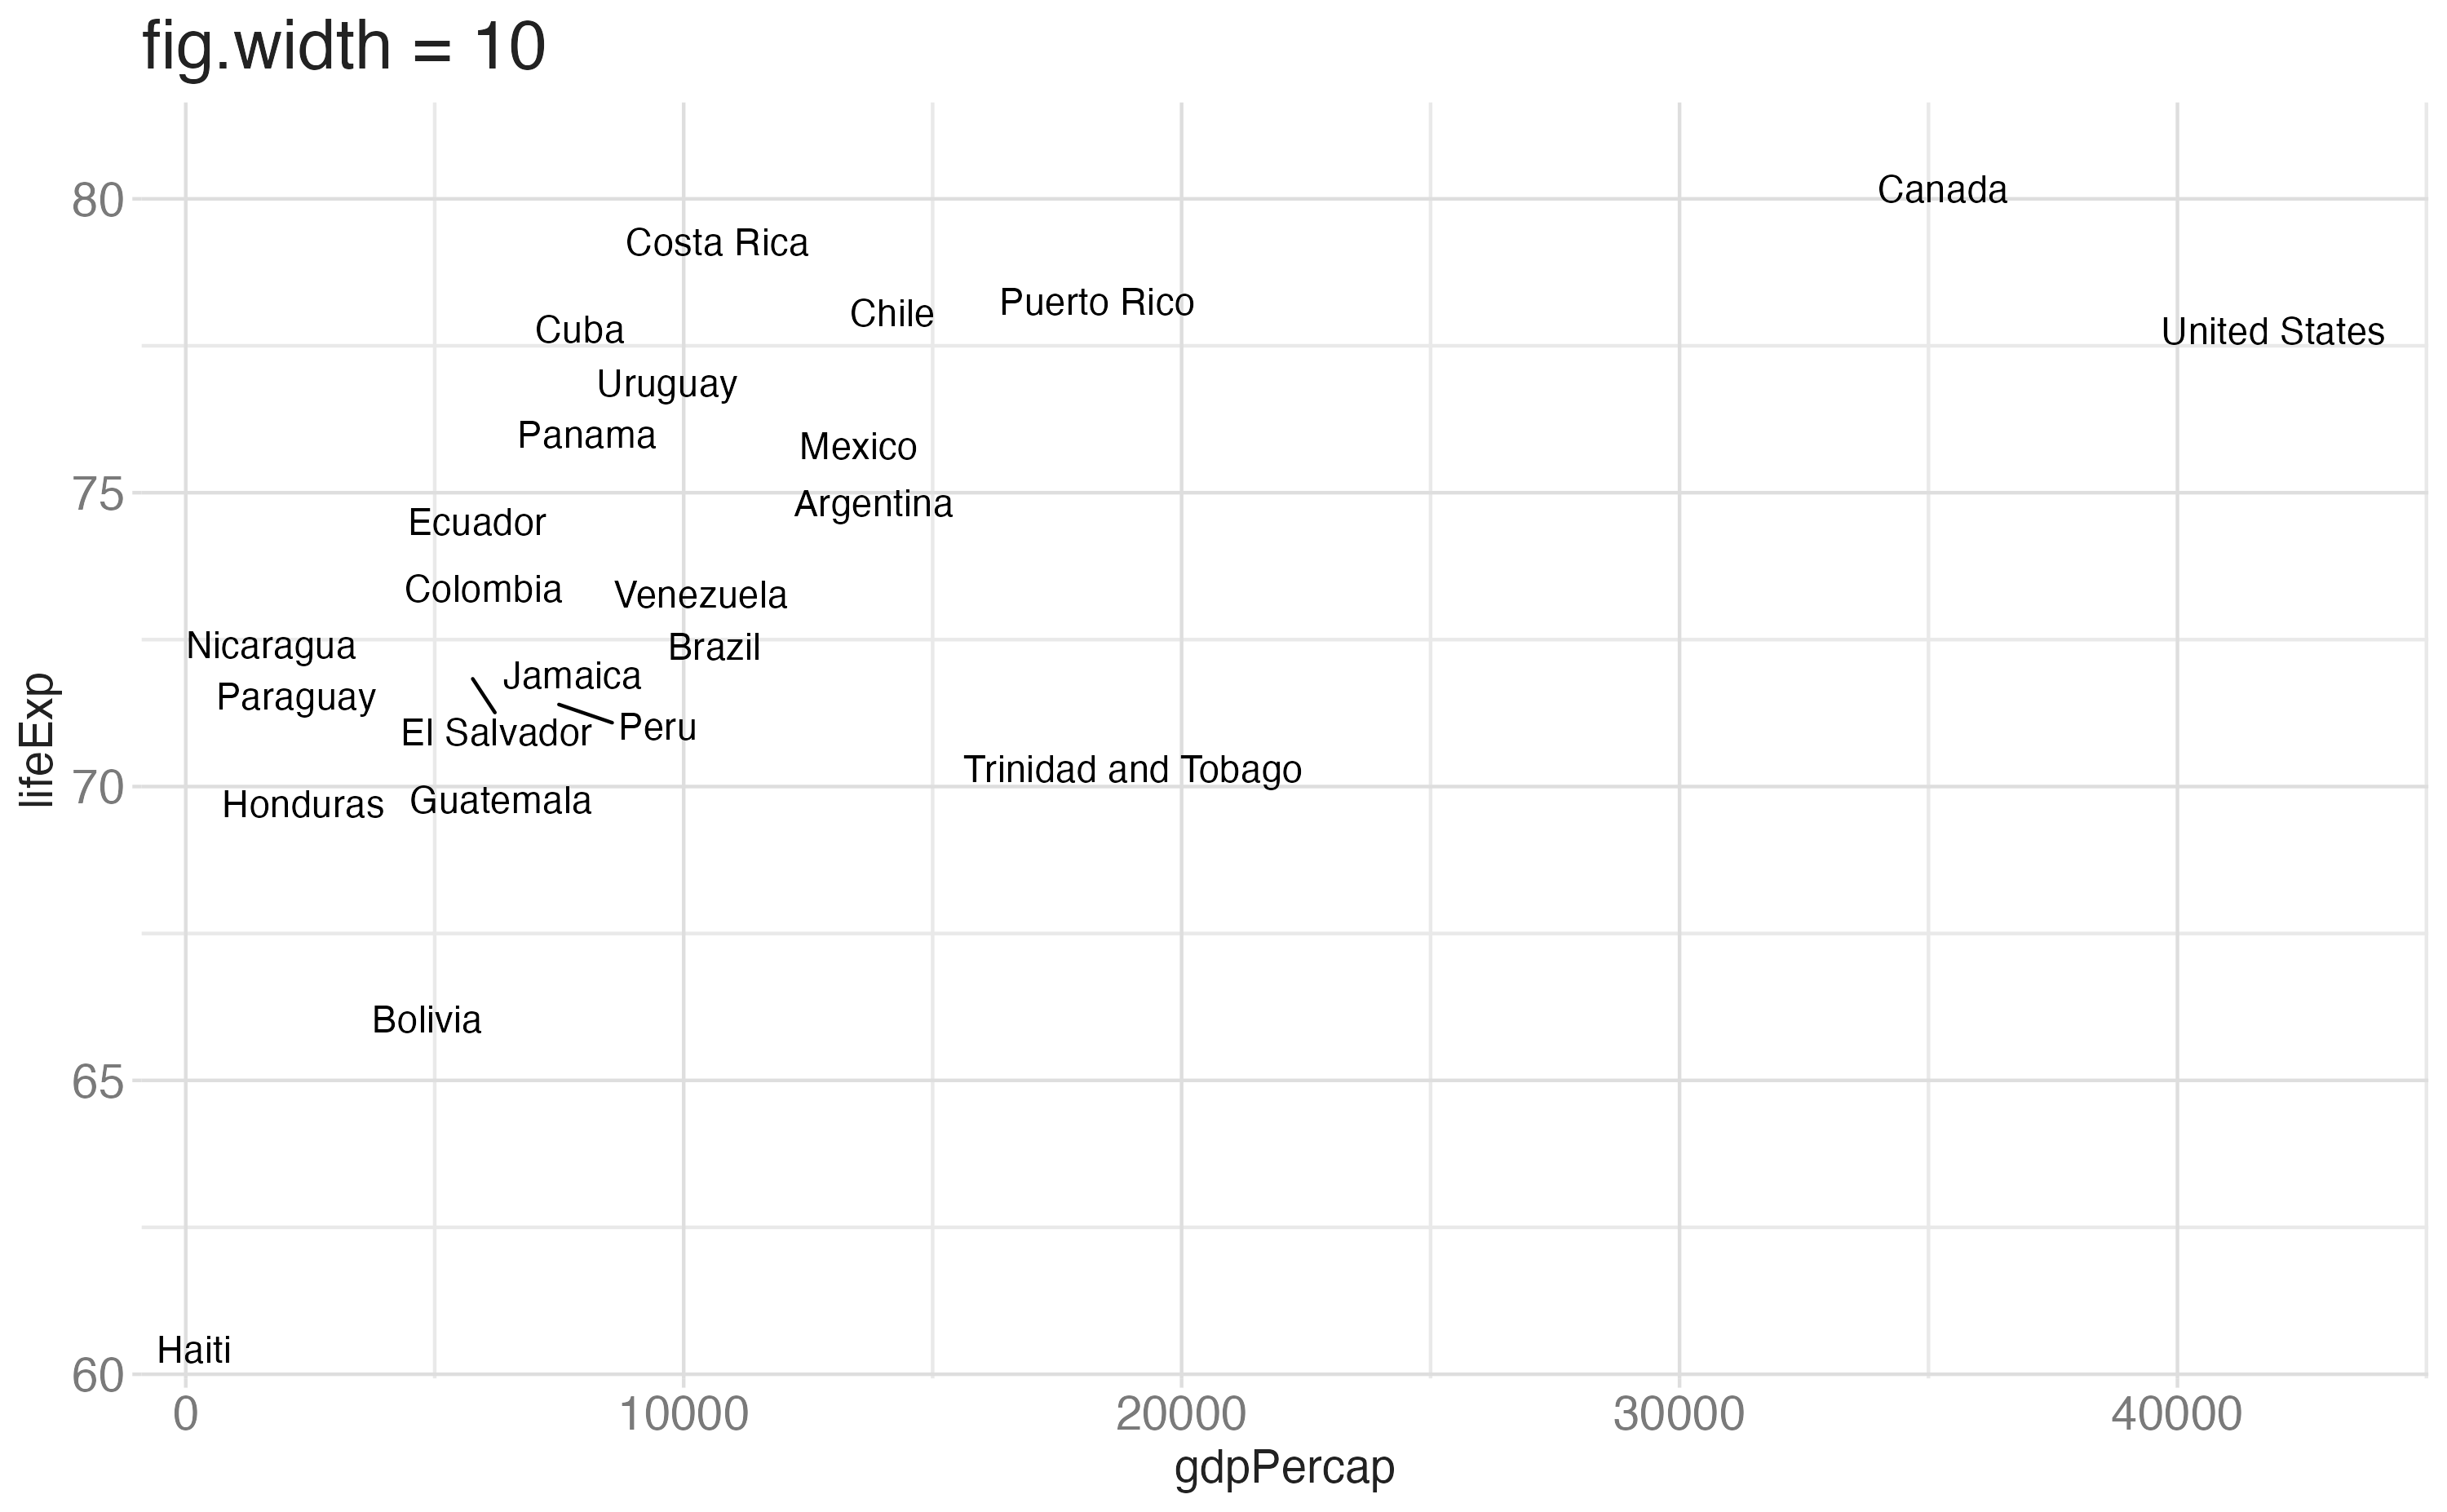
p_text <- gapminder_07 |>
  filter(continent == "Americas") |>
  ggplot(mapping = aes(x = gdpPercap, y = lifeExp)) +
  geom_text_repel(mapping = aes(label = country)) +
  coord_cartesian(clip = "off")

Slide with single plot, little text

The plot will fill the empty space in the slide.

p_hist

Slide with single plot, lots of text

  • If there is more text on the slide

  • The plot will shrink

  • To make room for the text

p_hist

Small fig-width

For a zoomed-in look

```{r}
#| fig-width: 3
#| fig-asp: 0.618

p_hist
```

Large fig-width

For a zoomed-out look

```{r}
#| fig-width: 10
#| fig-asp: 0.618

p_hist
```

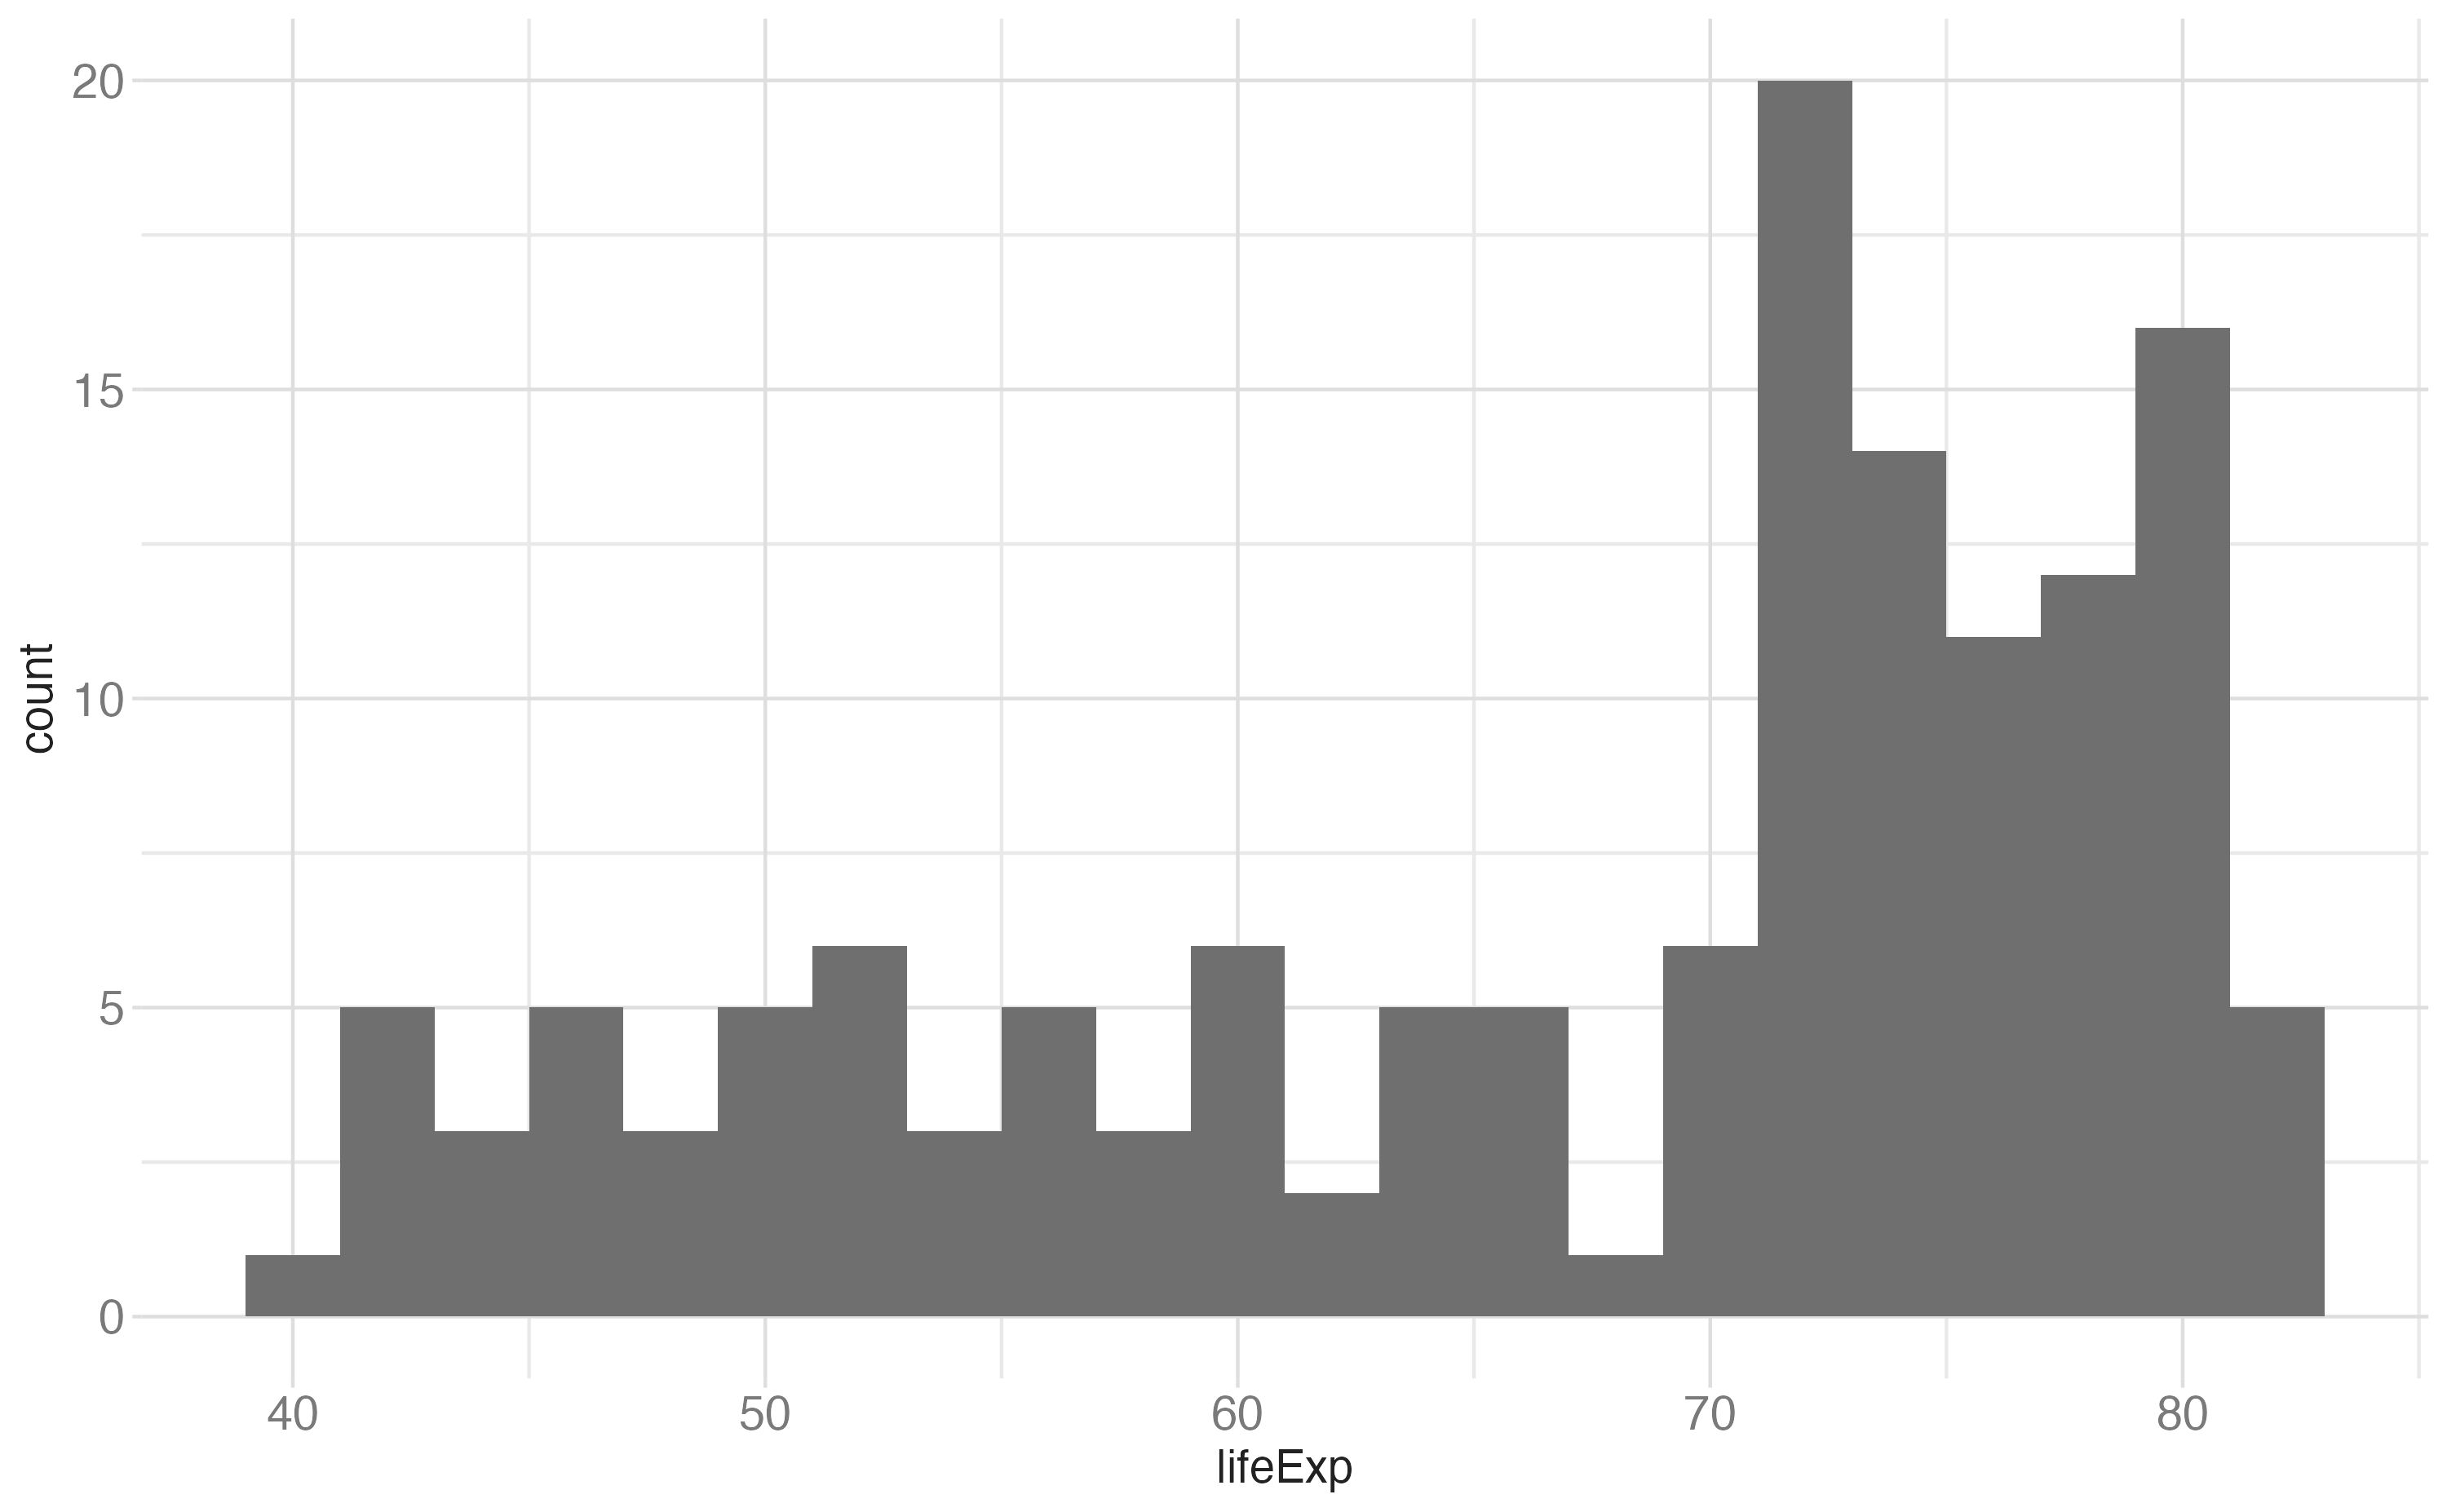
fig-width affects text size

Multiple plots on a slide

First, ask yourself, must you include multiple plots on a slide? For example, is your narrative about comparing results from two plots?

  • If no, then don’t! Move the second plot to to the next slide!

  • If yes:

    • Insert columns

    • Use layout-ncol chunk option

    • Use the {patchwork} package

    • Possibly, use pivoting to reshape your data and then use facets

Columns

Quarto will automatically resize your plots to fit side-by-side.

:::: {.columns}

::: {.column width="40%"}
Left column
:::

::: {.column width="60%"}
Right column
:::

::::

Columns

Left column

Right column

layout-ncol

```{r}
#| fig-width: 5
#| fig-asp: 0.618
#| layout-ncol: 2
#| out-width: 100%

p_hist
p_scatter
```

{patchwork}

```{r}
#| fig-width: 7
#| fig-asp: 0.4

p_hist + p_scatter
```

{patchwork} layout I

(p_hist + p_box) /
  (p_scatter + p_text)

{patchwork} layout II

p_text / (p_hist + p_box + p_scatter)

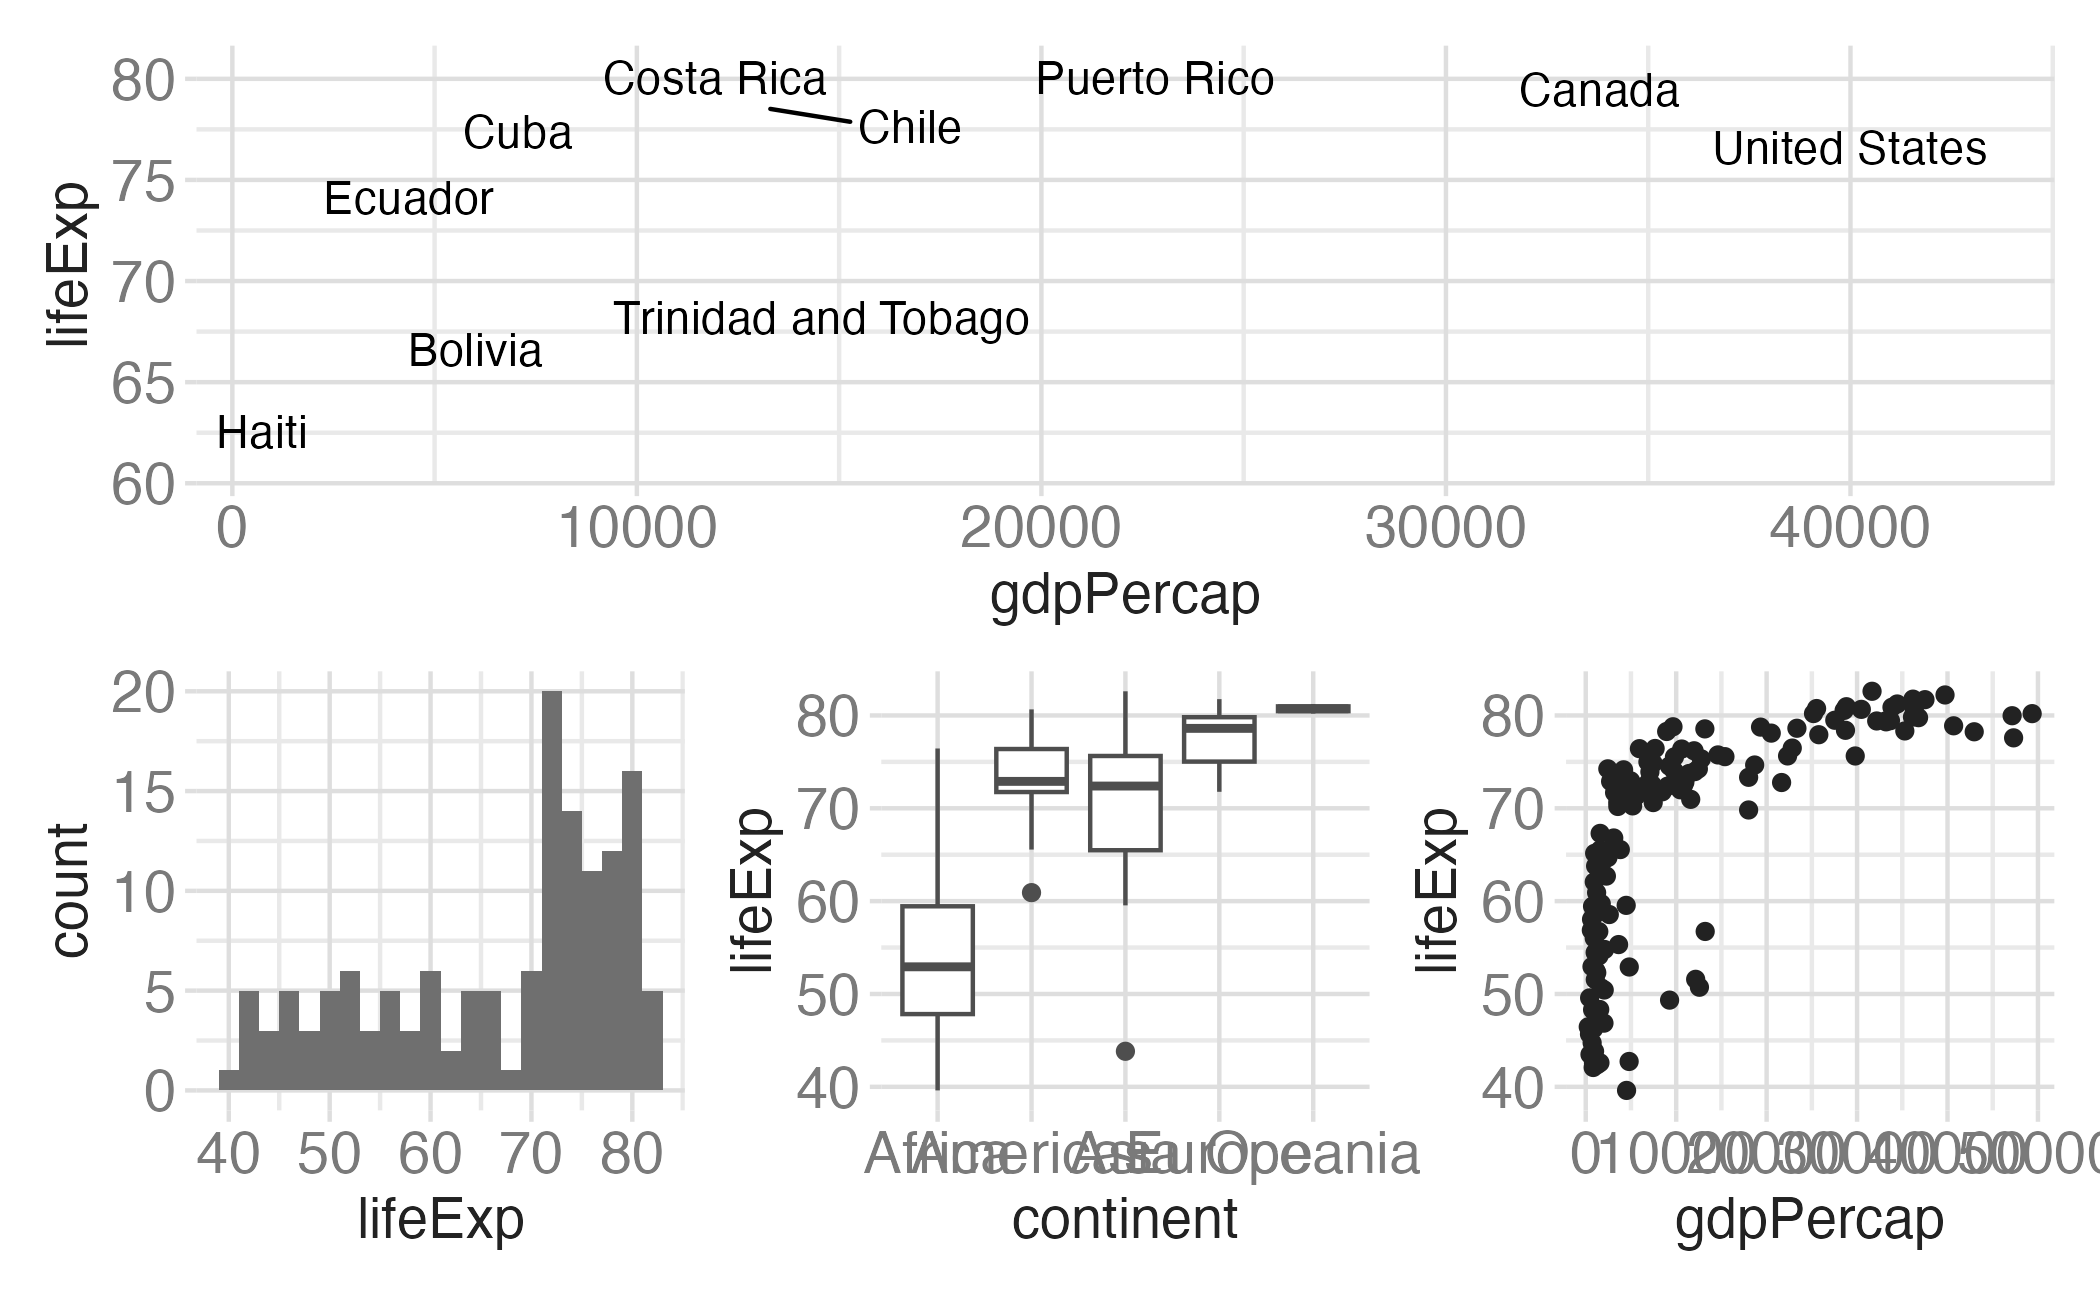
{patchwork} layout III

p_text + p_hist + p_box + p_scatter +
  plot_annotation(title = "Gapminder", tag_levels = c("A"))

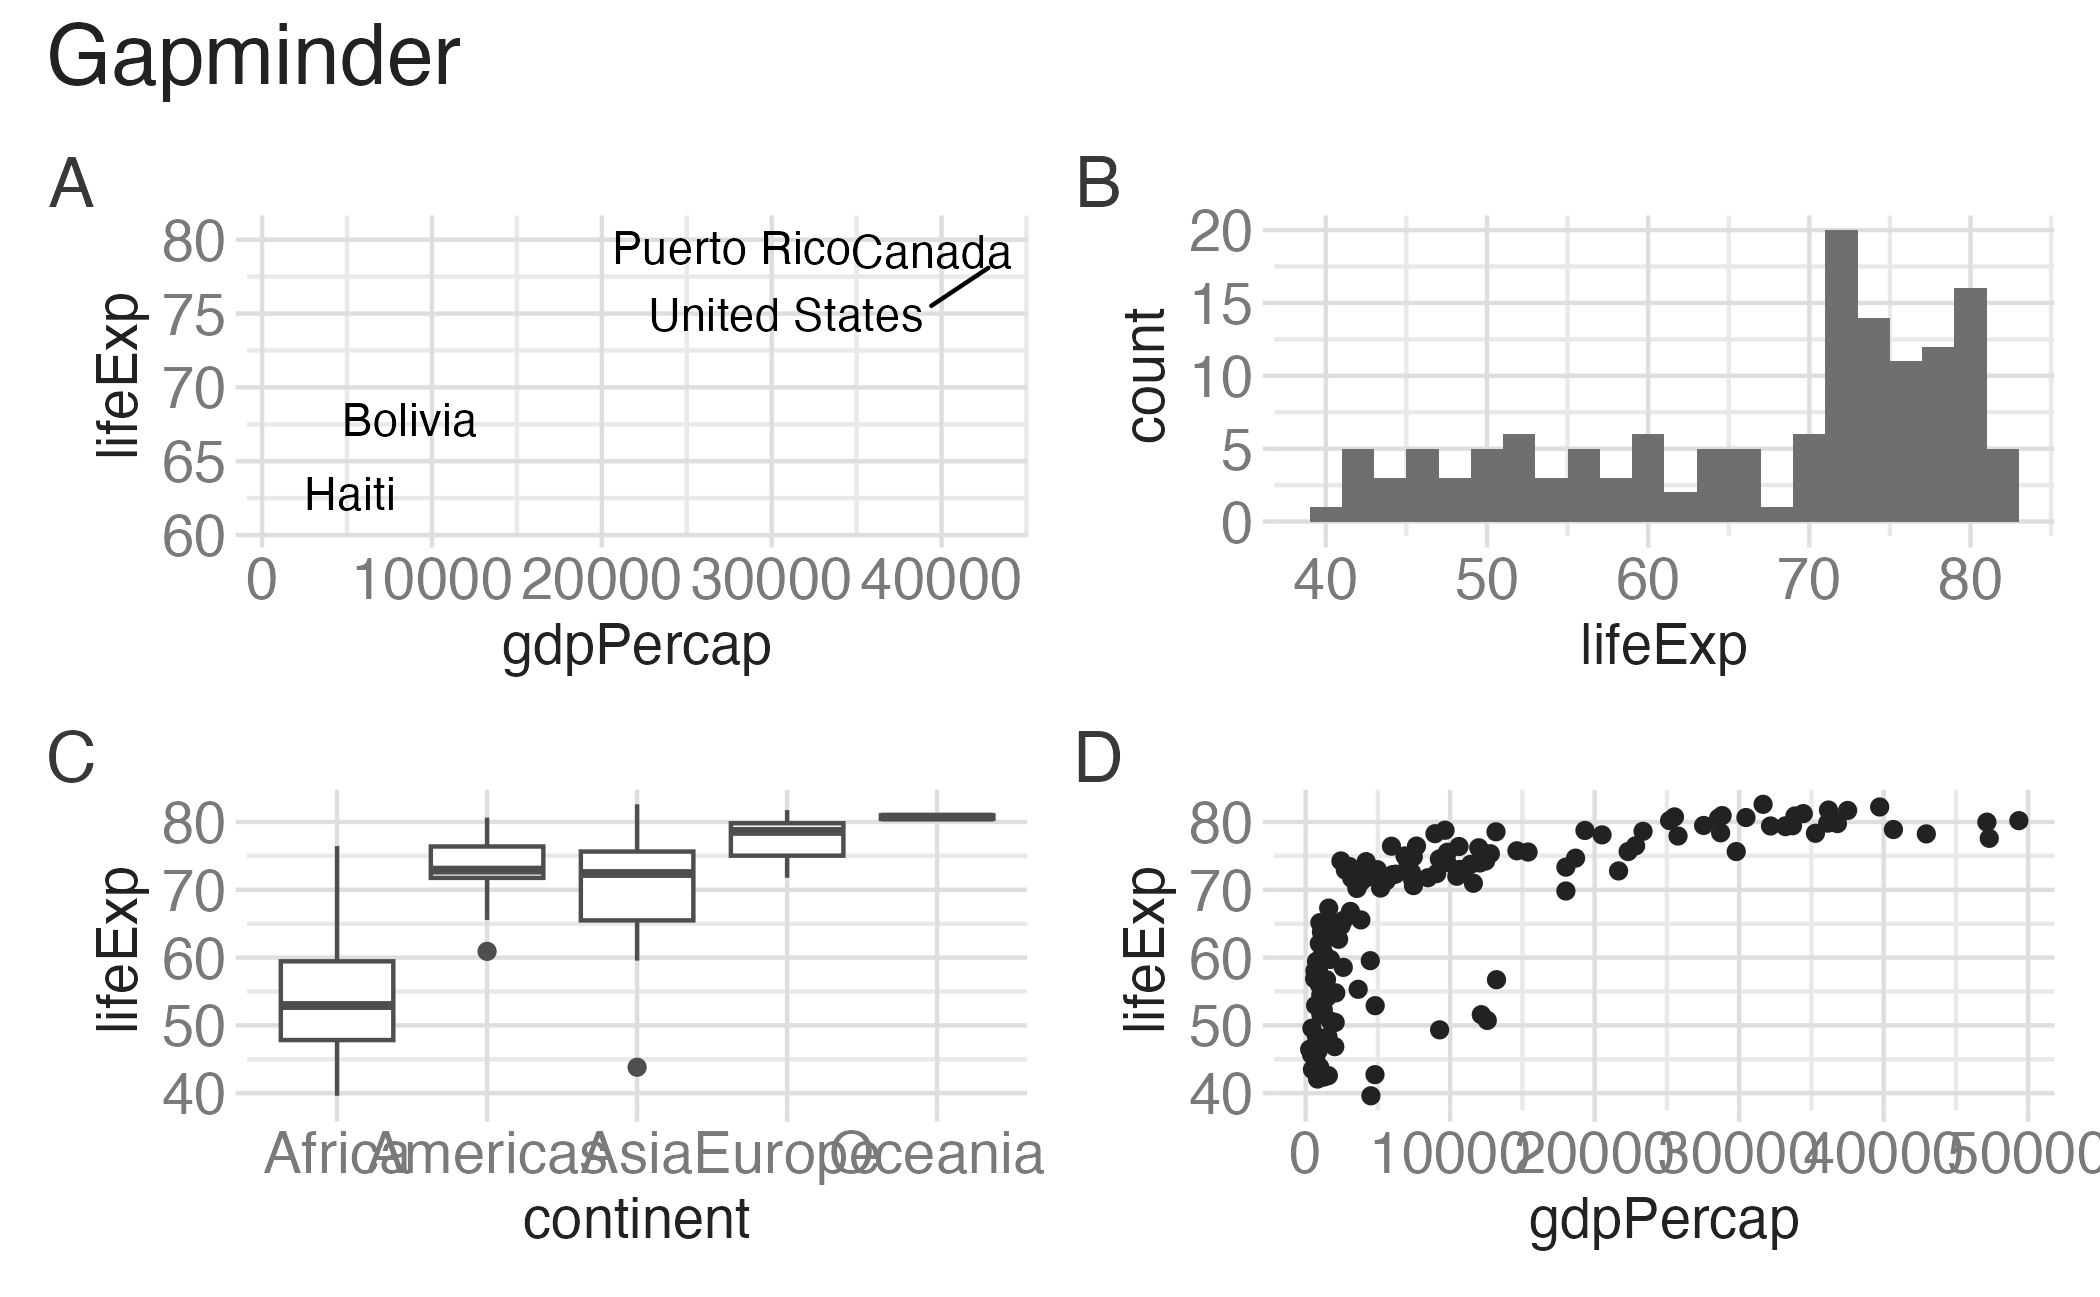
{patchwork} layout IV

p_text +
  {
    p_hist + {
      p_box + p_scatter + plot_layout(ncol = 1) + plot_layout(tag_level = "new")
    }
  } +
  plot_layout(ncol = 1) +
  plot_annotation(tag_levels = c("1", "a"), tag_prefix = "Fig ")

Wrap up

Wrap up

  • Review evaluation criteria for project 01
  • Ensure all of your project components are published before the start of class on Thursday
  • Check the reproducibility of your project

Acknowledgements