Telling the story with data
Lecture 11
February 26, 2026
- What is the story?
- How does the chart tell the story?
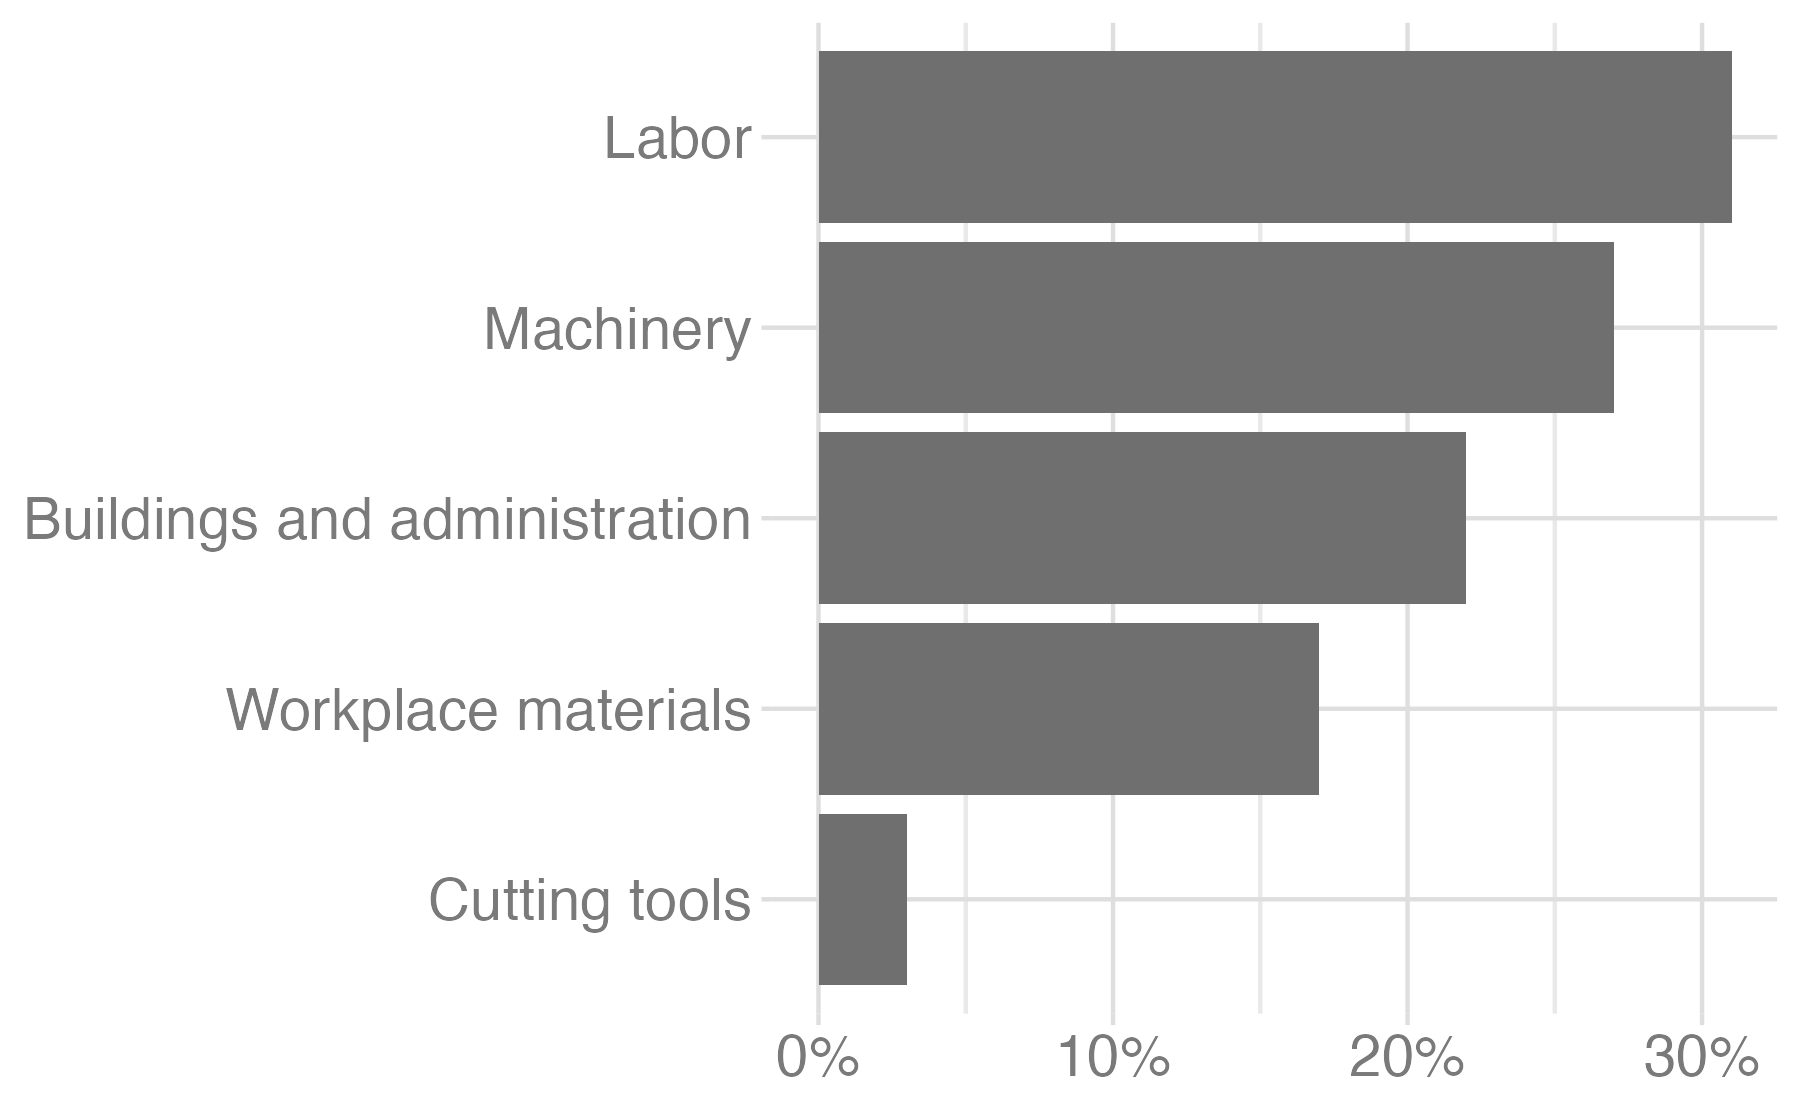
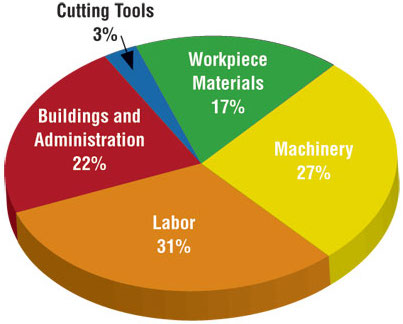
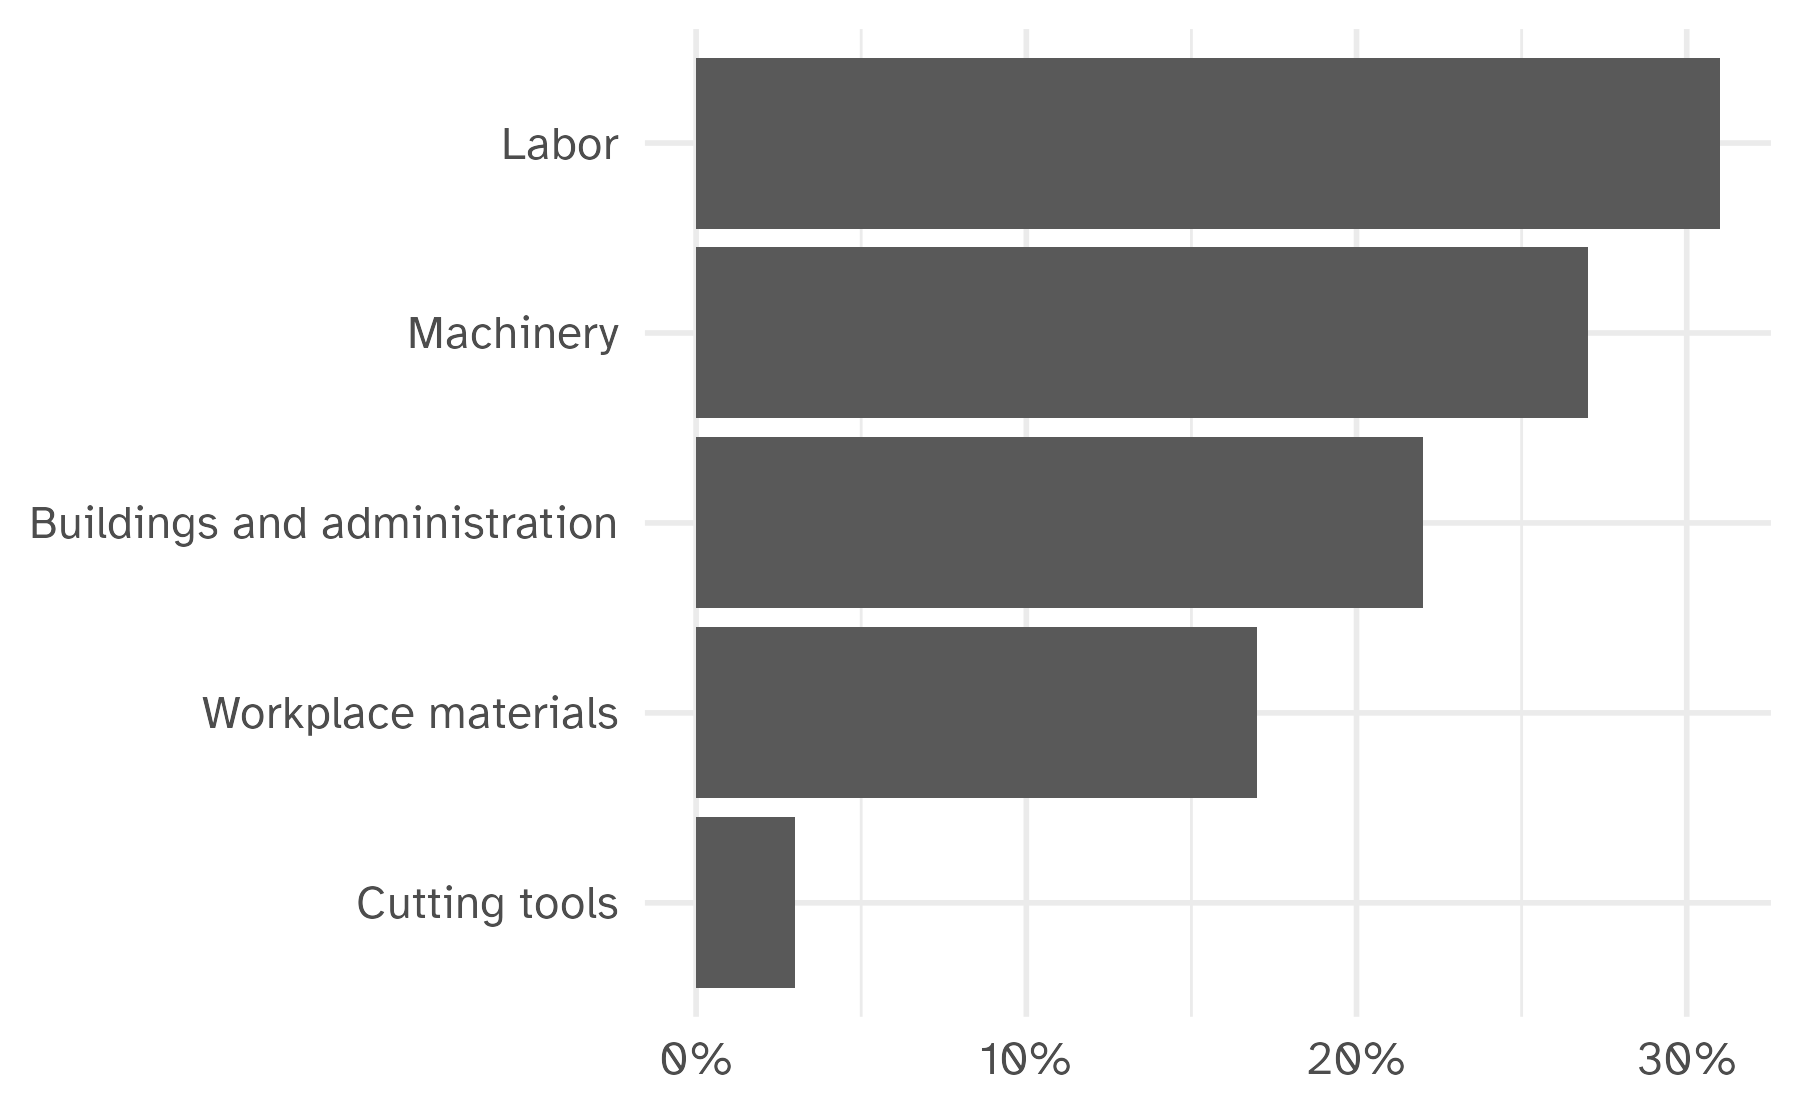
Keep it simple
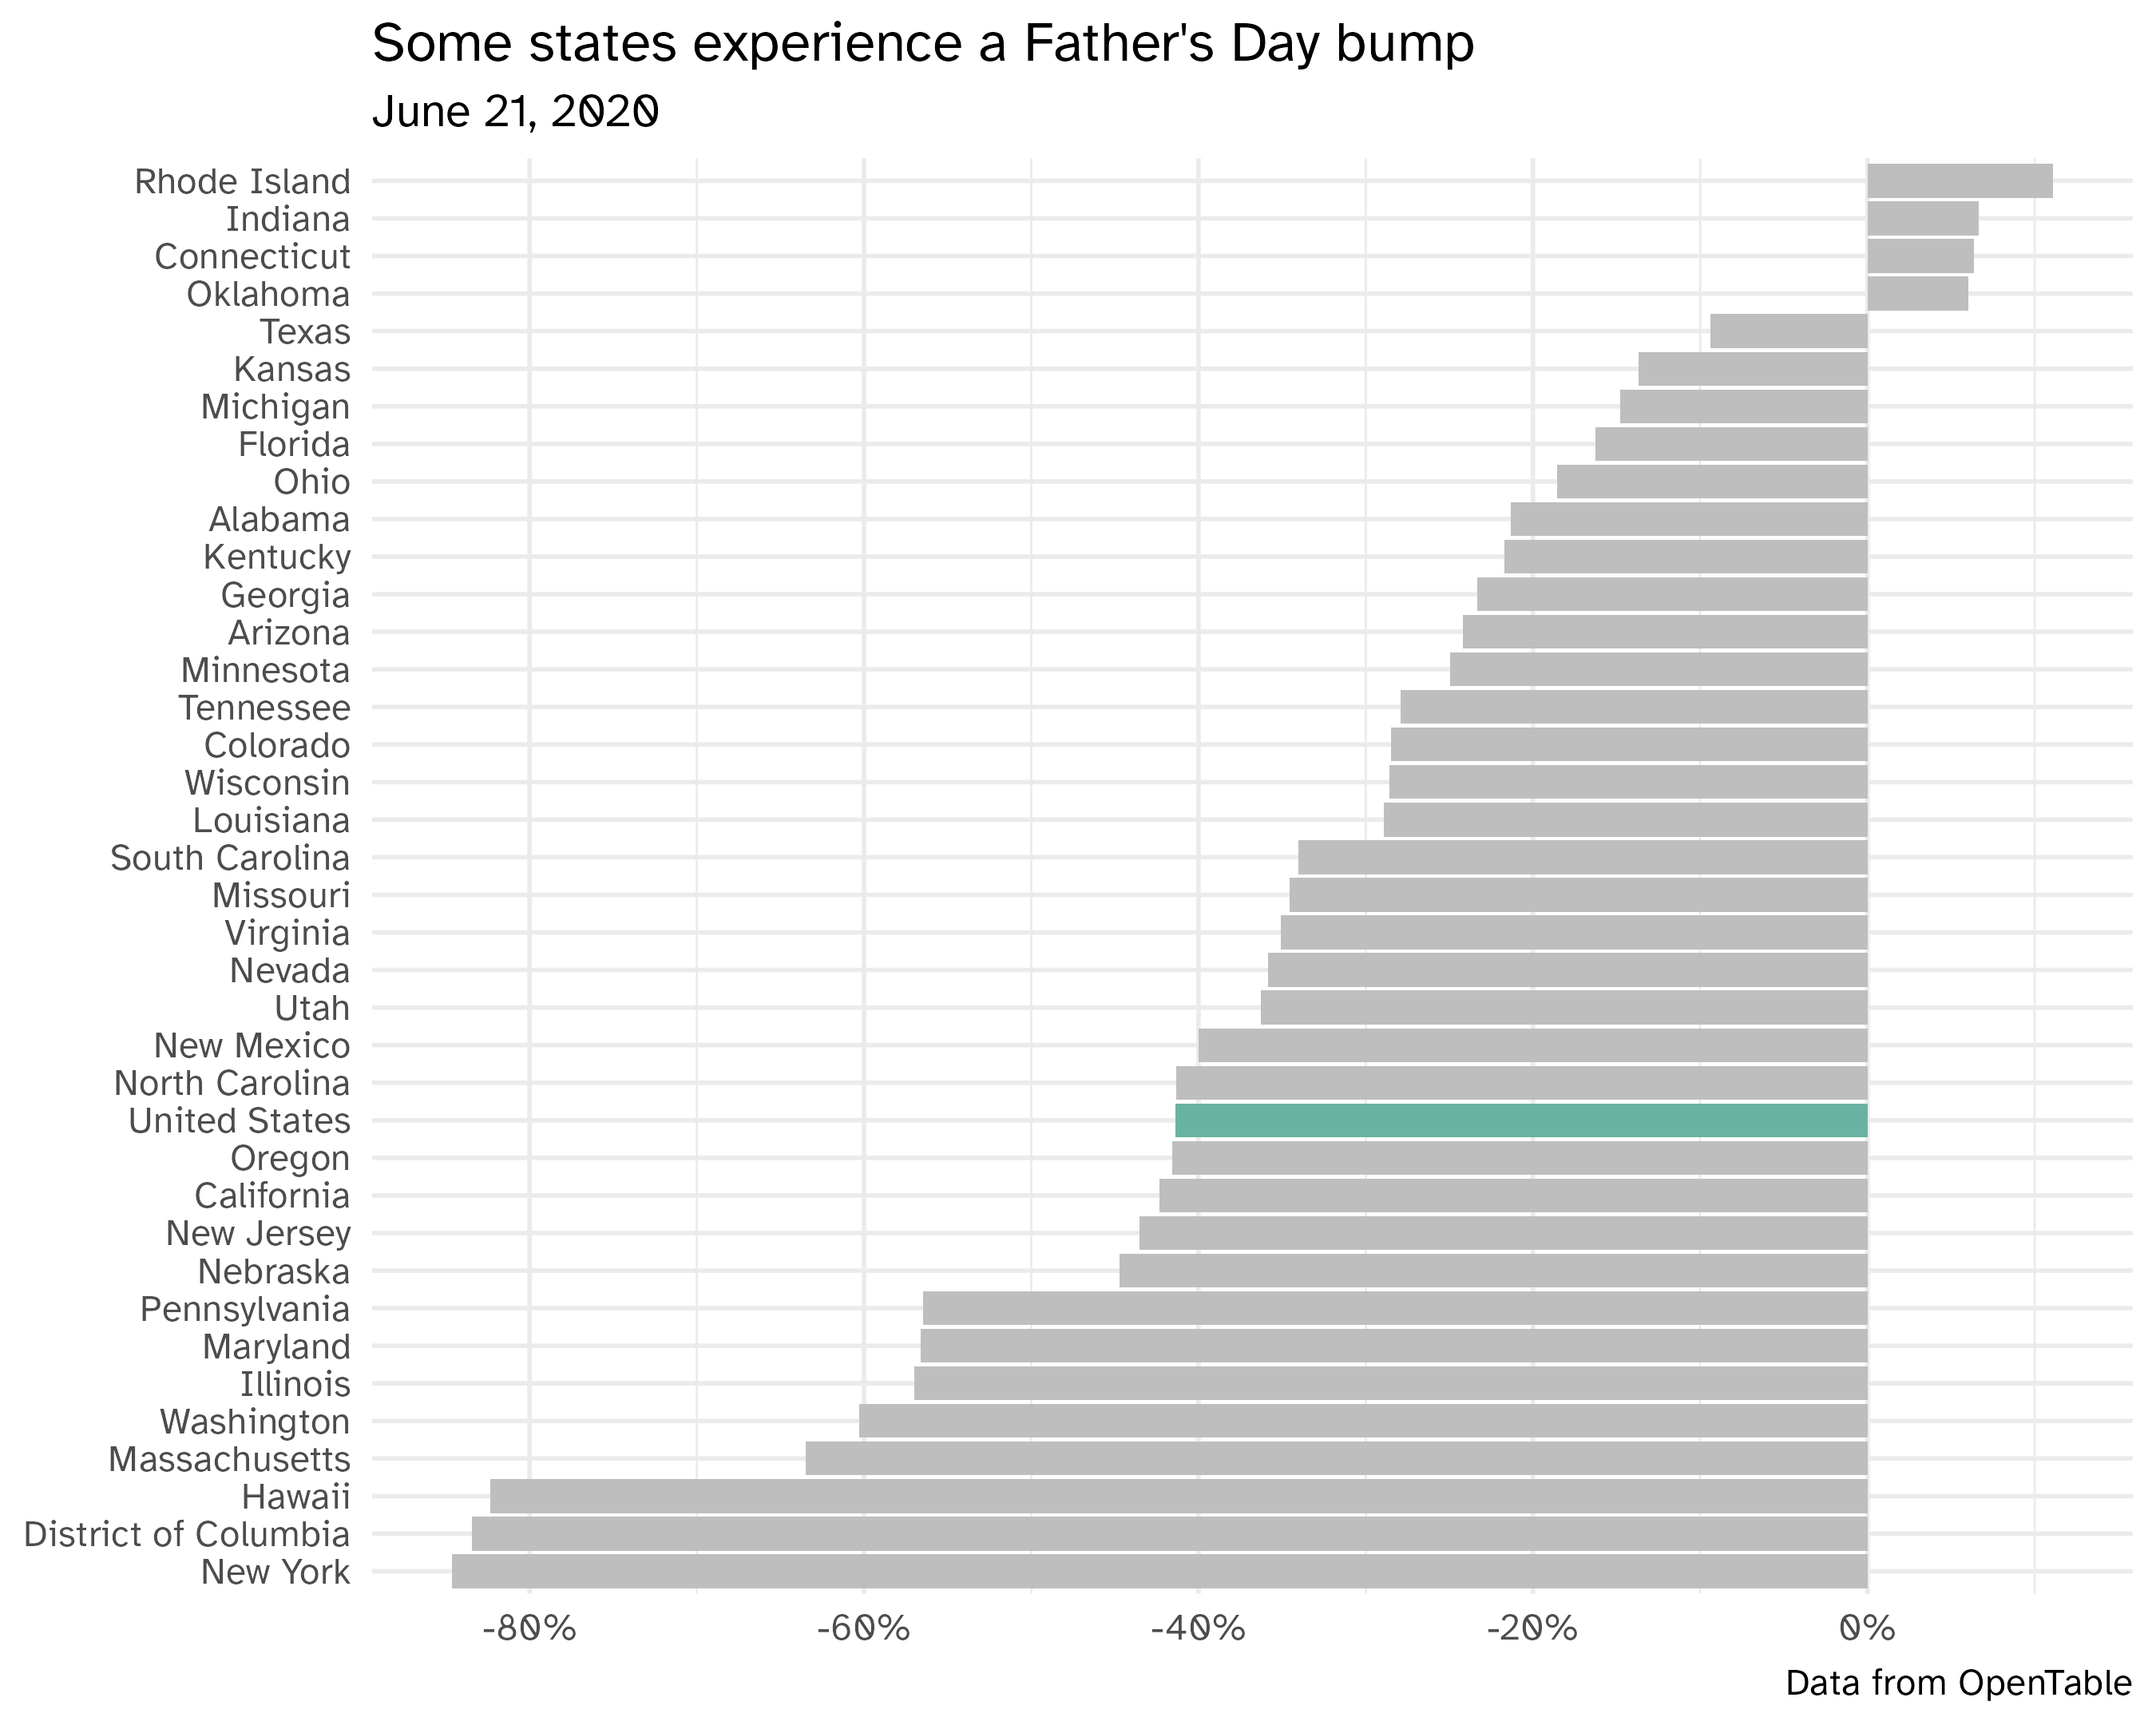
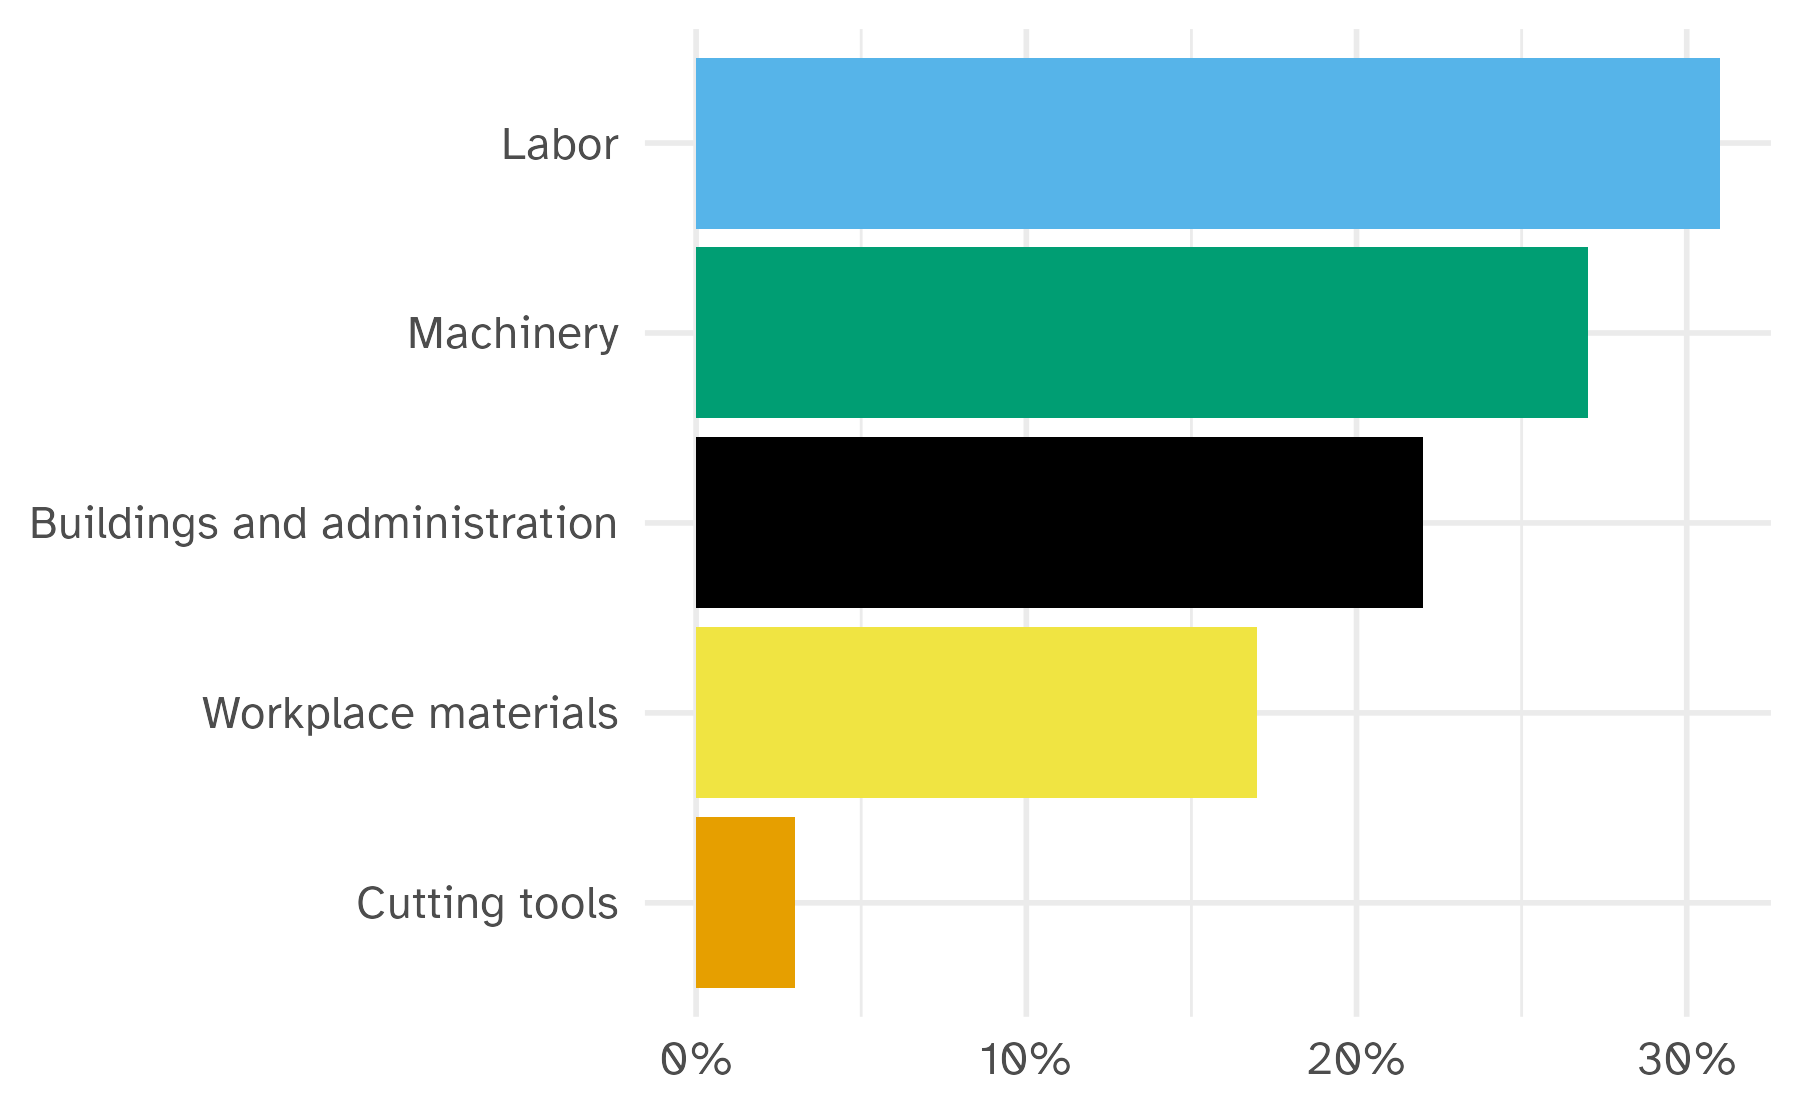
Use color to draw attention
Clarify the story
Order matters


Reduce cognitive load


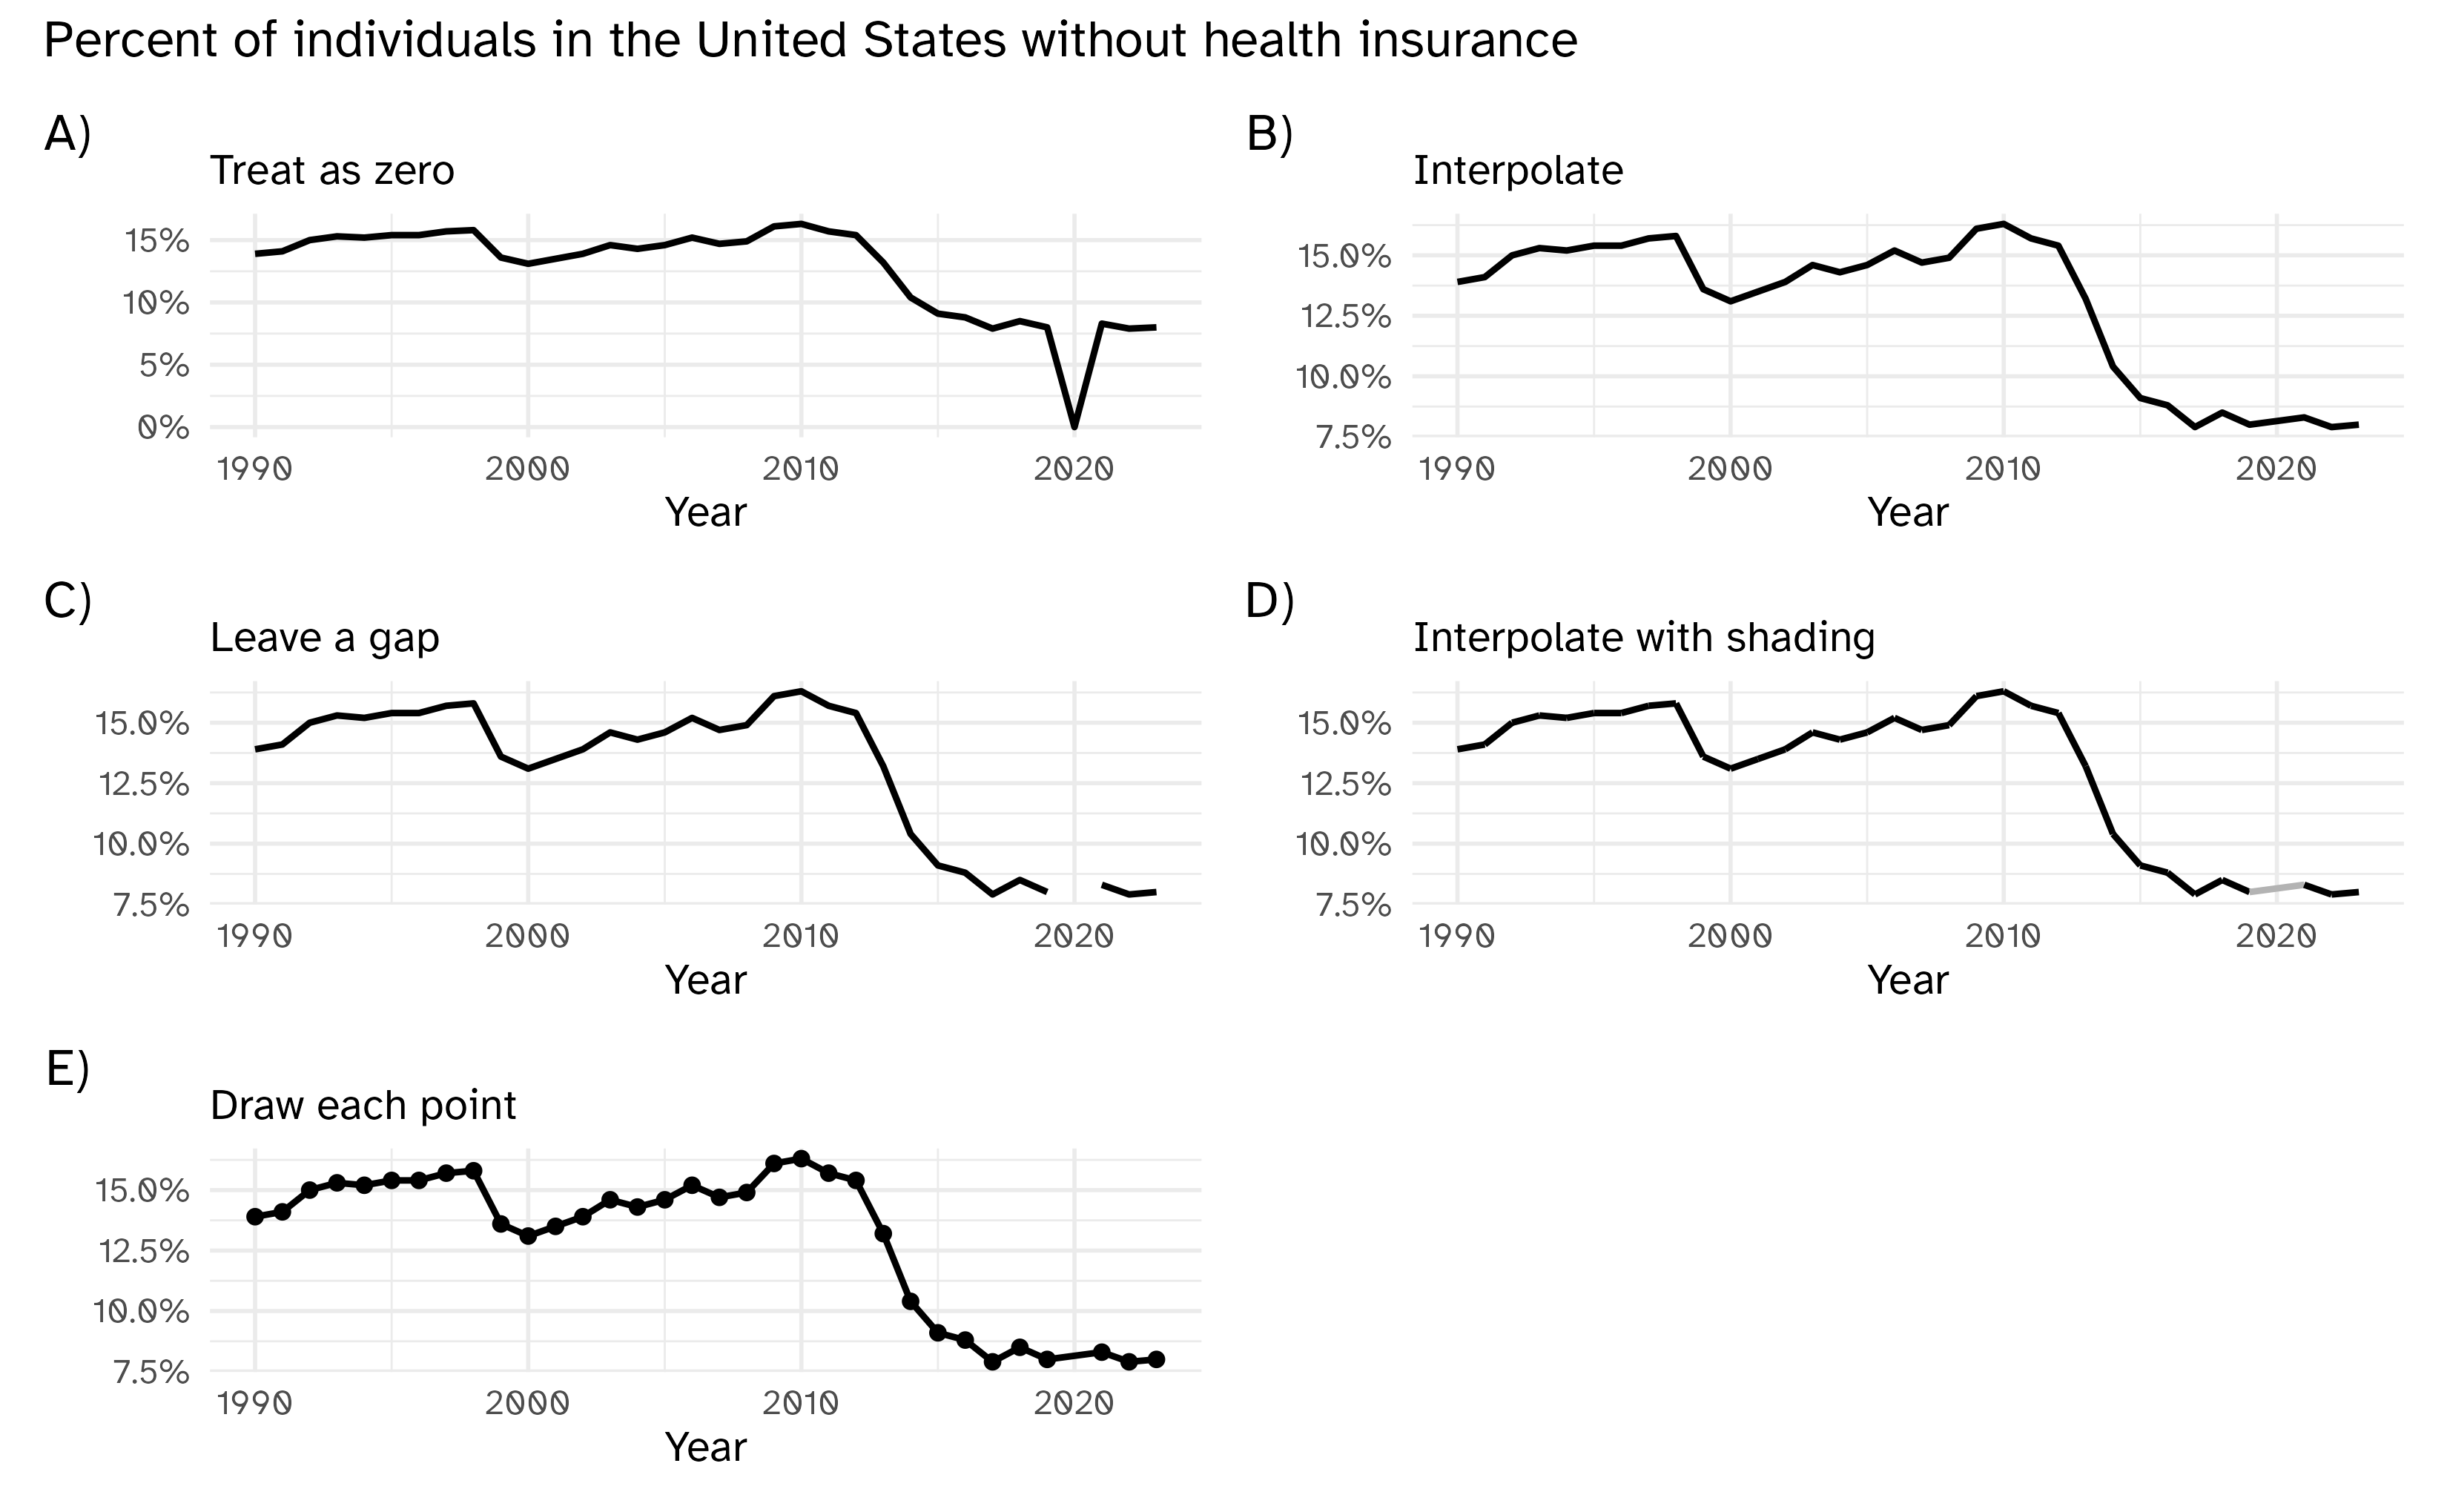
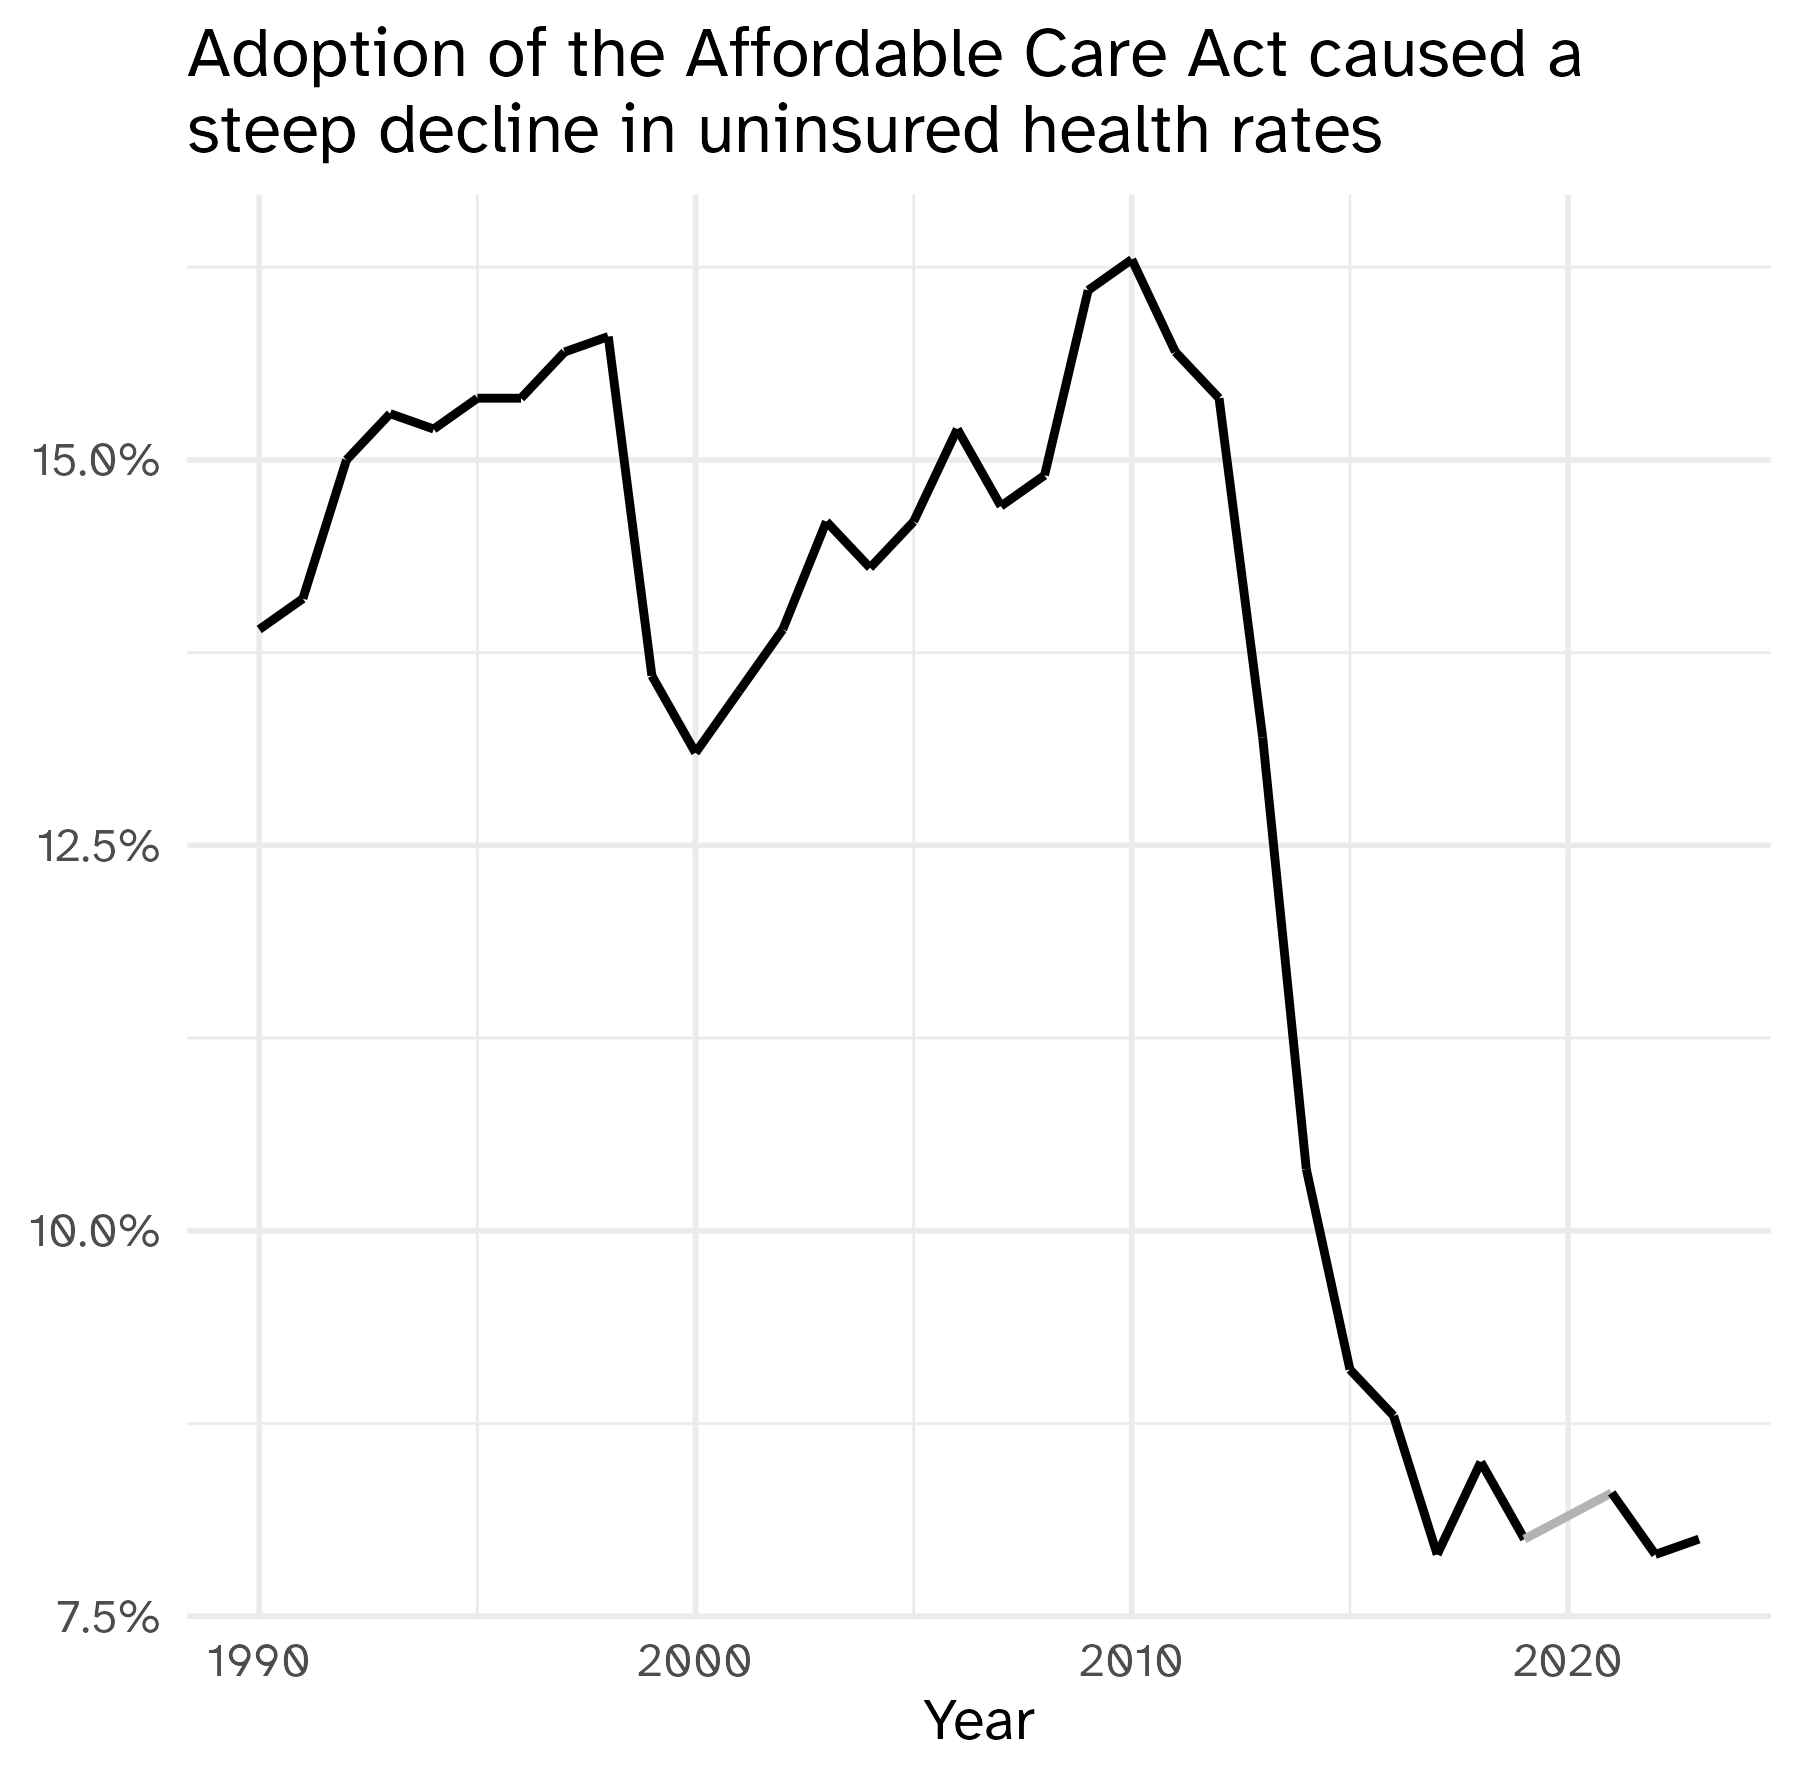
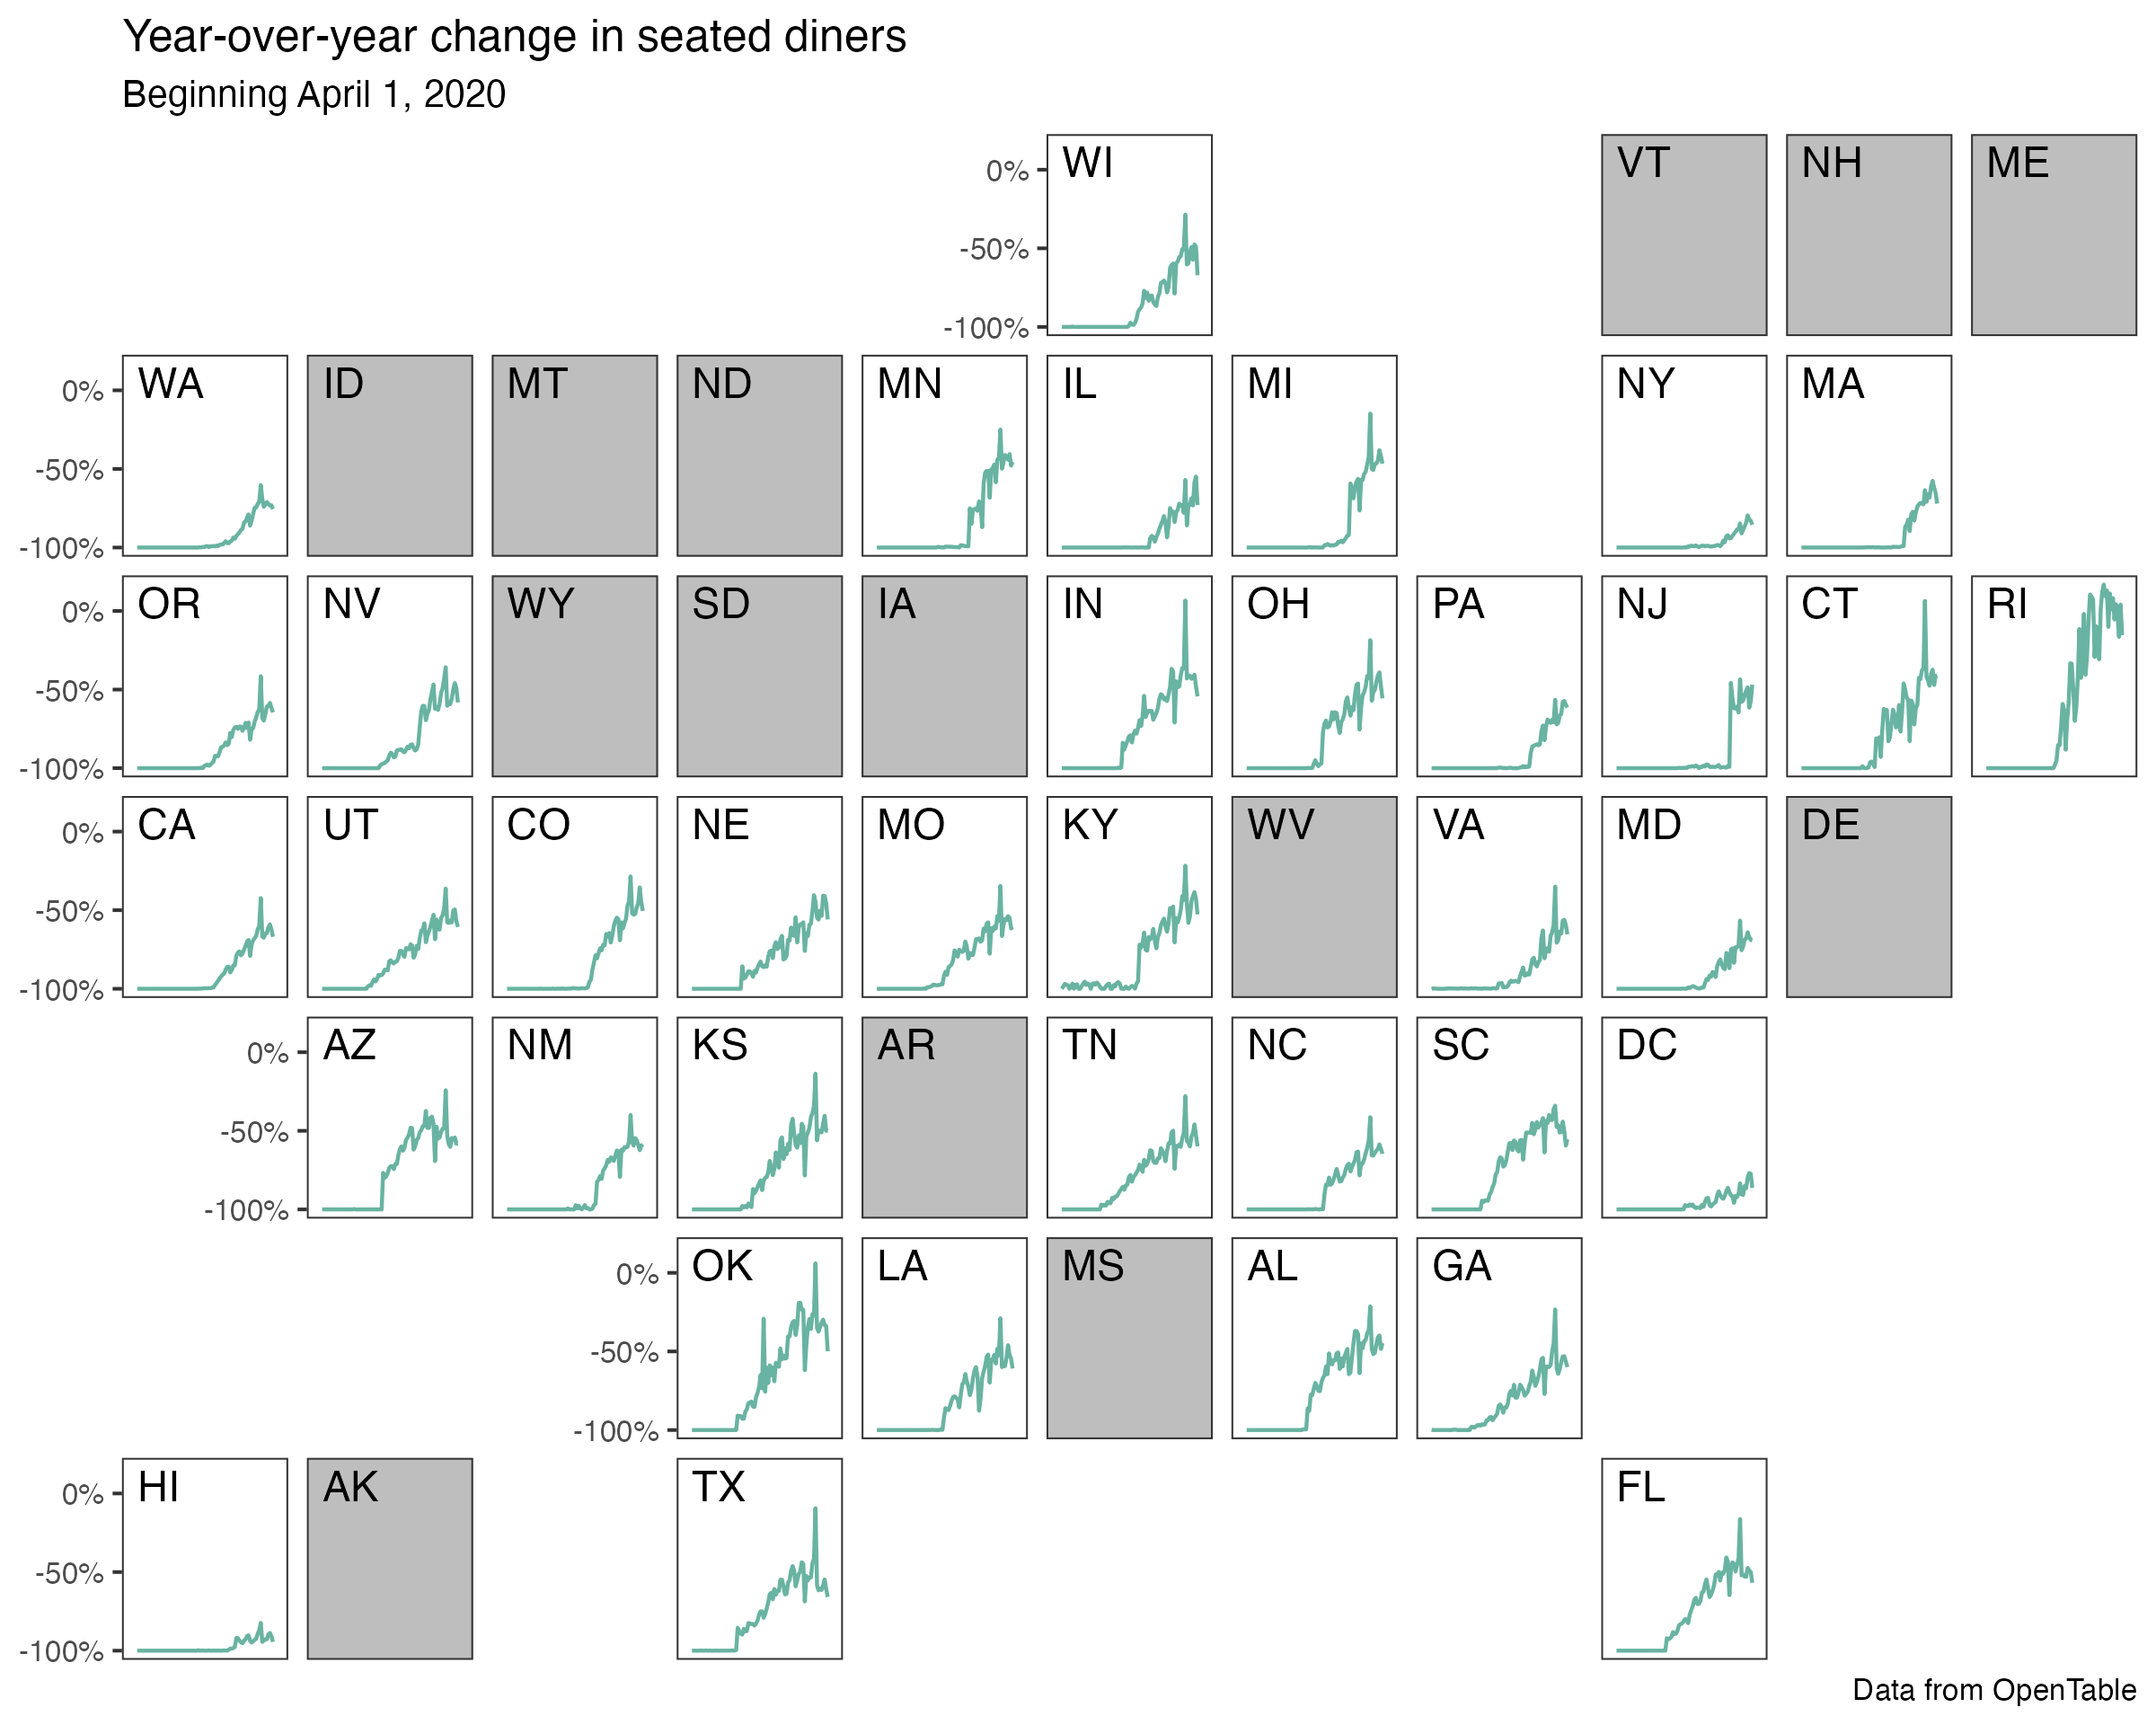
Clearly indicate missing data
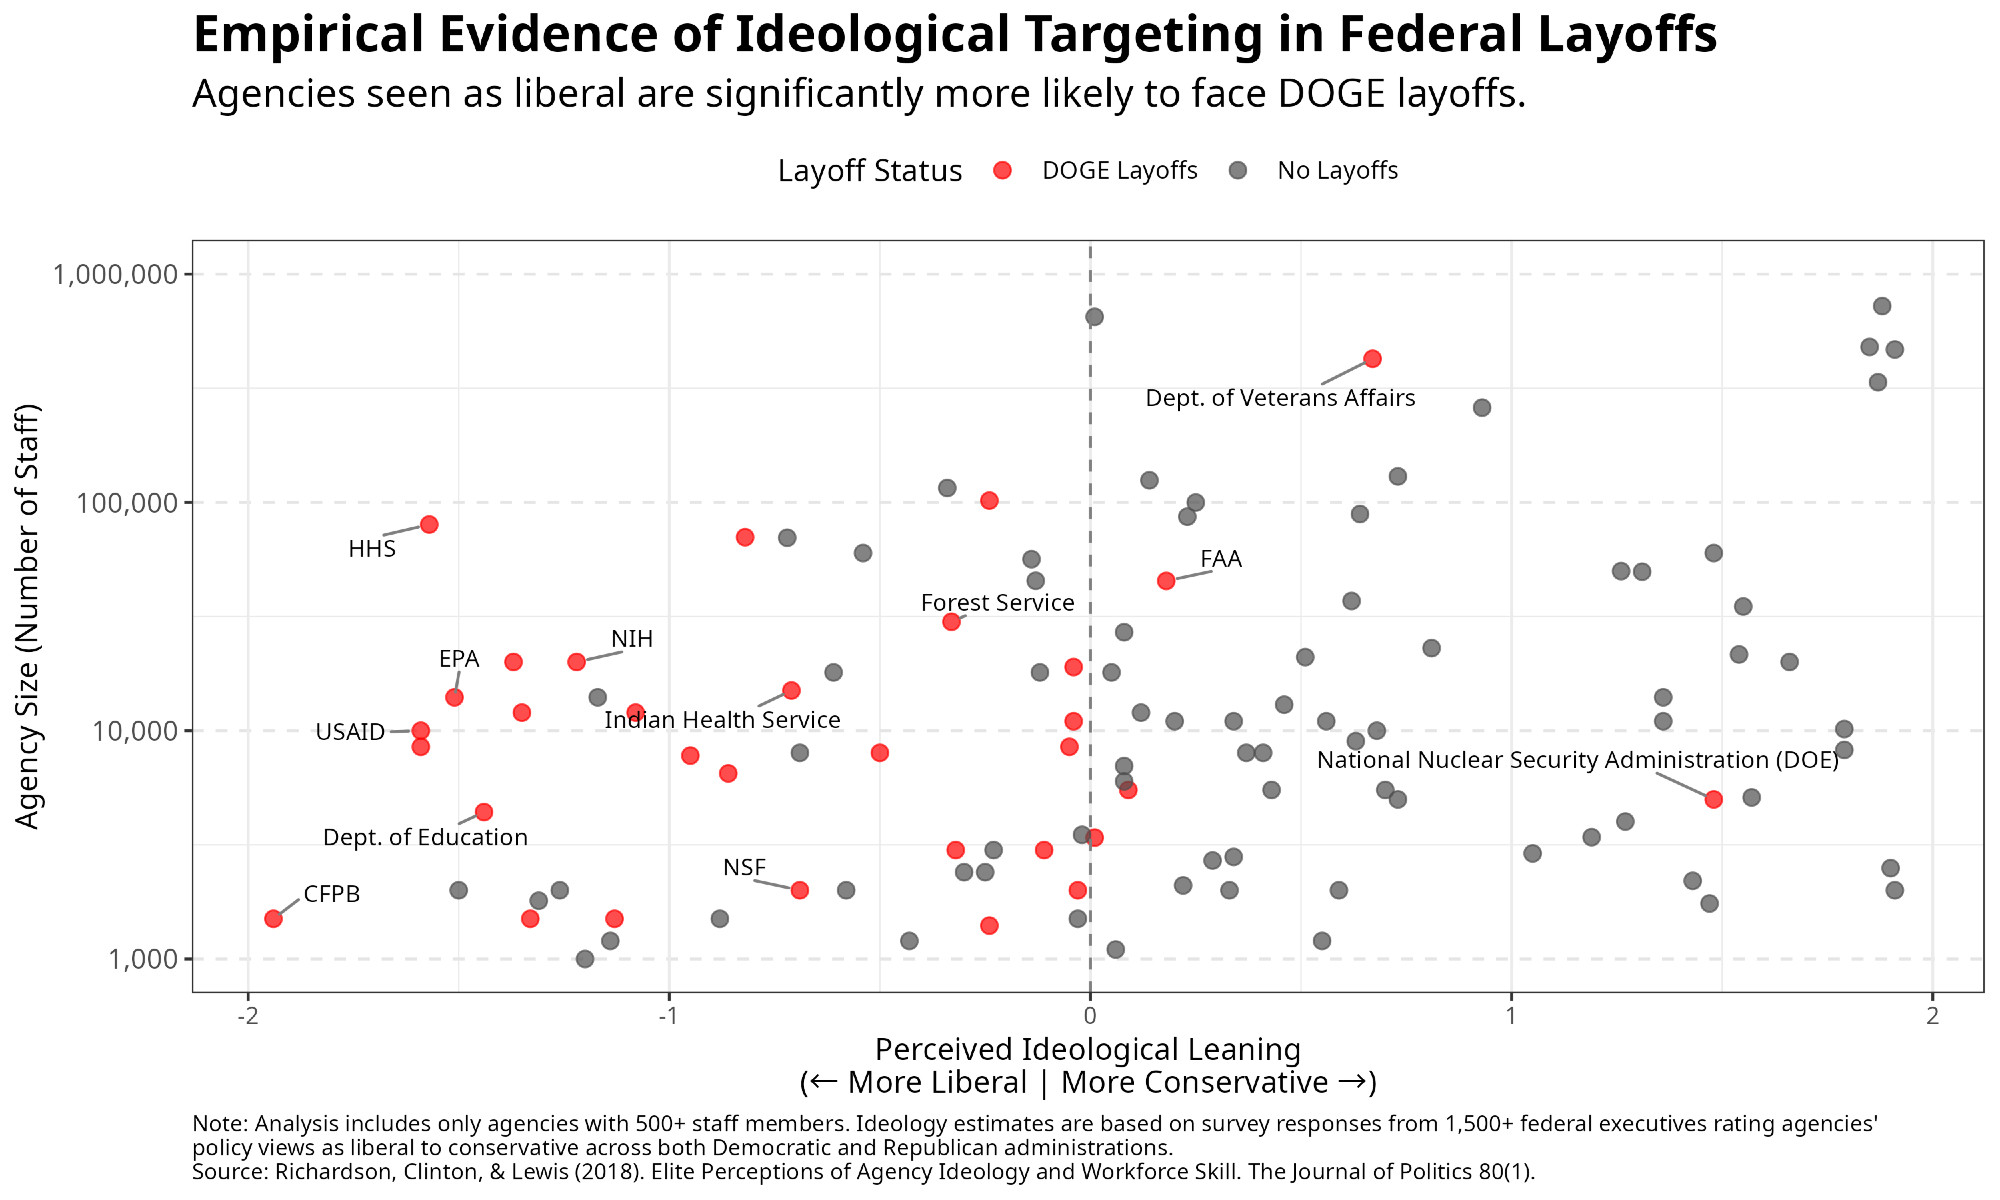
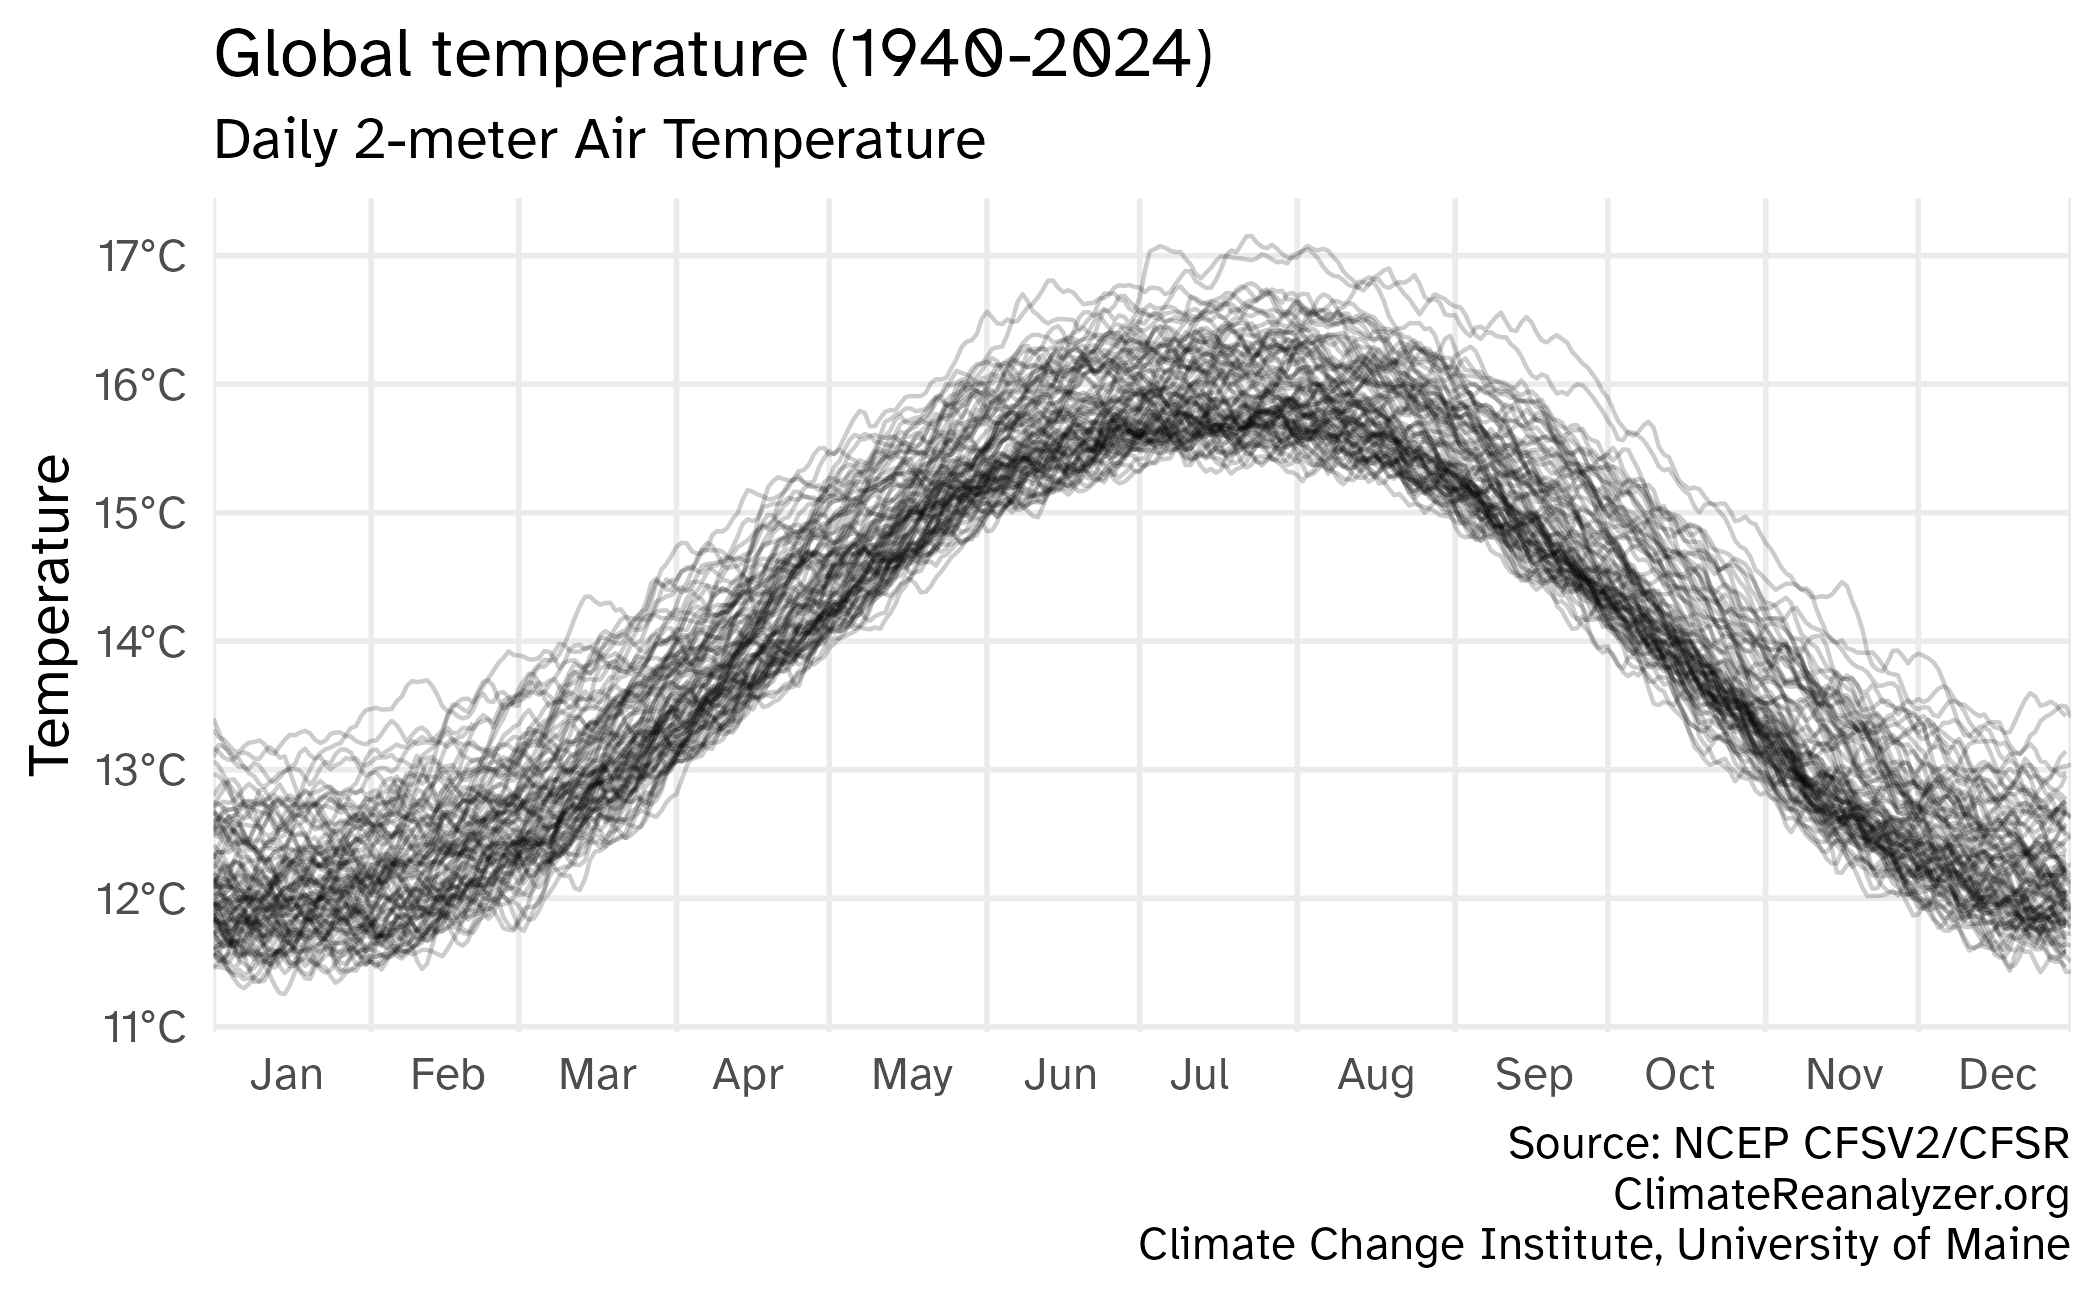
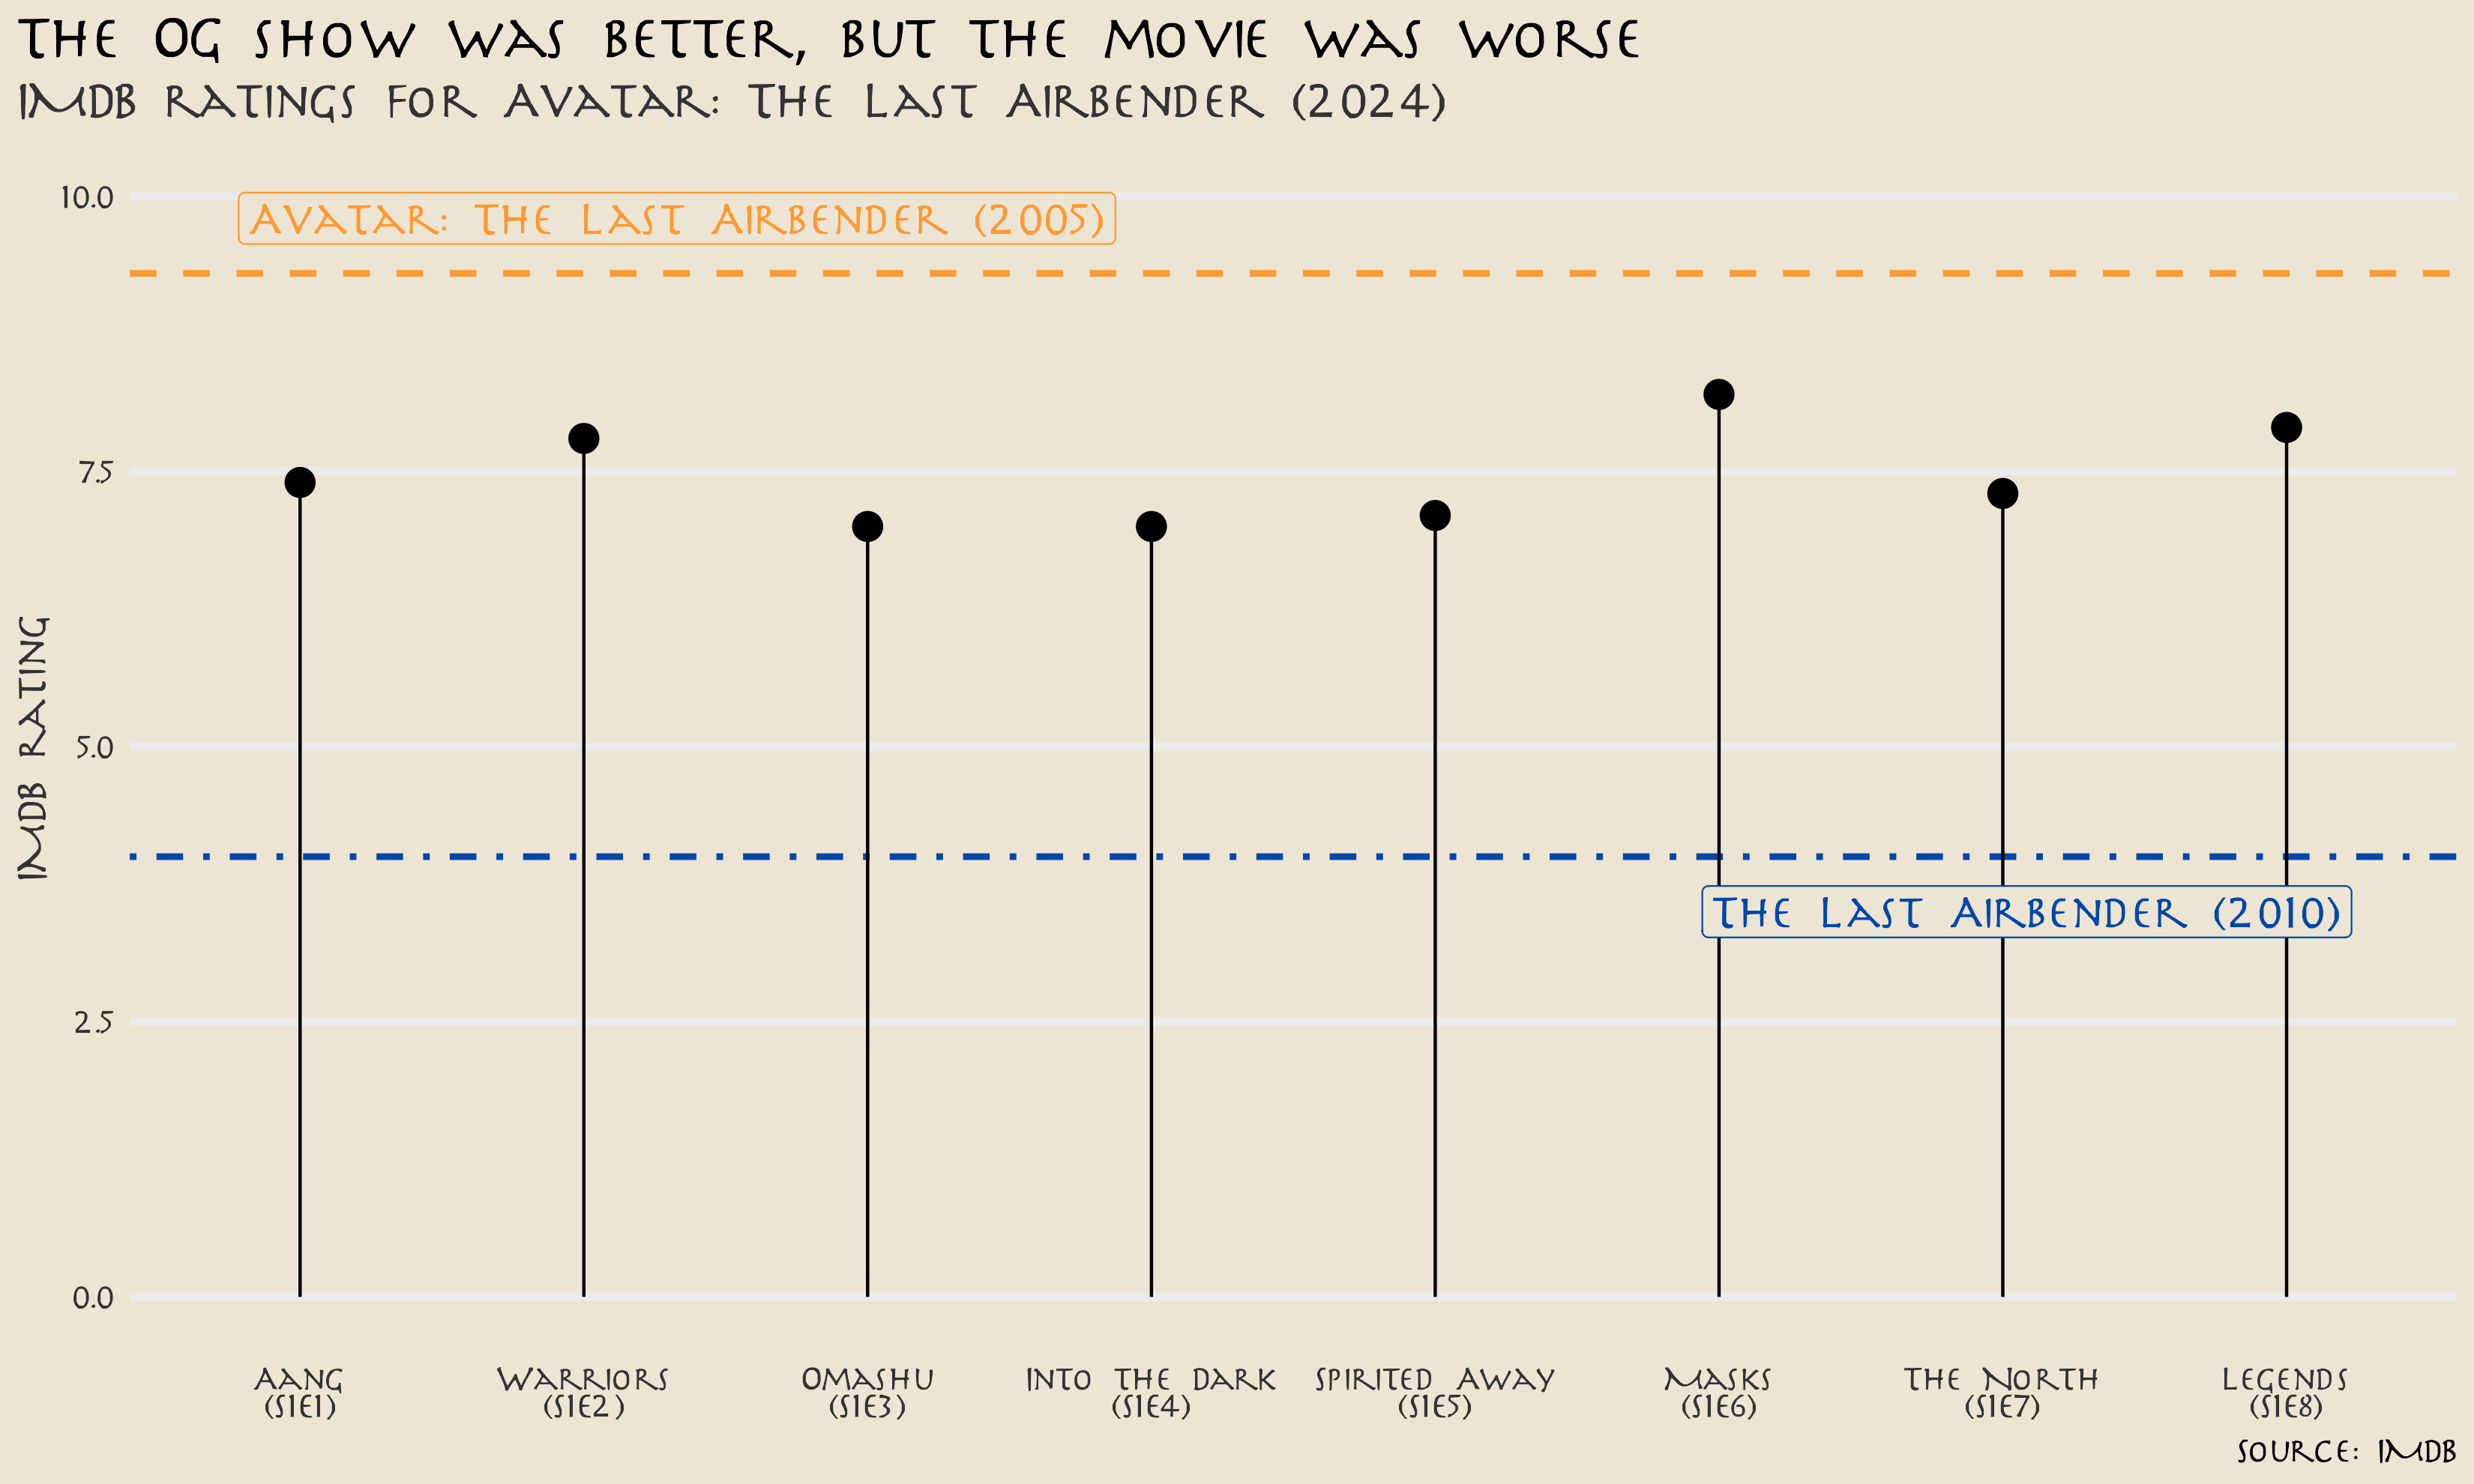
Use descriptive titles

Annotate figures
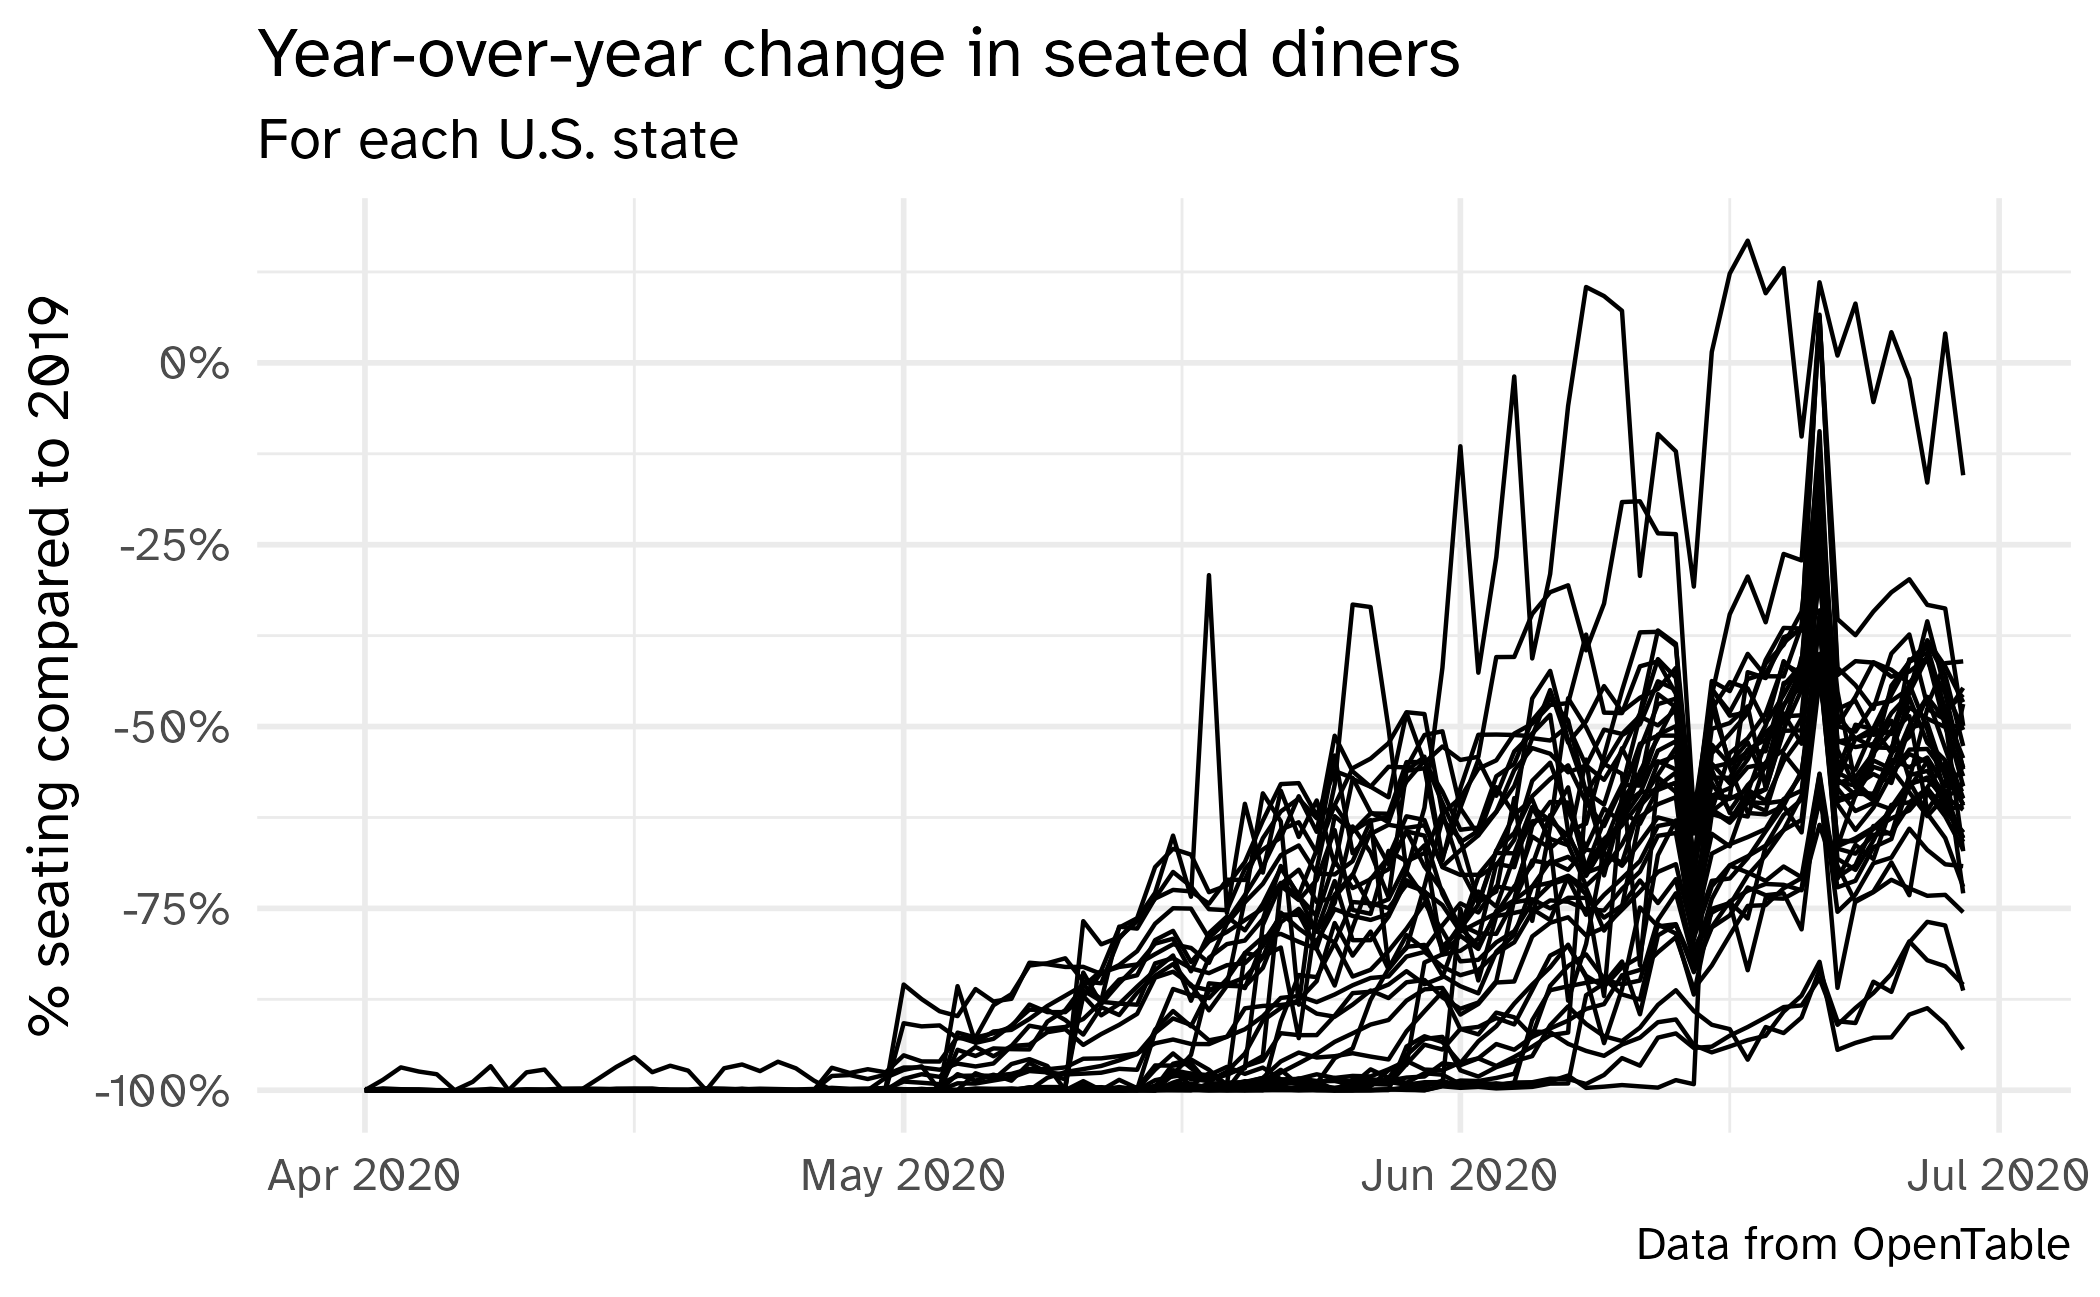
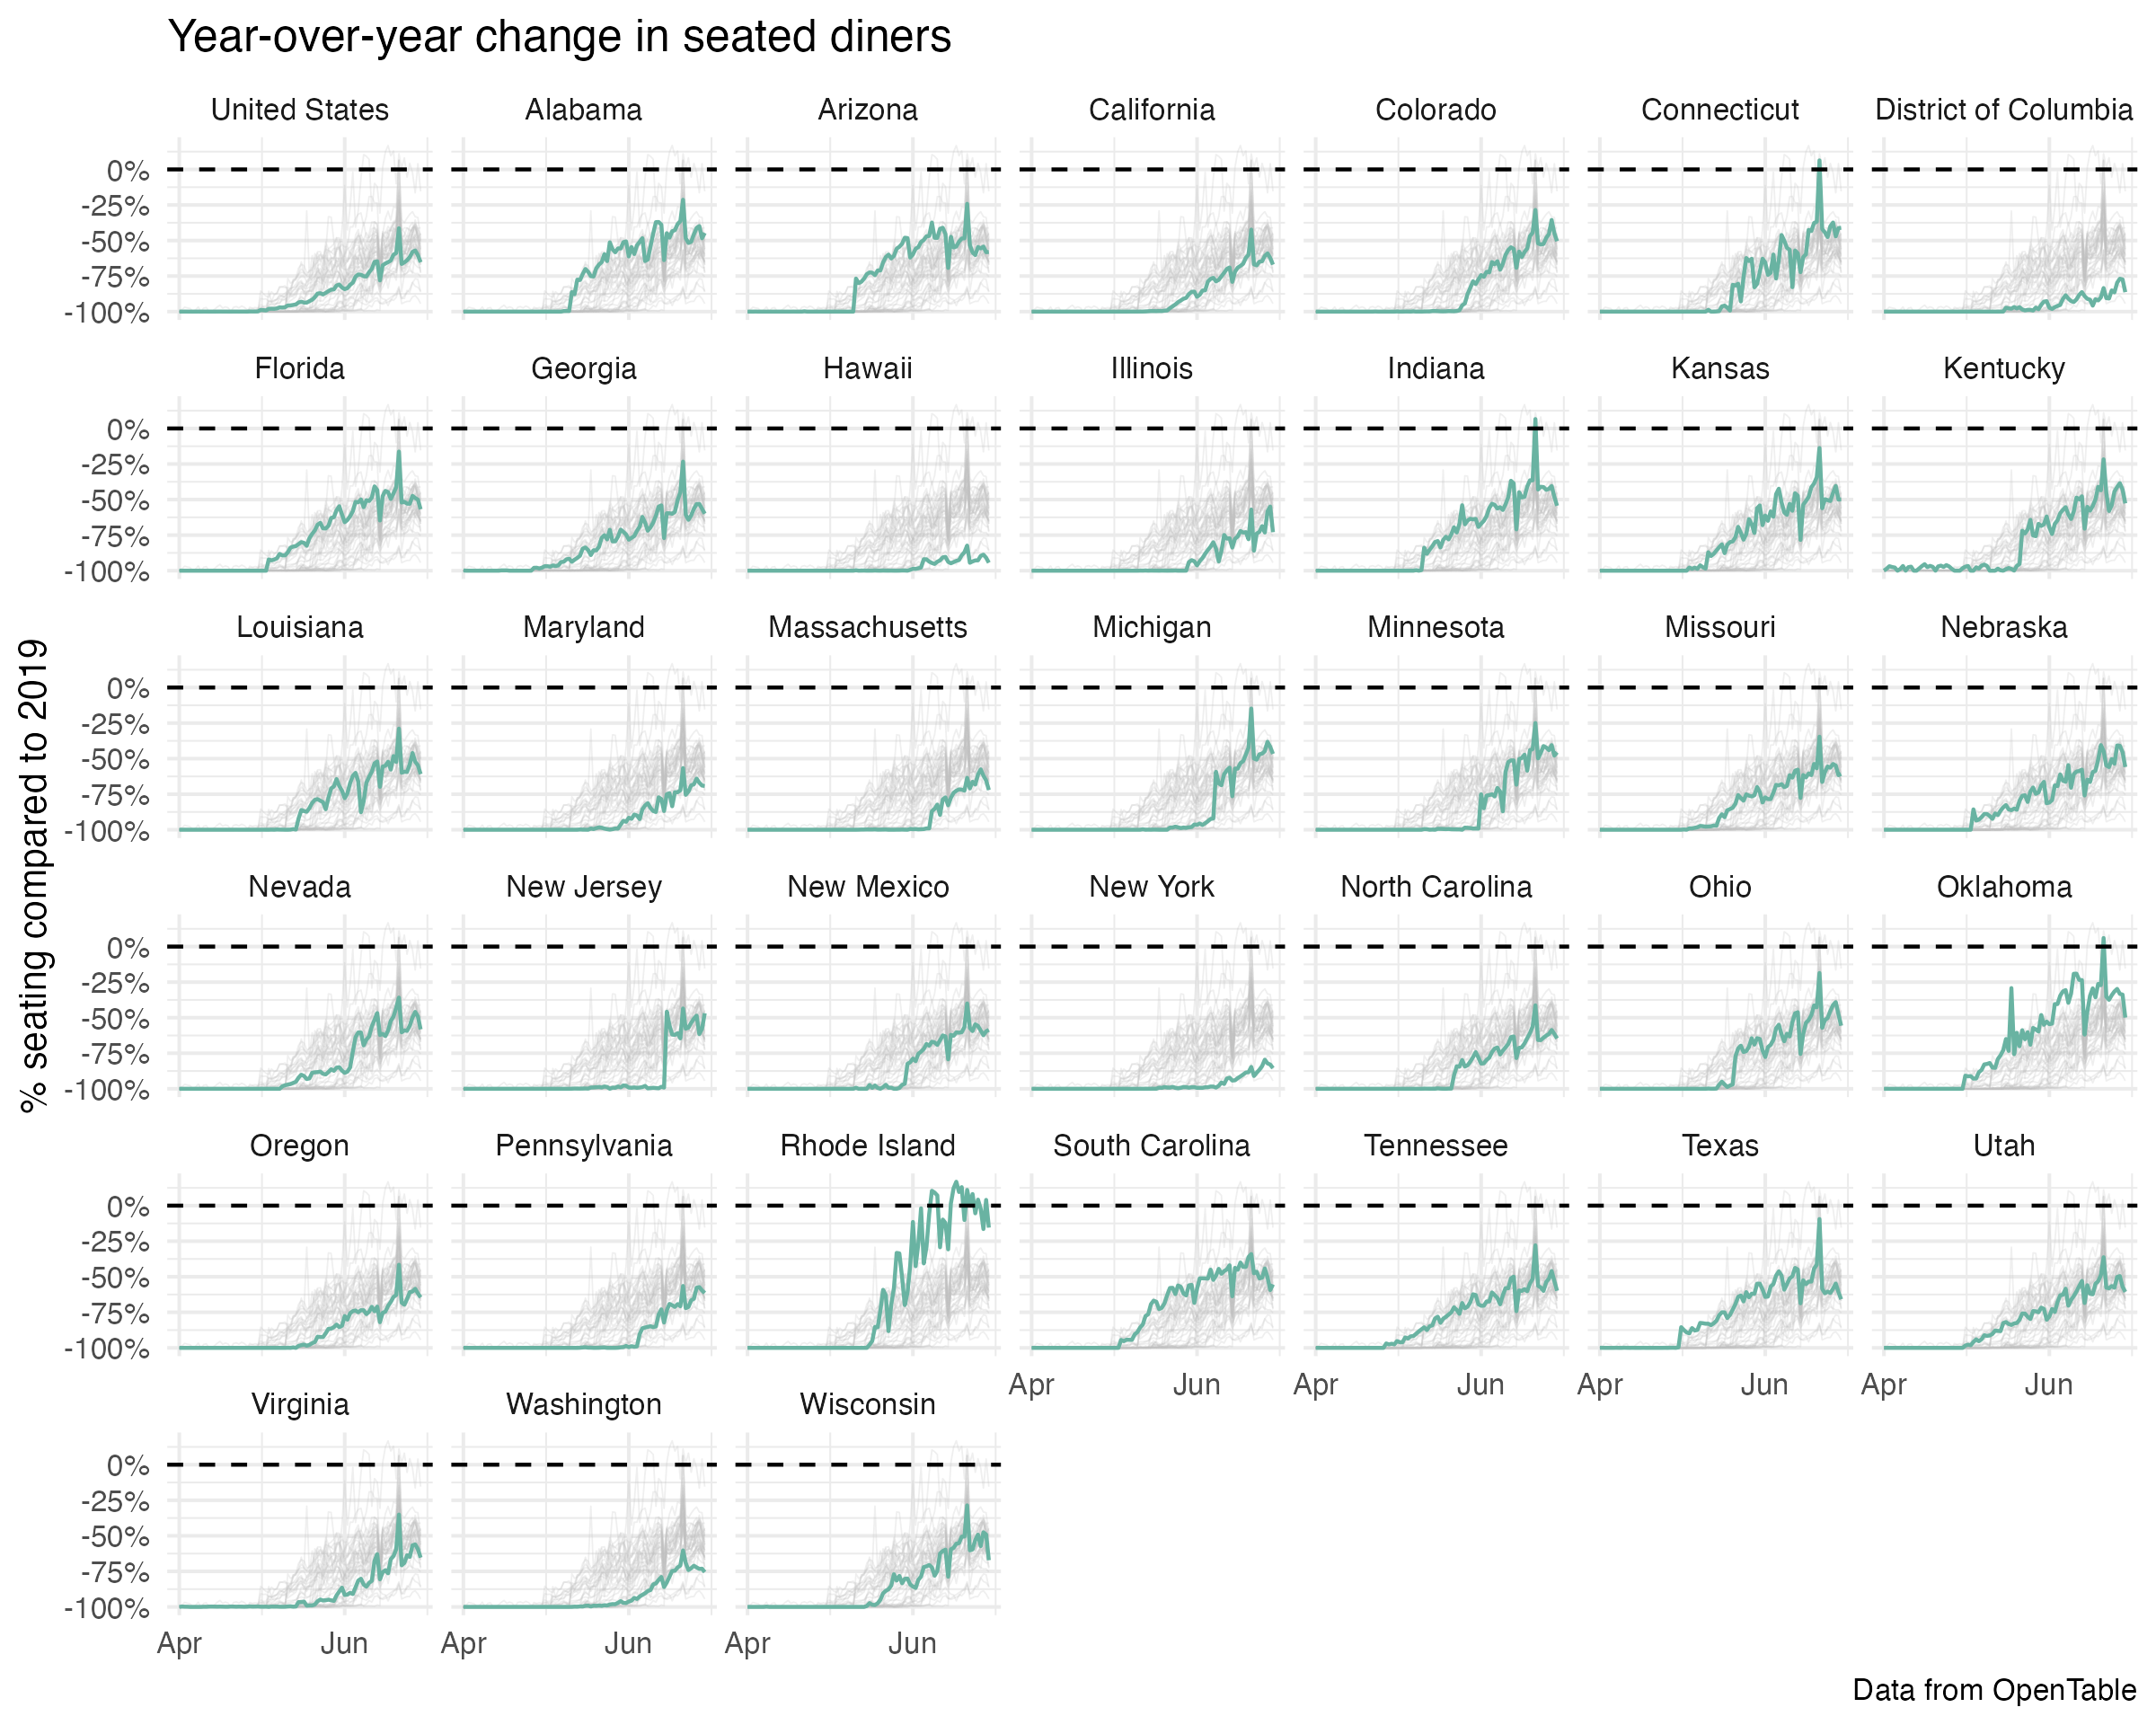
All the trends
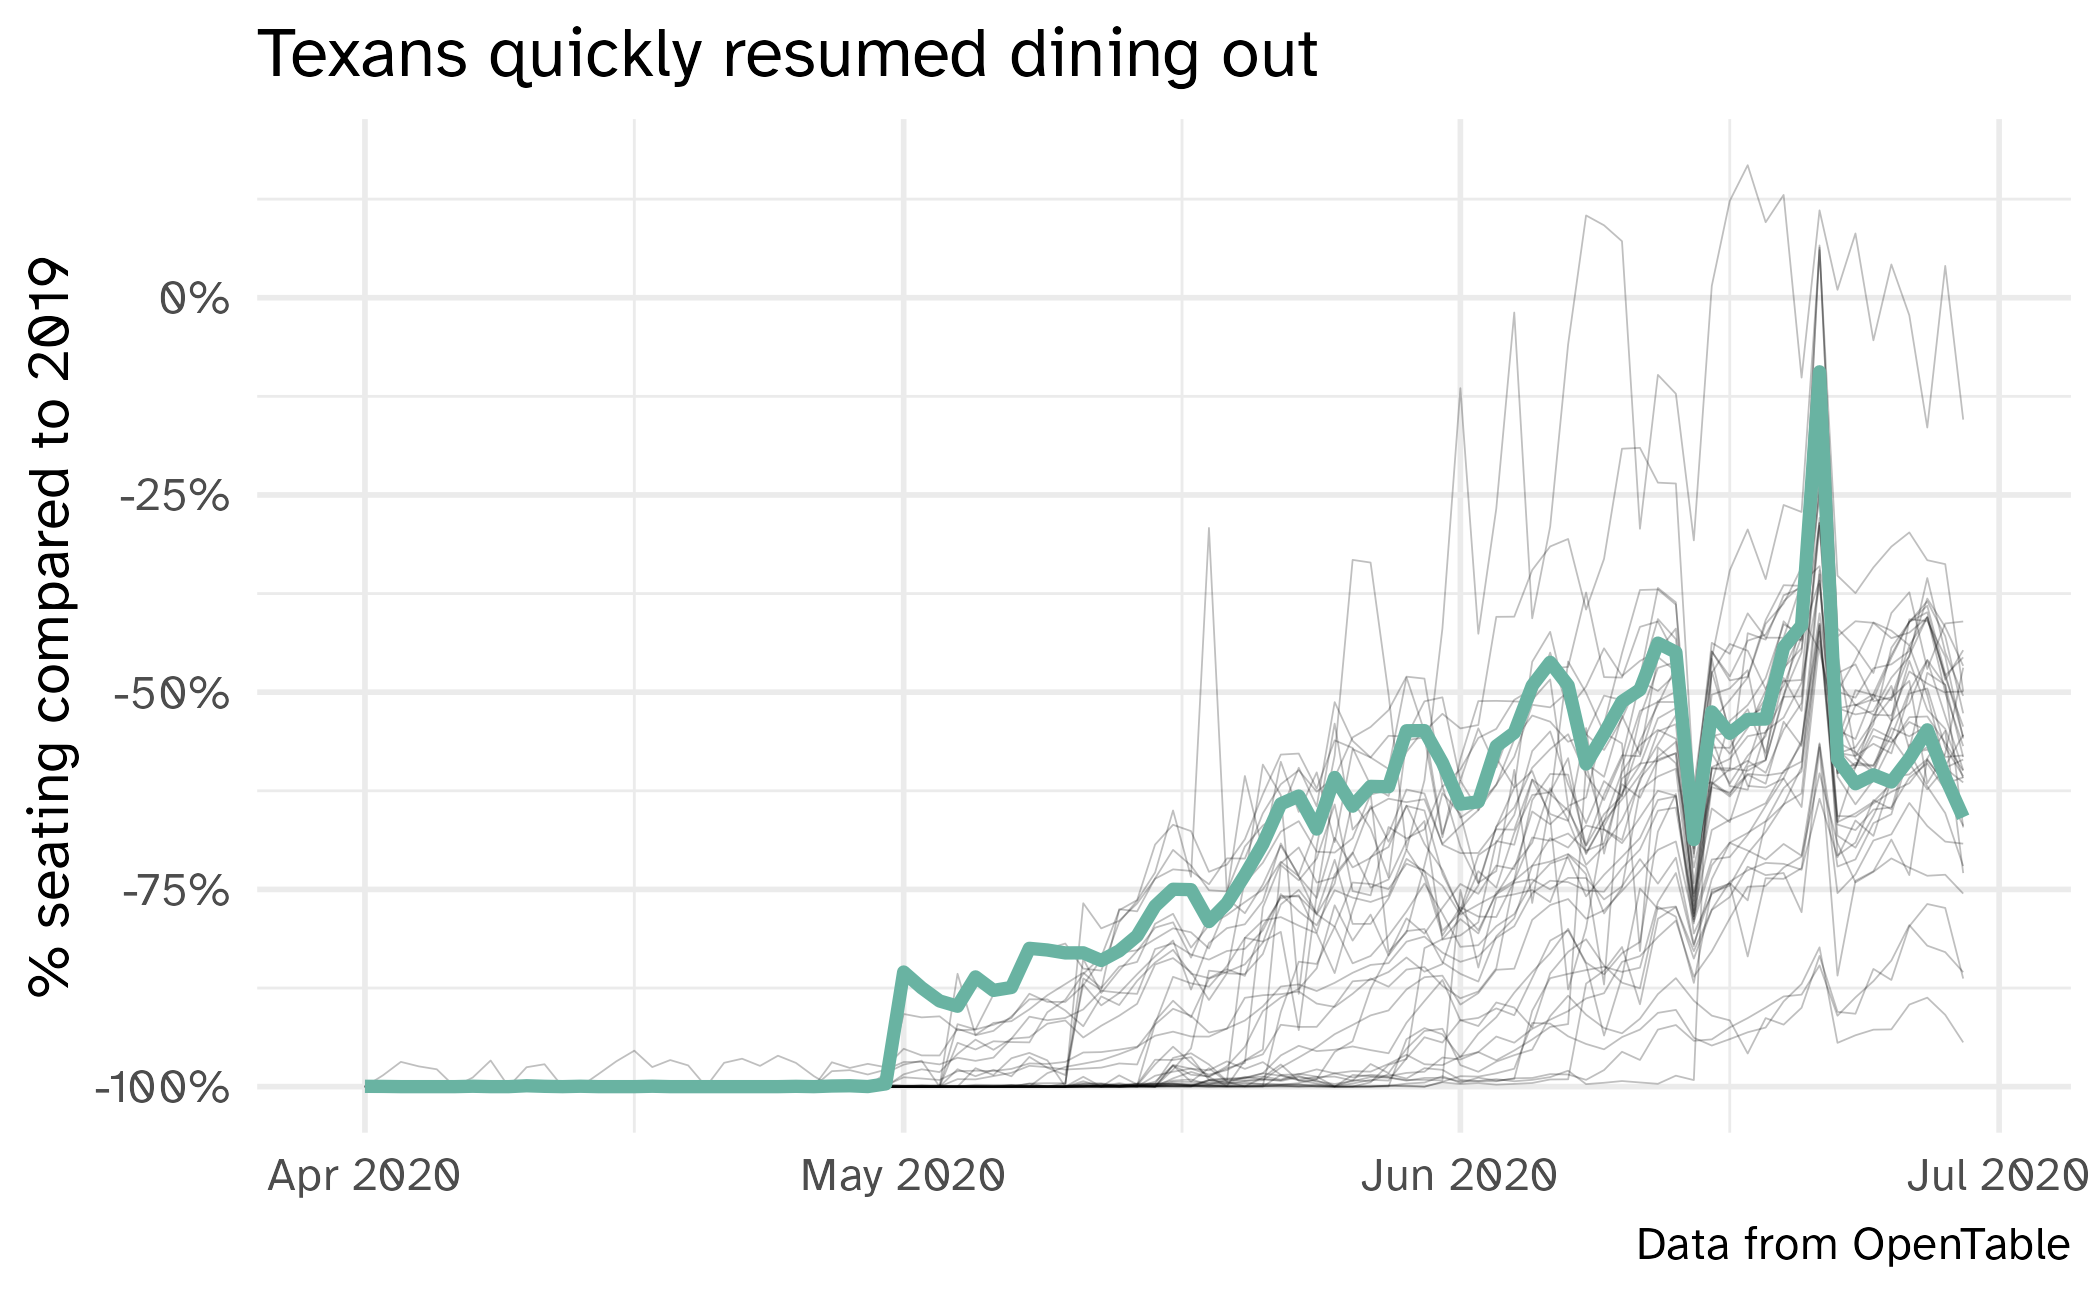
Highlight specific areas
Small multiples
Incorporate geography
Tell a different story