Presentation ready plots
Lecture 11
February 29, 2024
U.S. Median House Prices vs. Income

- What is the story?
- How does the visualization utilize annotations? How effective is it?
Keep it simple
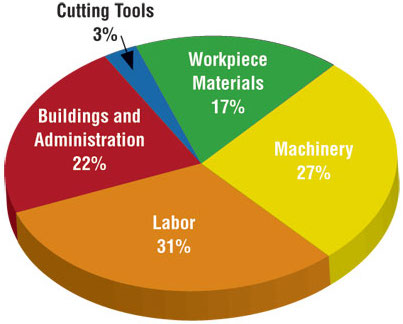
Judging relative area


Use color to draw attention


Clarify the story

Leave out non-story details


Order matters


Clearly indicate missing data

Reduce cognitive load


Use descriptive titles


Annotate figures

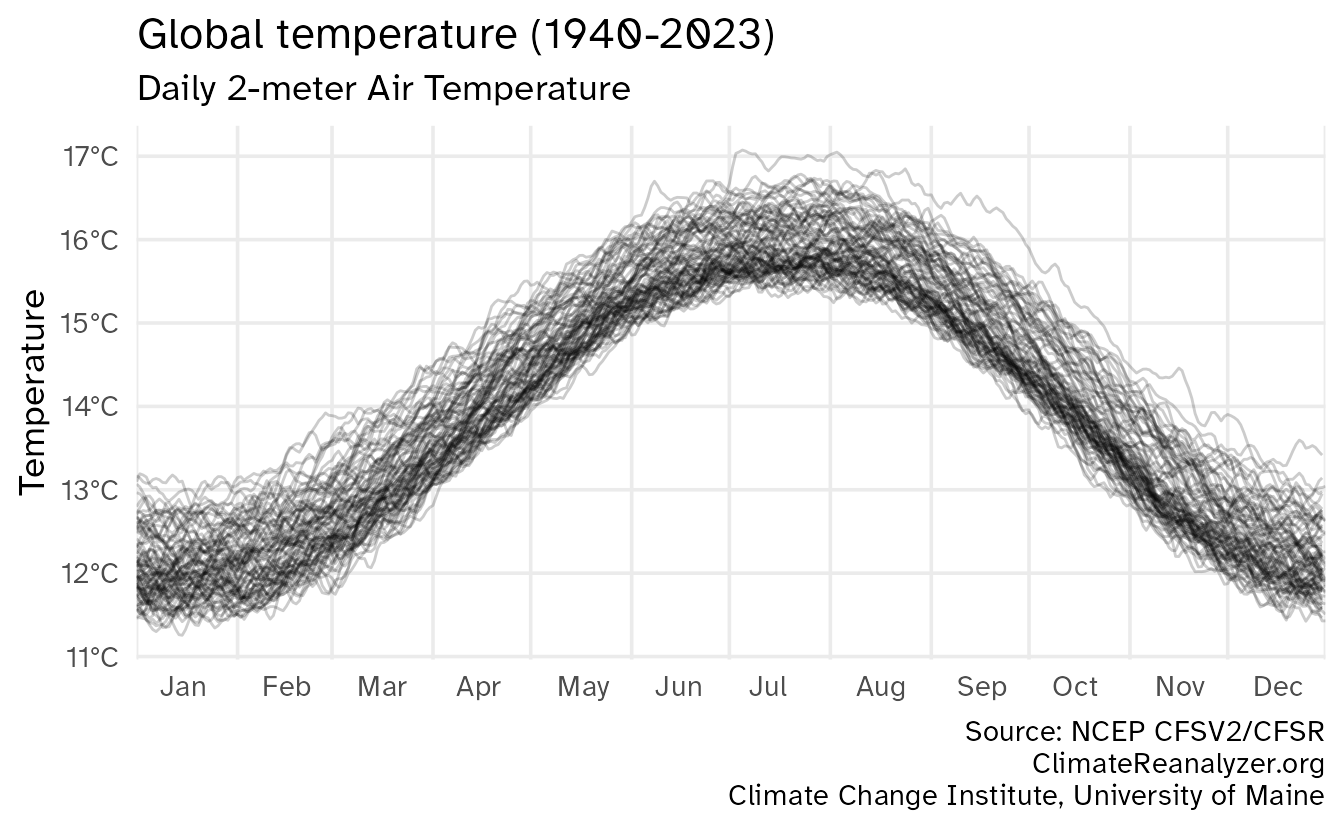
All the trends

Highlight specific areas

Small multiples

Incorporate geography

Tell a different story

Slide with single plot, little text
The plot will fill the empty space in the slide.

Slide with single plot, lots of text
If there is more text on the slide
The plot will shrink
To make room for the text

Small fig-width
For a zoomed-in look

Large fig-width
For a zoomed-out look

fig-width affects text size


Columns
Insert > Slide Columns
Quarto will automatically resize your plots to fit side-by-side.


layout-ncol


patchwork

patchwork layout I

patchwork layout II

patchwork layout III

patchwork layout IV

Code
library(tidyverse)
library(rvest)
library(tvthemes)

# get episode ratings for season 1
ratings_page <- read_html(x = "https://www.imdb.com/title/tt9018736/episodes/?ref_=tt_eps_sm")

# extract elements
ratings_raw <- tibble(
  episode = html_elements(x = ratings_page, css = ".bblZrR .ipc-title__text") |>
    html_text2(),
  rating = html_elements(x = ratings_page, css = ".ratingGroup--imdb-rating") |>
    html_text2()
)

# clean data
ratings <- ratings_raw |>
  # separate episode number and title
  separate_wider_delim(
    cols = episode,
    delim = " ∙ ",
    names = c("episode_number", "episode_title")
  ) |>
  separate_wider_delim(
    cols = episode_number,
    delim = ".",
    names = c("season", "episode_number")
  ) |>
  # separate rating and number of votes
  separate_wider_delim(
    cols = rating,
    delim = " ",
    names = c("rating", "votes")
  ) |>
  # convert numeric variables
  mutate(
    across(
      .cols = -episode_title,
      .fns = parse_number
    ),
    votes = votes * 1e03
  )

# draw the plot
ratings |>
  # generate x-axis tick mark labels with title and epsiode number
  mutate(
    episode_title = str_glue("{episode_title}\n(S{season}E{episode_number})"),
    episode_title = fct_reorder(.f = episode_title, .x = episode_number)
  ) |>
  # draw a lollipop chart
  ggplot(mapping = aes(x = episode_title, y = rating)) +
  geom_point(mapping = aes(size = votes)) +
  geom_segment(
    mapping = aes(
      x = episode_title, xend = episode_title,
      y = 0, yend = rating
    )
  ) +
  # adjust the size scale
  scale_size(range = c(3, 8)) +
  # label the chart
  labs(
    title = "Live-action Avatar The Last Airbender is decent",
    x = NULL,
    y = "IMDB rating",
    caption = "Source: IMDB"
  ) +
  # use an Avatar theme
  theme_avatar(
    # custom font
    title.font = "Slayer",
    text.font = "Slayer",
    legend.font = "Slayer",
    # shrink legend text size
    legend.title.size = 8,
    legend.text.size = 6
  ) +
  theme(
    # remove undesired grid lines
    panel.grid.major.x = element_blank(),
    panel.grid.minor.y = element_blank(),
    # move legend to the top
    legend.position = "top",
    # align title flush with the edge
    plot.title.position = "plot",
    # shink x-axis text labels to fit
    axis.text.x = element_text(size = rel(x = 0.7))
  )
It was decent