Data wrangling (II)
Lecture 8
Dr. Benjamin Soltoff
Cornell University
INFO 3312/5312 - Spring 2026
February 12, 2026
Announcements
Announcements
- Draft proposal rendered + committed + pushed to GitHub by 11:59pm tonight
- Peer evaluations tomorrow 💘 before you depart for February Break
- Homework 3 distributed tomorrow, due the 26th
Learning objectives
- Review relational data structures
- Implement relational joins and data wrangling to construct a complex data visualization
Visualization critique
Which is a better chart?
Source: Me
Design a better plot
ae-06
Design a better plot
Create a chart that emphasizes the increased reliance of part-time faculty in academia.
20:00
Relational data structures
Introduction to relational data
- Multiple tables of data that when combined together accomplish goals
- Relations define the important element, not just the individual tables
- Relations are defined between a pair of tables
- Relational verbs
- Mutating joins
- Filtering joins

Comic book characters
| Name | Alignment | Gender | Publisher |
|---|---|---|---|
| Deadpool | Chaotic | Male | Marvel |
| Batman | Good | Male | DC |
| Sabrina | Good | Female | Archie Comics |
Publishers
| Publisher | Year founded |
|---|---|
| DC | 1934 |
| Marvel | 1939 |
| Image | 1992 |
Mutating joins
inner_join()
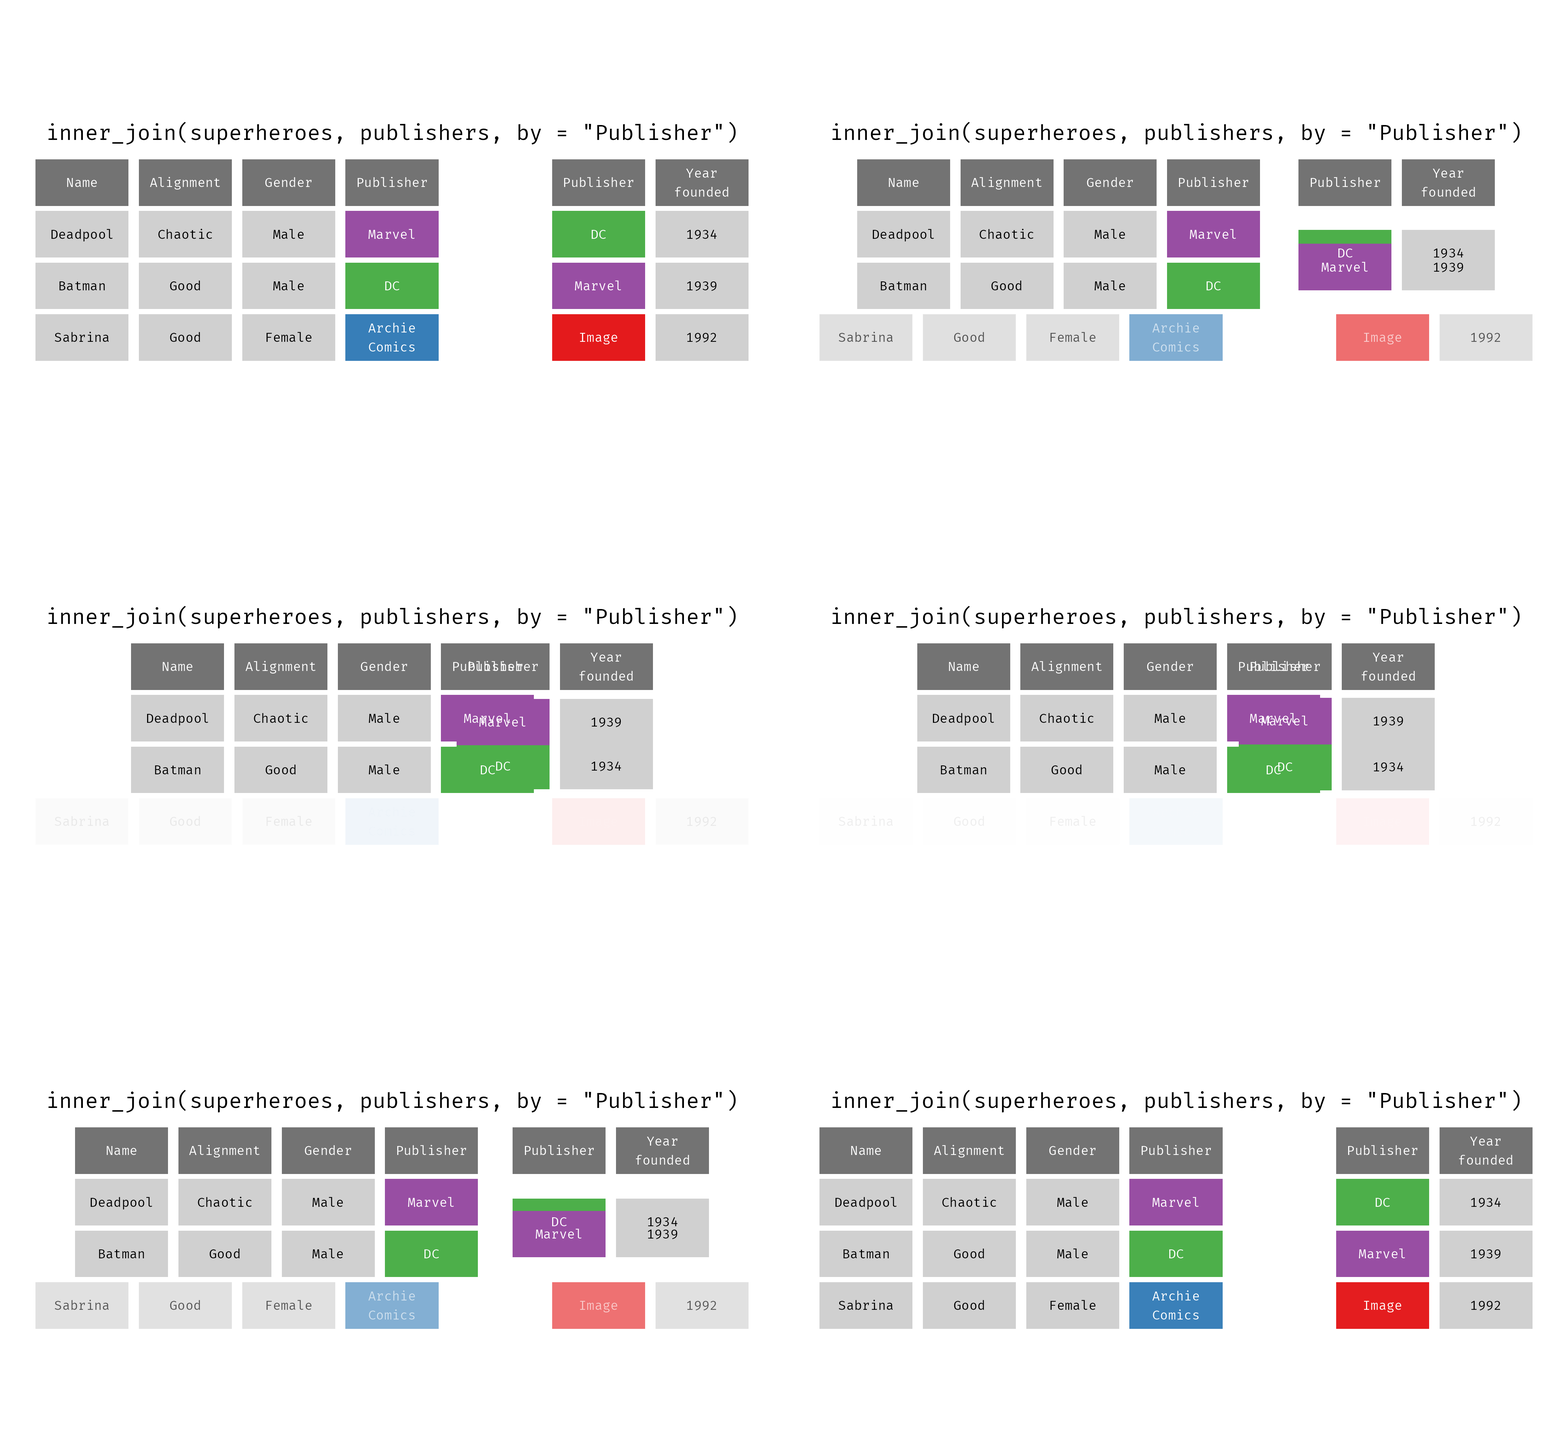
inner_join()
left_join()
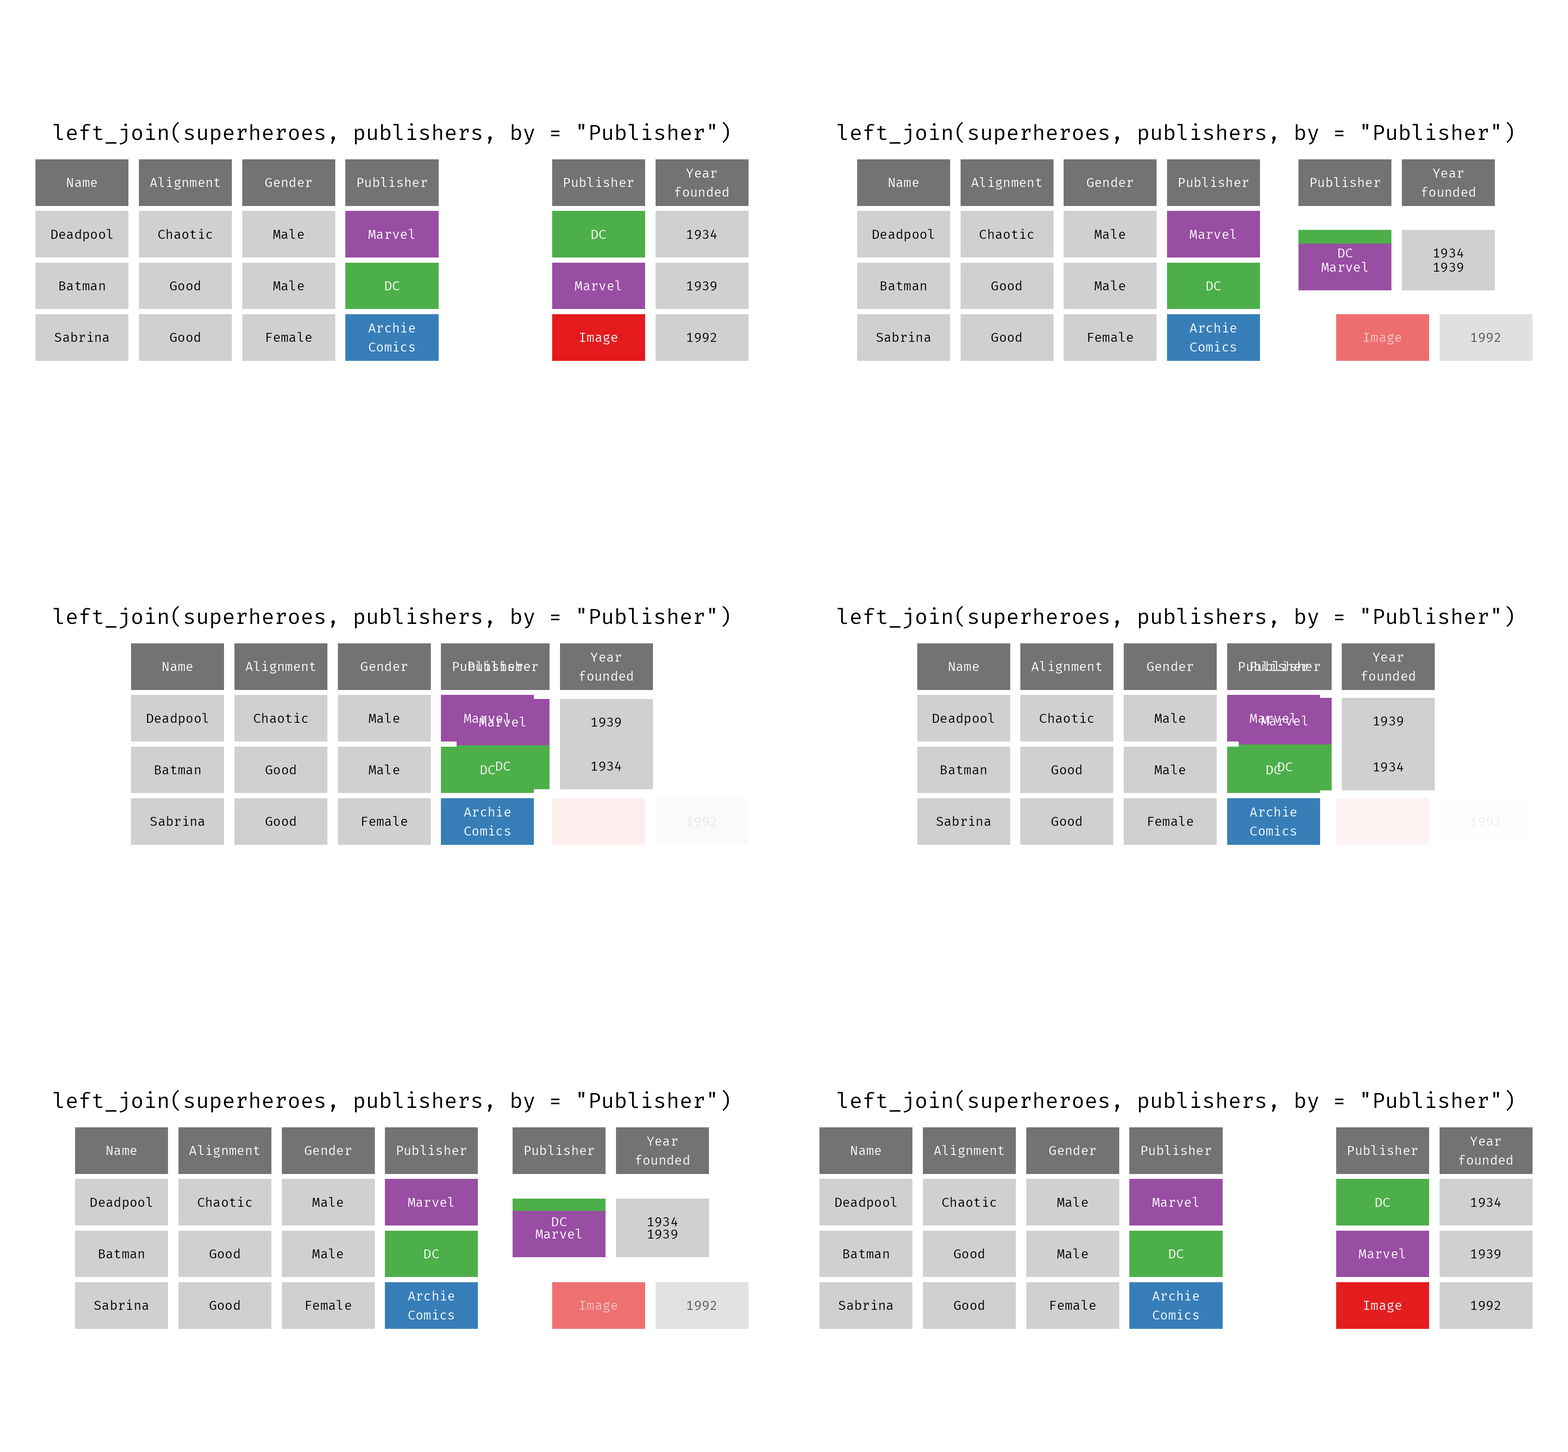
left_join()
right_join()
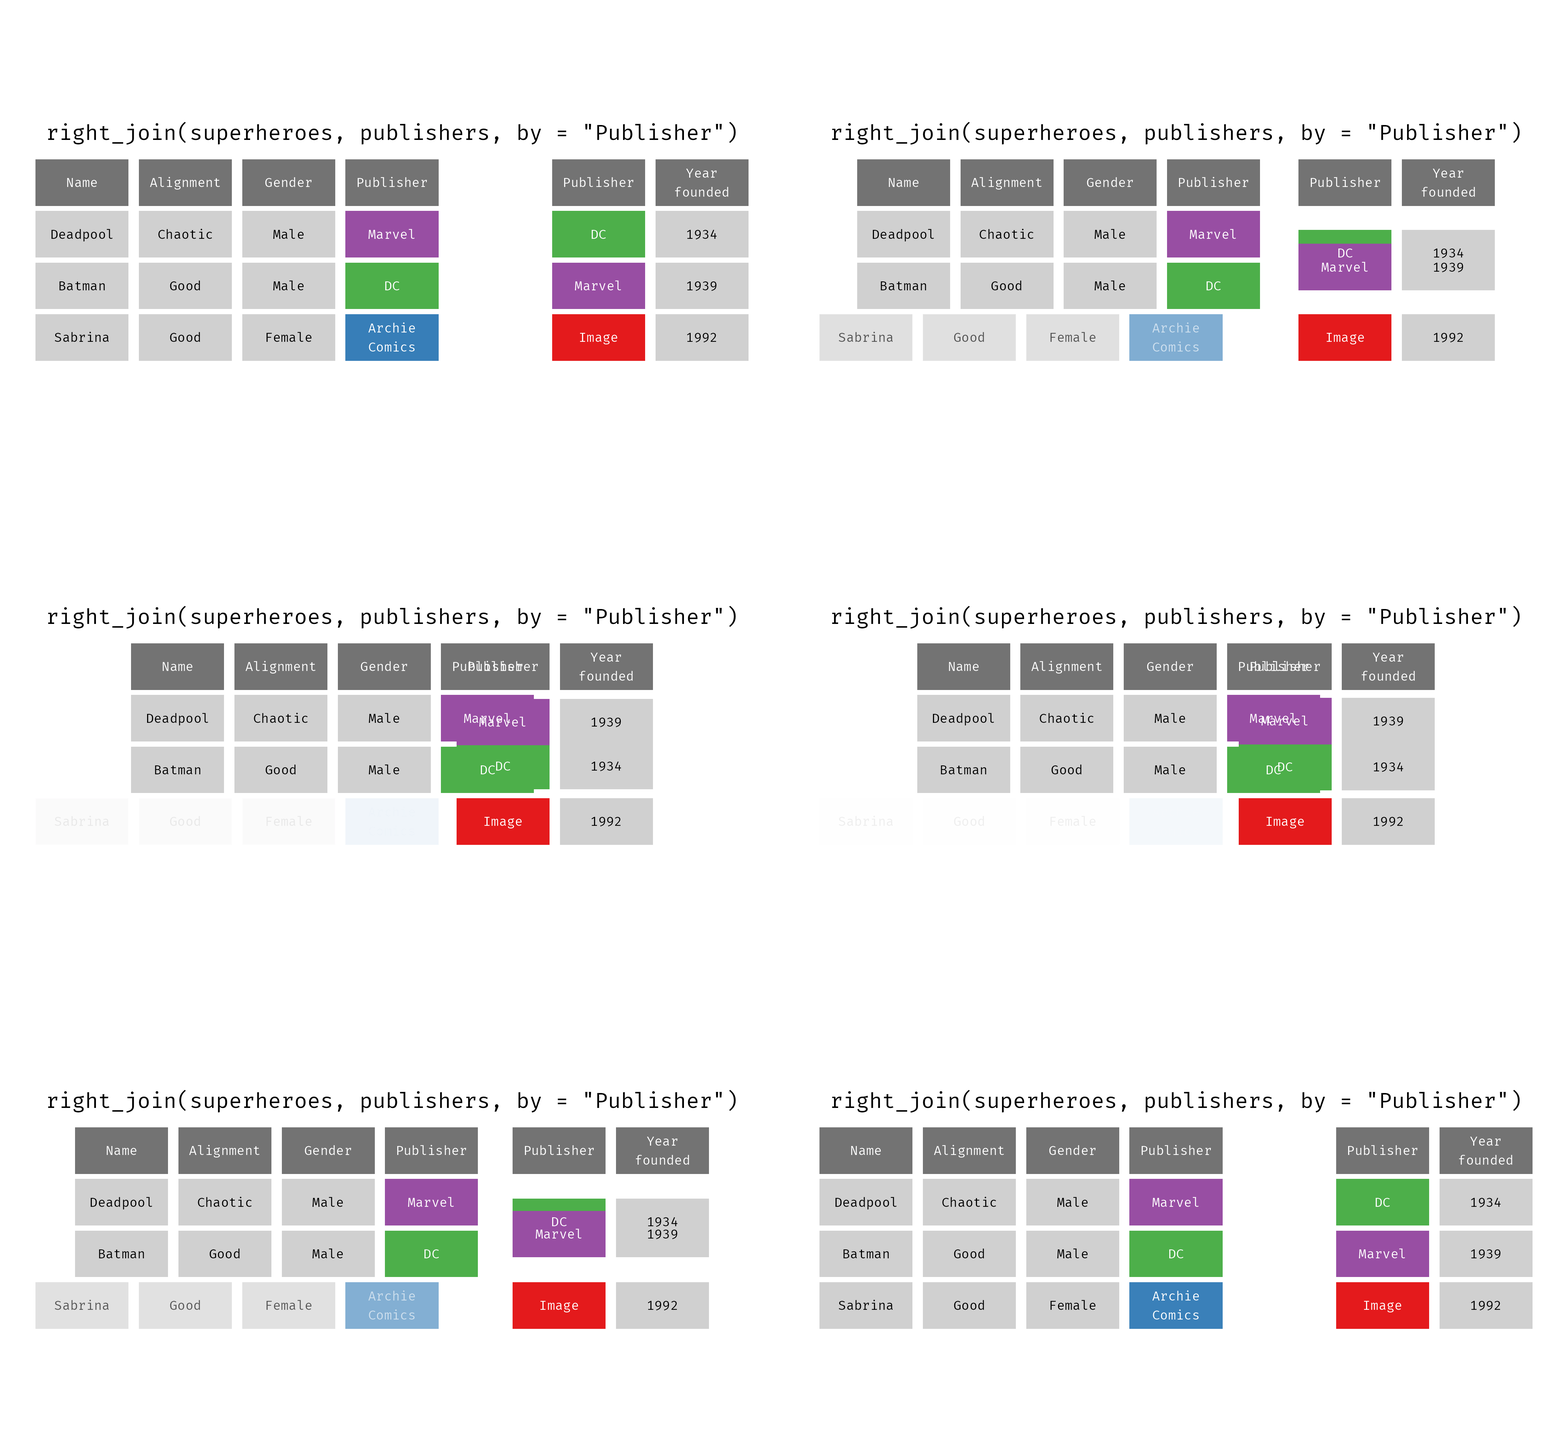
right_join()
right_join() reversed
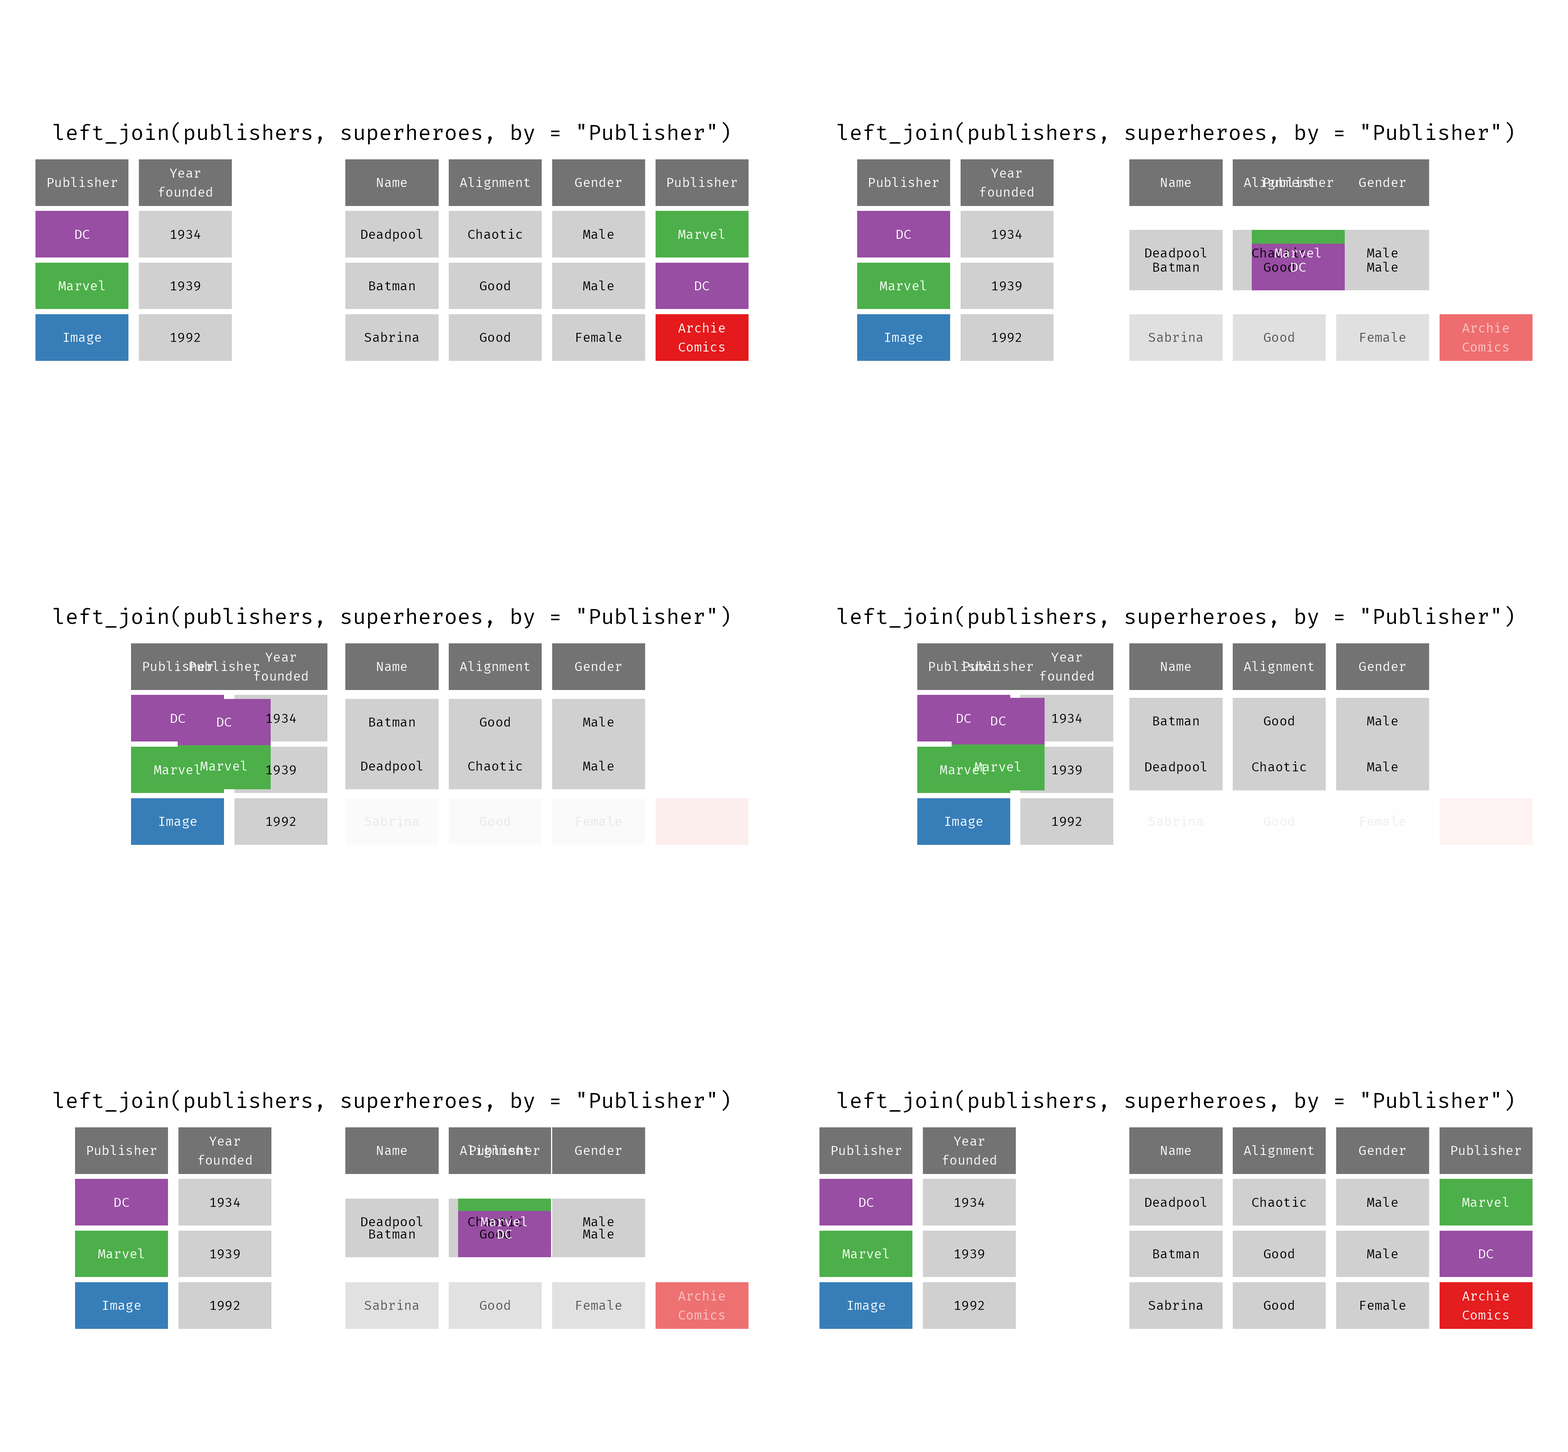
full_join()
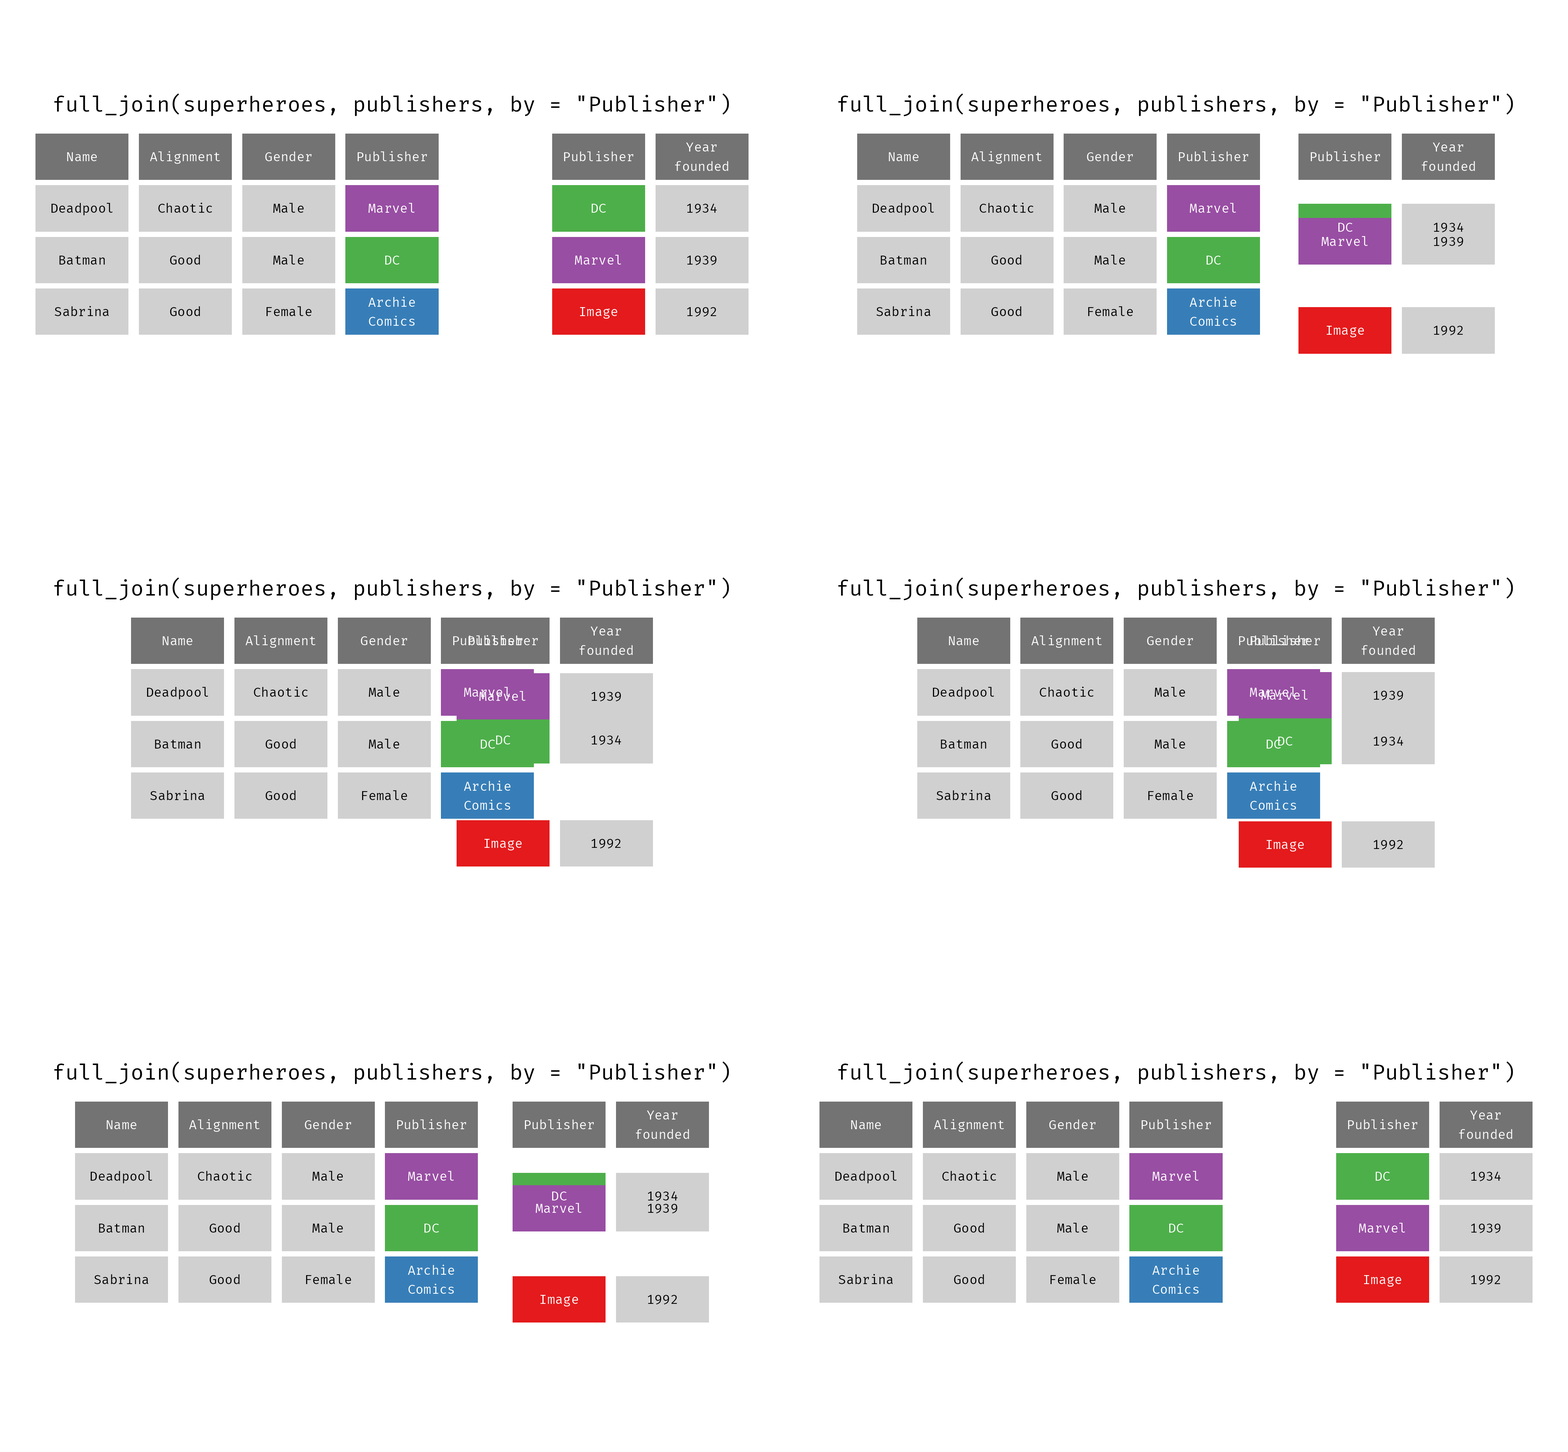
full_join()
# A tibble: 4 × 5
  Name     Alignment Gender Publisher        `Year\nfounded`
  <chr>    <chr>     <chr>  <chr>                      <dbl>
1 Deadpool Chaotic   Male   "Marvel"                    1939
2 Batman   Good      Male   "DC"                        1934
3 Sabrina  Good      Female "Archie\nComics"              NA
4 <NA>     <NA>      <NA>   "Image"                     1992
Filtering joins
semi_join()
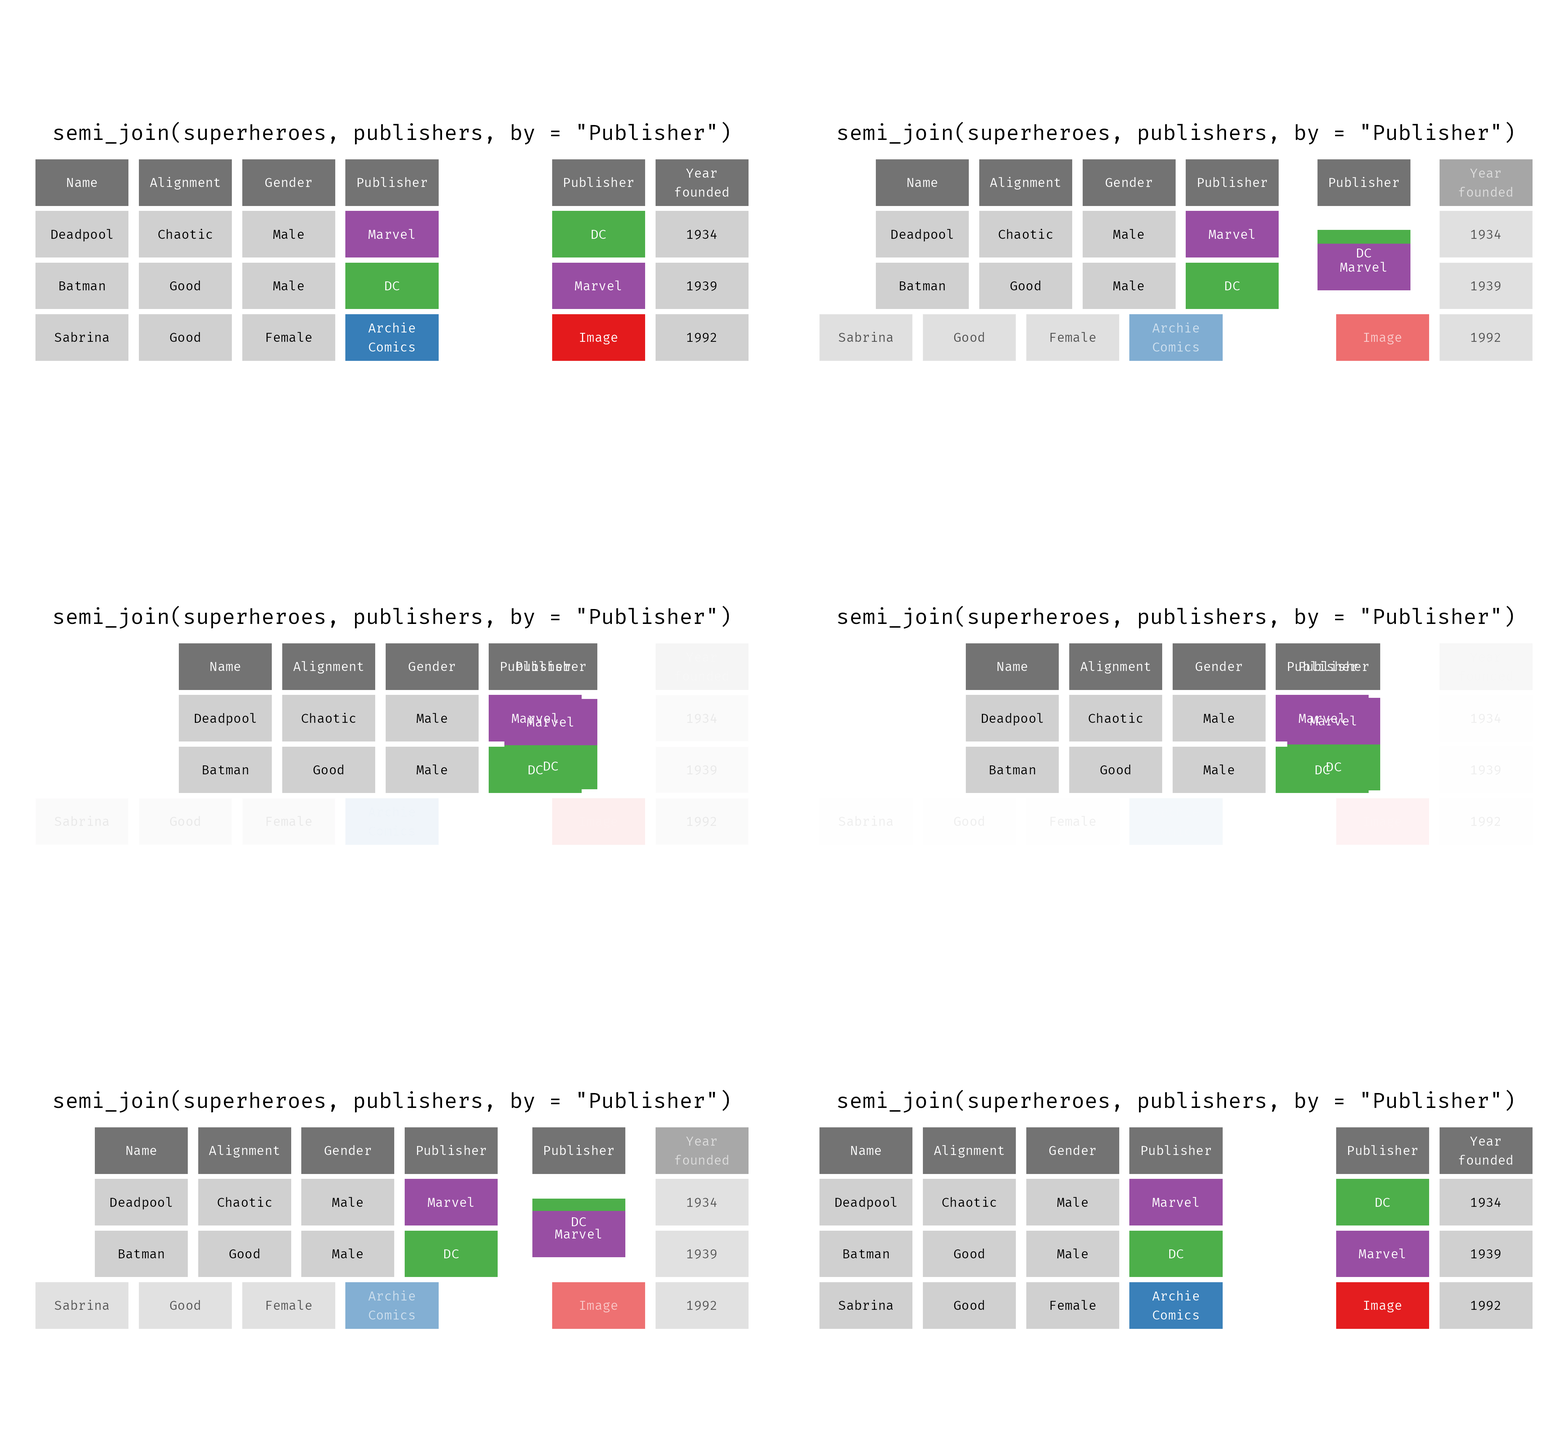
semi_join()
anti_join()
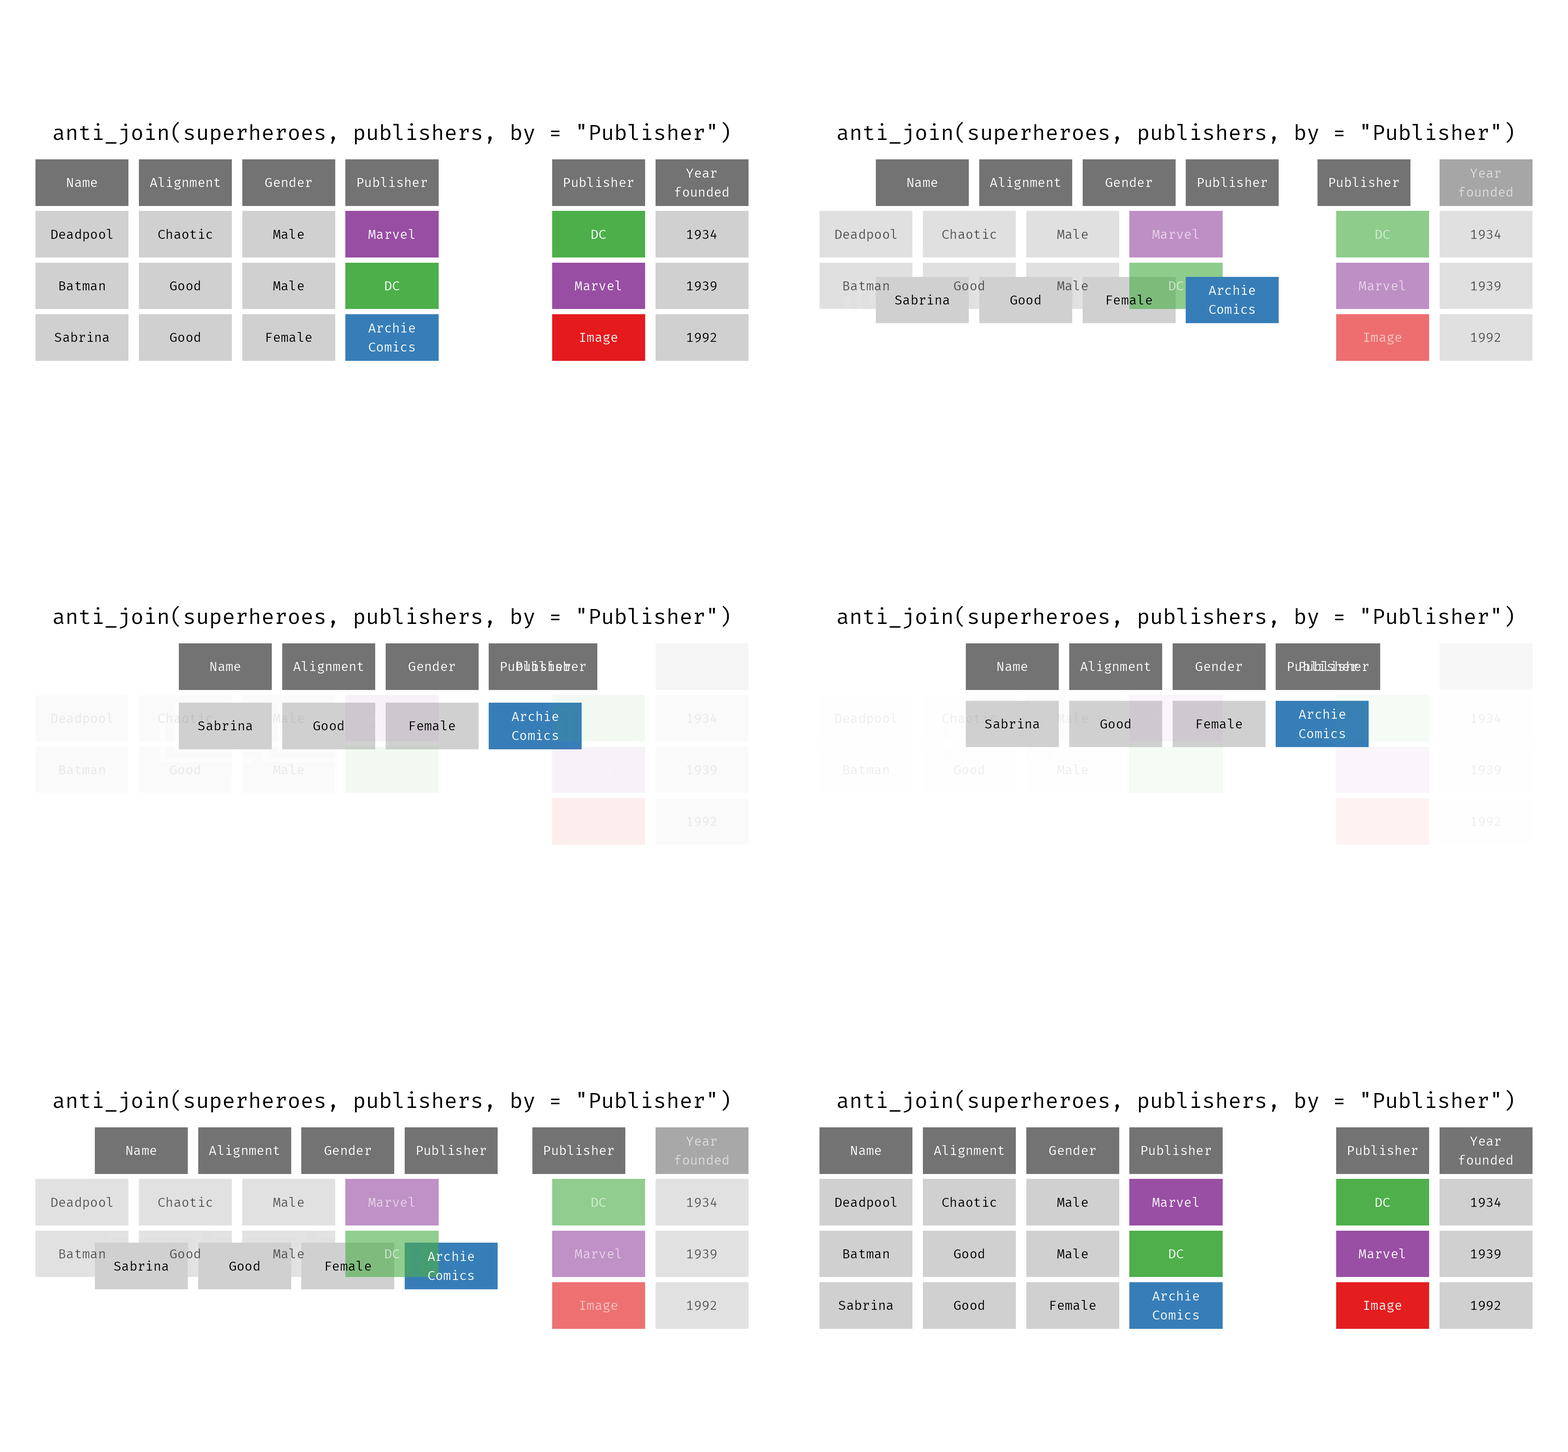
anti_join()
Application exercise

Ivy League representation on the judiciary
TODO simplify this somehow to focus on the relational joins
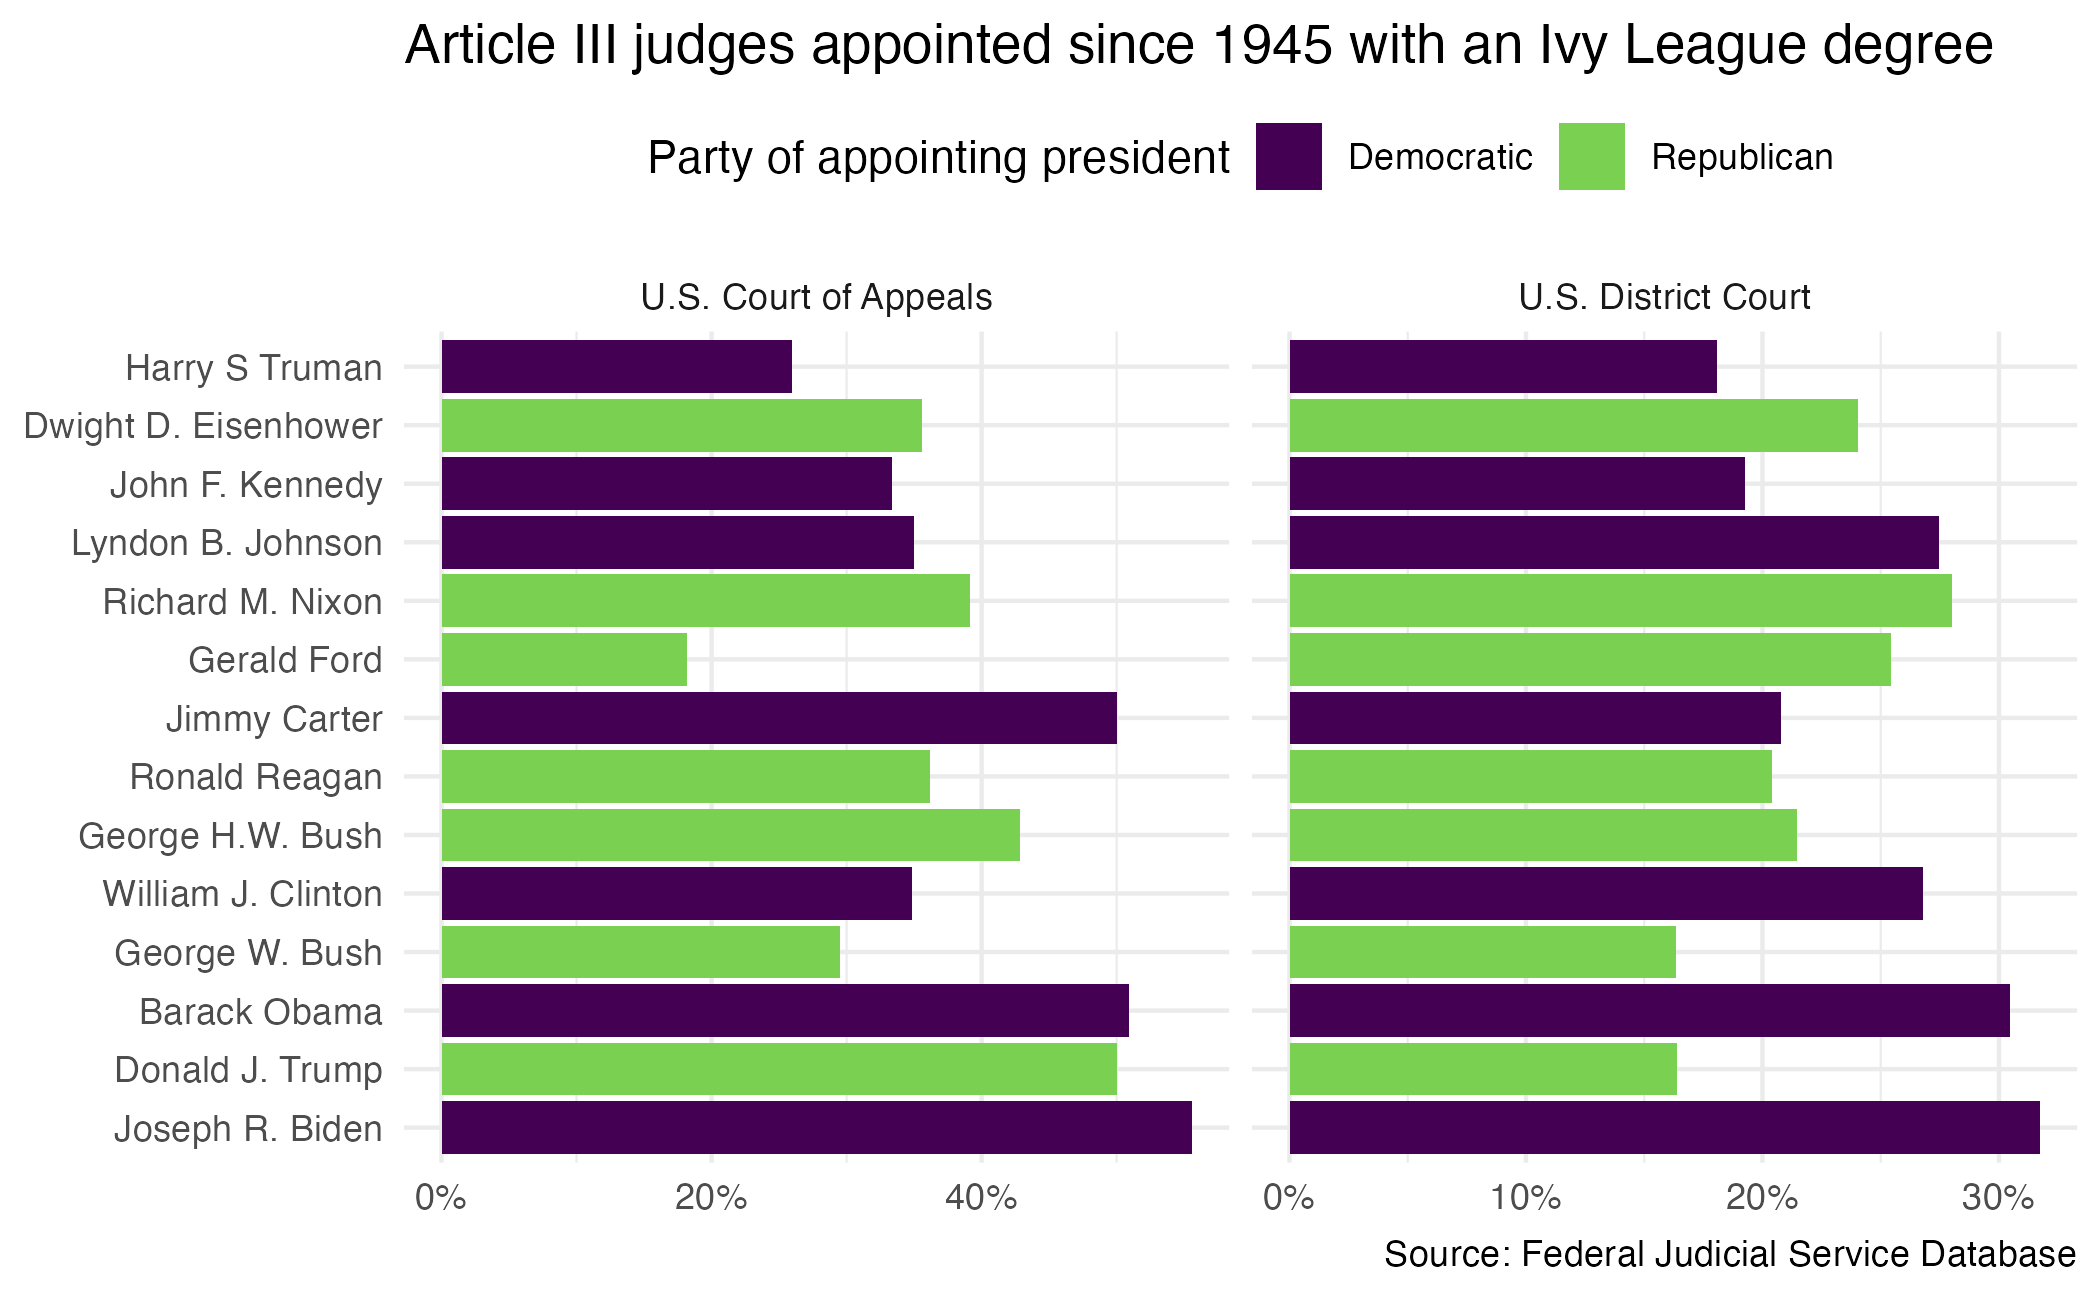
ae-07
Instructions
- Go to the course GitHub org and find your
ae-07(repo name will be suffixed with your GitHub name). - Clone the repo in Positron, run
renv::restore()to install the required packages, open the Quarto document in the repo, and follow along and complete the exercises. - Render, commit, and push your edits by the AE deadline – end of the day
Wrap up
Recap
- Data is often split across multiple tables and we need to bring them together to analyze and visualize
- Use
*_join()functions to combine two tables - Continue to practice data wrangling and transformation operations
Something personal
TODO
