Data wrangling (I)
Lecture 7
Dr. Benjamin Soltoff
Cornell University
INFO 3312/5312 - Spring 2026
February 10, 2026
Announcements
Announcements
- Meet with your project 01 teams
- Draft proposal rendered + committed + pushed to GitHub by 11:59pm on Thursday

- What is the story?
Source: @WhiteHouse
Learning objectives
- Identify the importance of data wrangling
- Review common methods for data wrangling and tidying
- Recreate an existing visualization
- Redesign a visualization for improved clarity
Data wrangling with {dplyr}
Image credit: @allison_horst
Key functions from {dplyr}
filter()arrange()select()rename()mutate()group_by()summarize()slice(),slice_head(),slice_tail(),slice_sample()
Data tidying with {tidyr}
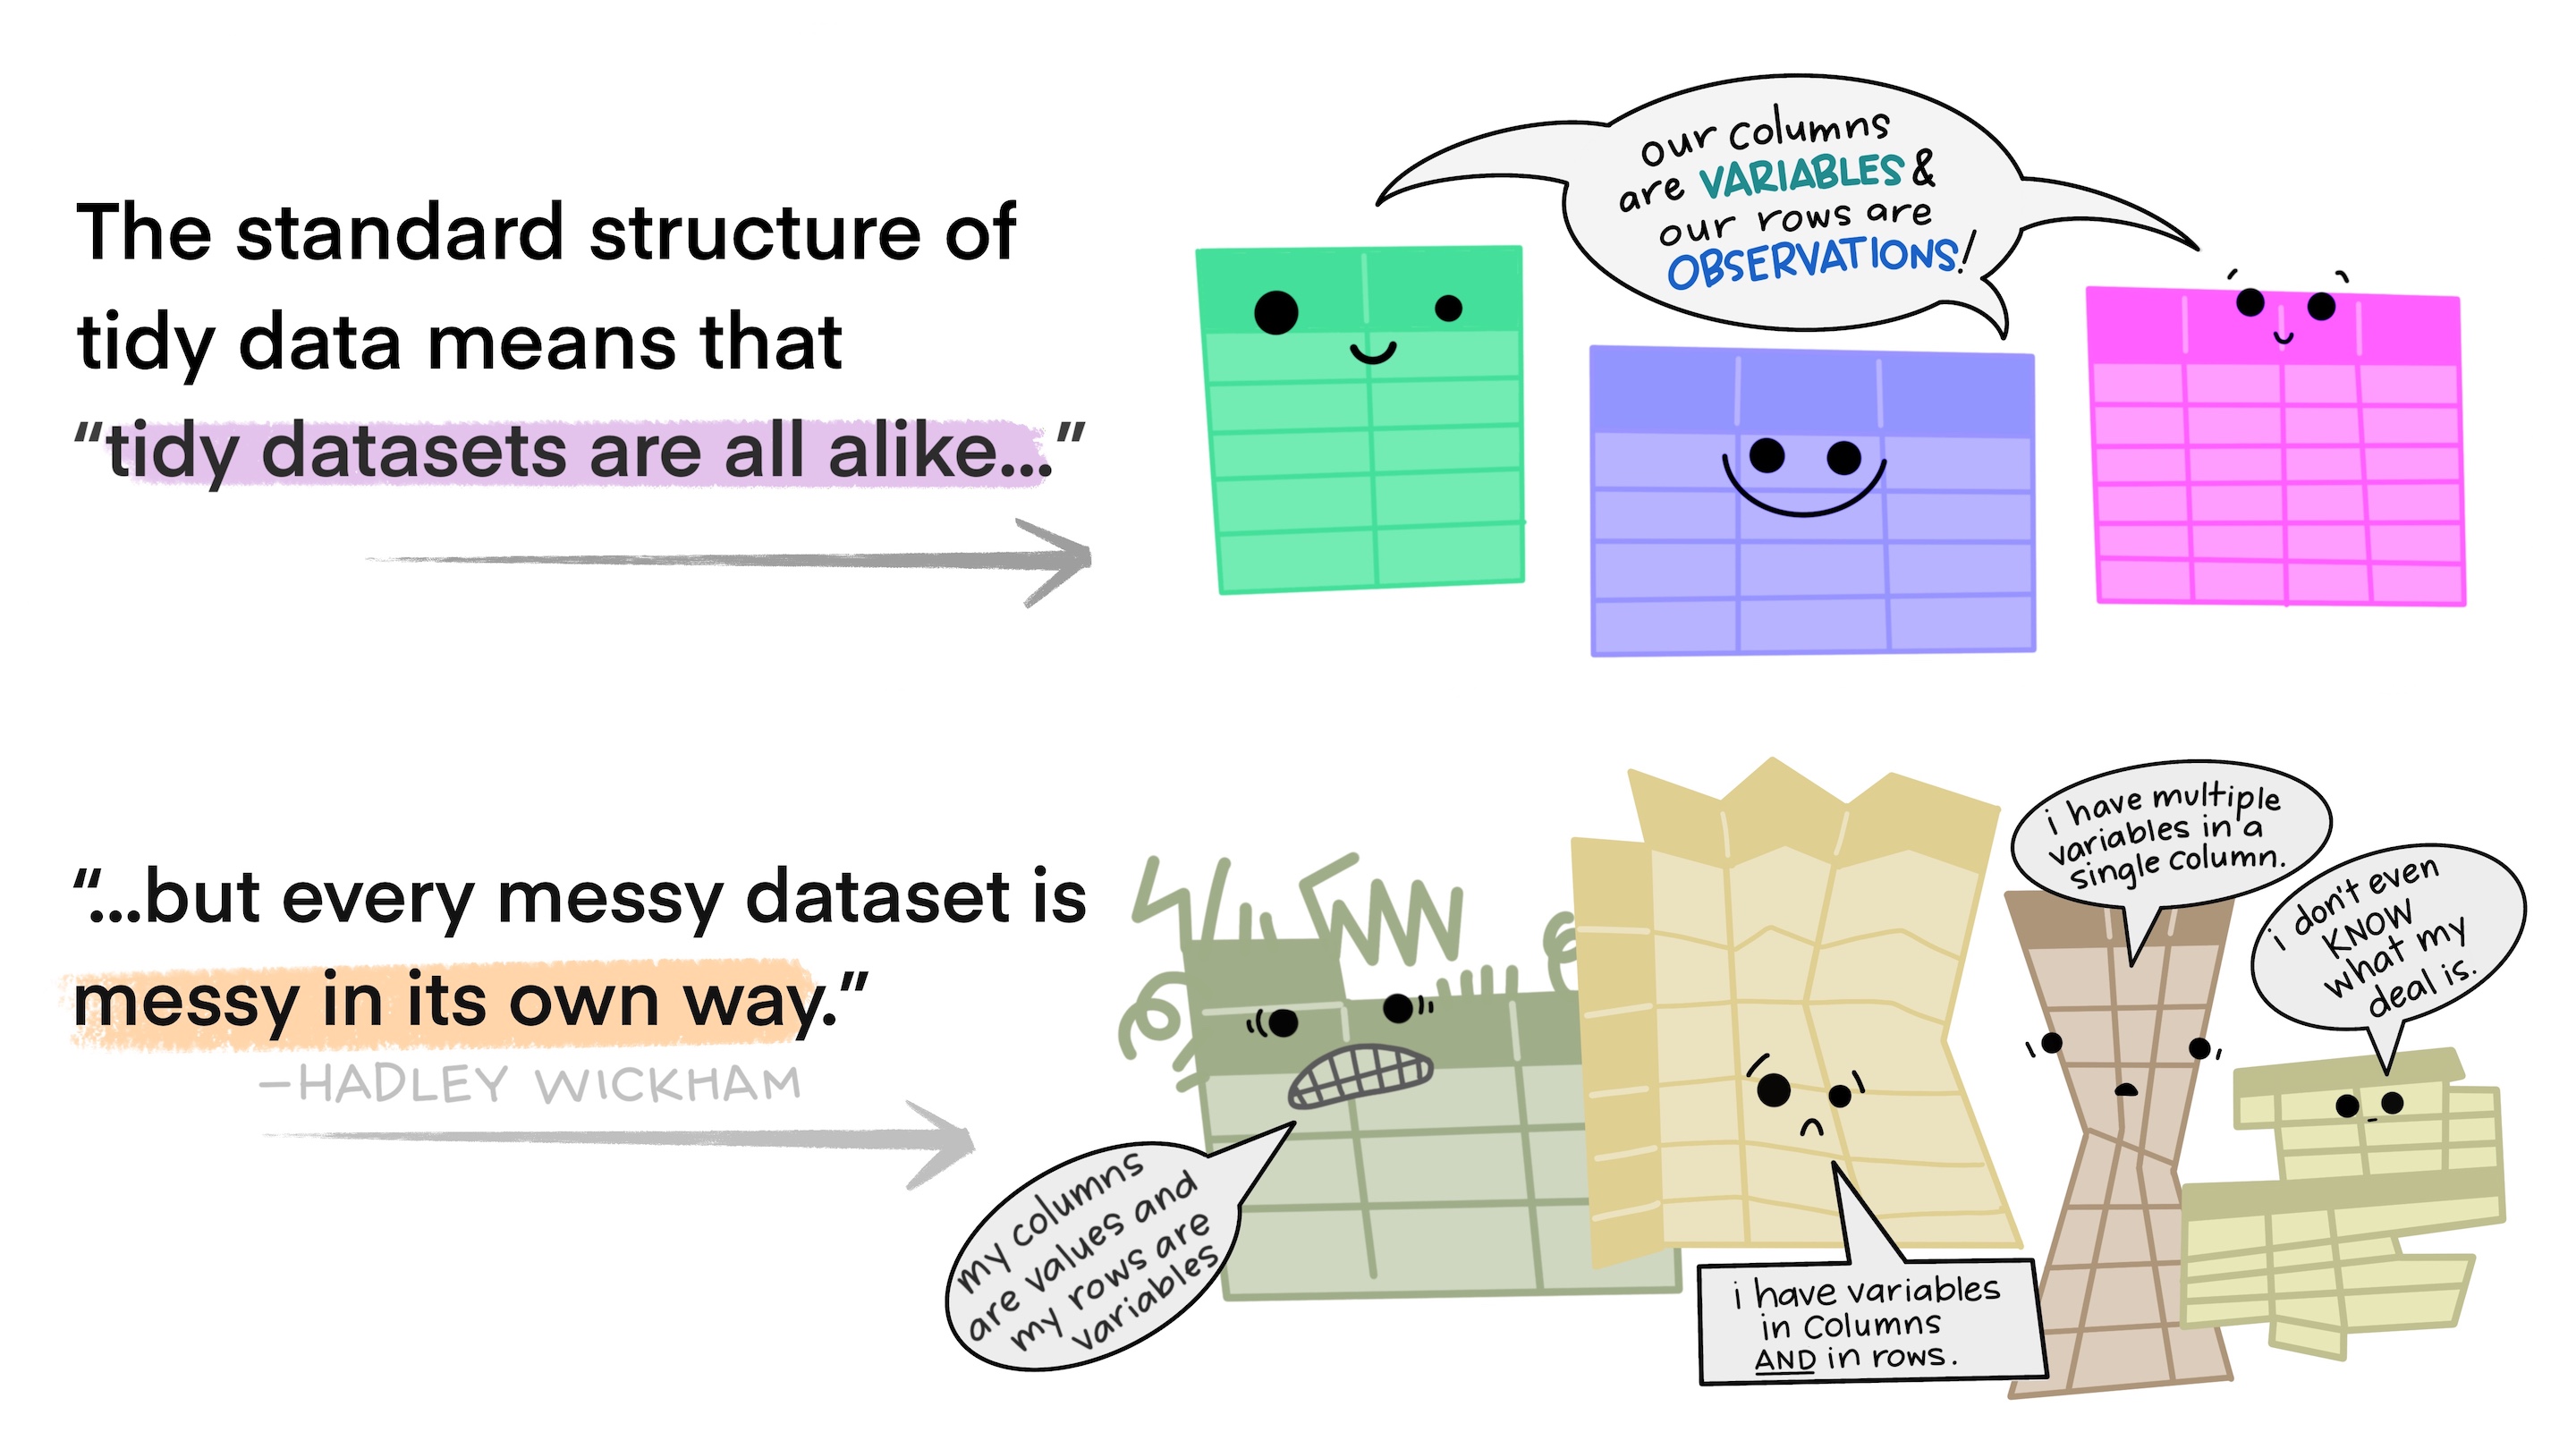
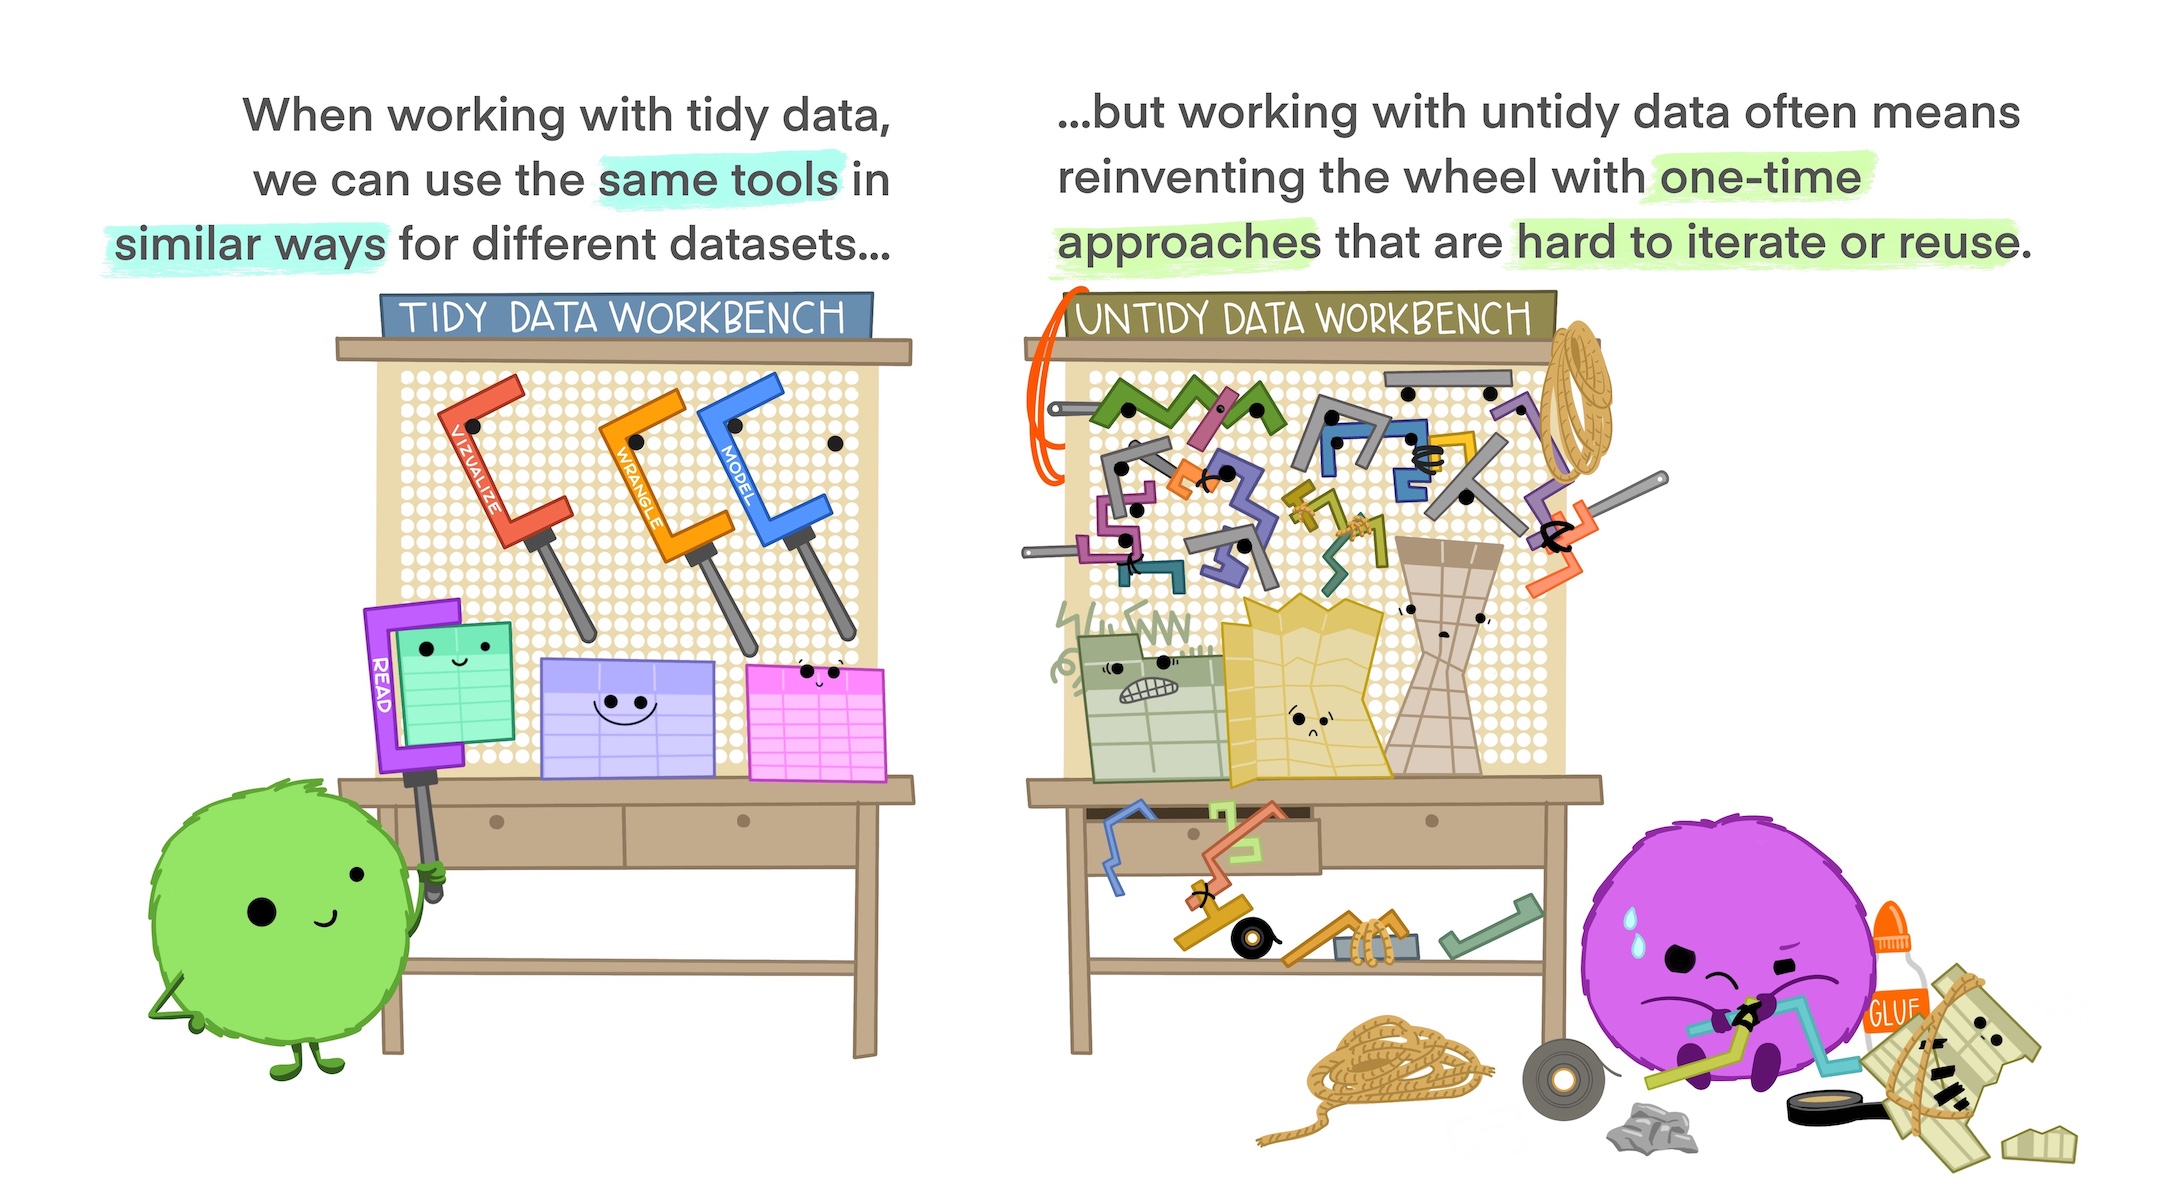
Illustration credit: Tidy Data for reproducibility, efficiency, and collaboration
Common tidying tasks
Pivoting
pivot_longer()pivot_wider()
Rectangling
unnest_longer()unnest_wider()
Character vectors
separate_longer_*()separate_wider_*()unite()
Application exercise
Improve a sad plot
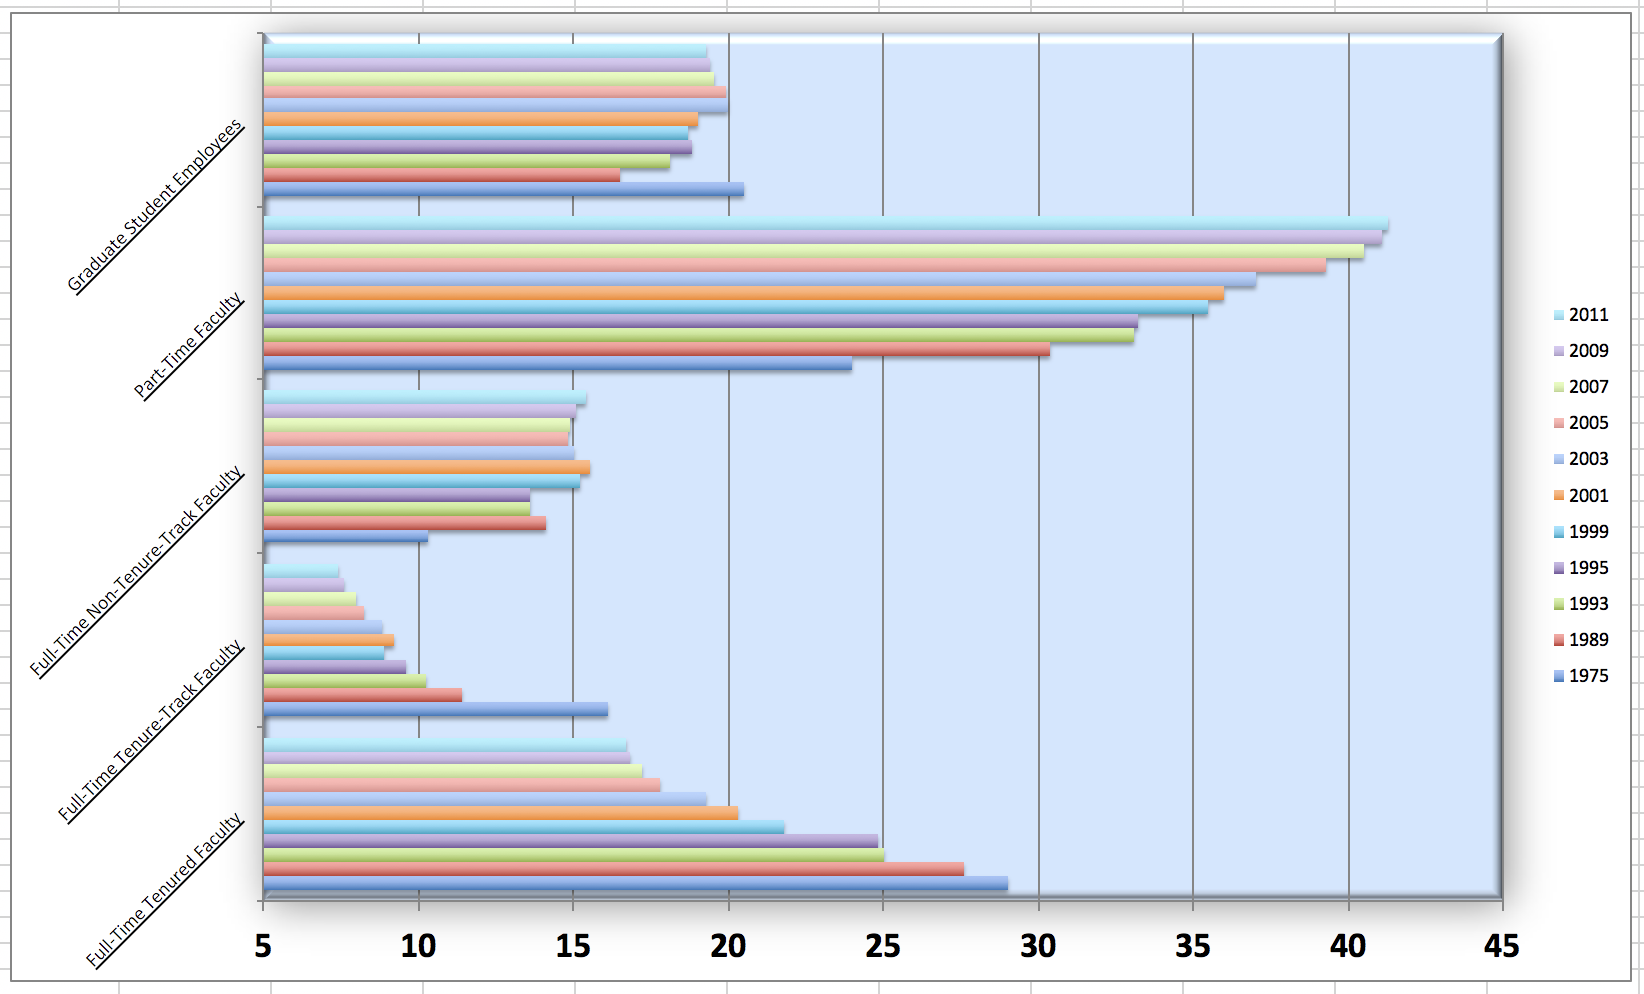
ae-06
Instructions
- Go to the course GitHub org and find your
ae-06(repo name will be suffixed with your GitHub name). - Clone the repo in Positron, run
renv::restore()to install the required packages, open the Quarto document in the repo, and follow along and complete the exercises. - Render, commit, and push your edits by the AE deadline – end of the day
Wrap up
Recap
- Data is often messy and needs to be transformed and reshaped for effective communication
- {dplyr} contains functions for transforming data
- {tidyr} contains functions for reshaping data
- Design choices are crucial to effective storytelling with data
- There is not inherently one “right” choice, but some choices are more effective than others
